Leading vs. Lagging Indicators
Overly enthusiastic newcomers to technical analysis (and some old-timers who should know better) sometimes believe they have found a leading indicator. This is never true. All indicators are based on past price movement, so logically, no indicator can point to the future with any degree of reliability.
Indicators and certain bar configurations may strongly suggest the next price move, especially when they appear together and offer some confirmation, but it is always possible that some piece of news will come out and totally trash the indicated price move. We have all seen cases where three or four “leading” indicators all point in the same direction, and yet the expected price move does not materialize. Indicators only indicate, they do not dictate, and it is a sad fact that we do not have reliability statistics on indicators. If you want to compute a reliability quotient for your indicators, you have to do it yourself. Bottom line: so-called leading indicators are very often wrong.
Leading Indicators
Welles Wilder noted that a change in momentum is often (but not always) a precursor to a change in direction. The model is for momentum to start modestly, accelerate rapidly as the bandwagon forms, peak when nearly all the buyers or sellers have taken positions, and then tail off, whereupon the earliest of the early birds begin to take profit, and that sets off a move in the other direction.
If you can identify the acceleration and deceleration of momentum, you can anticipate the peaks and troughs and position accordingly. The top leading indicators are, therefore, the ones built on momentum:
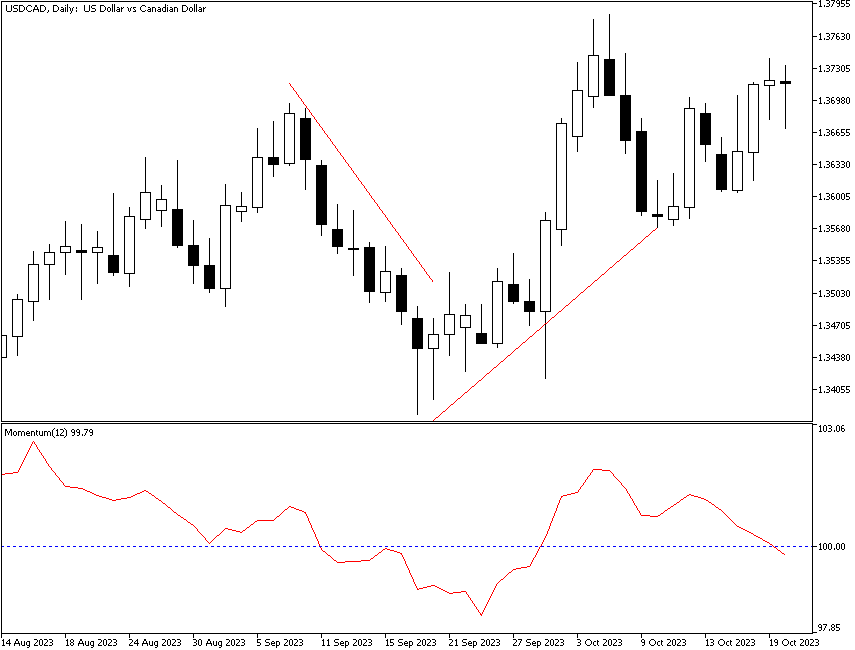
You can use plain old momentum or rate-of-change to identify the stages of momentum. The chart below shows momentum, calculated as the close today divided by the close 12 periods ago. We see momentum falling as the price falls, but then momentum stops falling and starts to rise. We get one more lower spike low, but it happens on a bullish candle with a very long body, which we interpret as a sign that bulls had the upper hand on the market. Sure enough, momentum was a good leading indicator, and the price proceeded upward. After the reasonable move up, momentum peaks on the day before the price peaks and then falls alongside the price. Here, it is a coincident indicator.
ADX measures the strength of a trend and, thus, the degree of bullishness or bearishness. Another leading indicator is the average true range or ATR. Again, market psychology offers an explanation. The range will tend to expand as a higher number of traders do battle over the direction during the period. If bulls win, the close is at or near the high, but the presence of bears is seen by the low fairly far away at the wide end of the average range. When uncertainty rears its head, as occurs near the end of a rally or a rout, the range will contract as fewer traders have a conviction about direction. This is the main reason Wilder used the ATR in calculating the ADX.
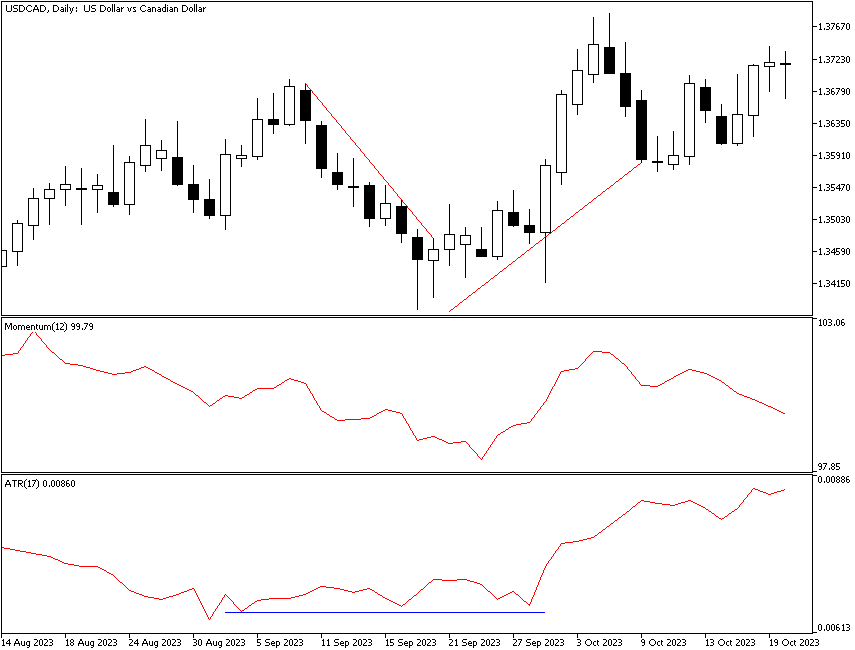
The next chart is the same as the previous one but with ATR added. The horizontal blue line marks where ATR stops falling and is flat, and it even rises a little, but it does not get really sizeable. After the flat region, ATR starts to rise, confirming the upward trend identified by rising momentum.
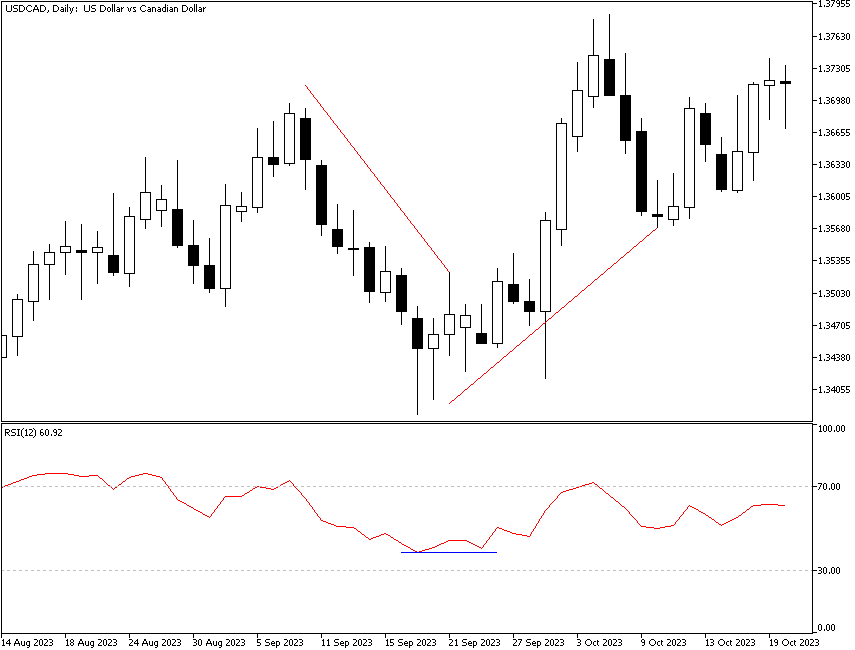
The relative strength index is another momentum-based leading indicator. See the next chart. As with the ATR, we get a horizontal region that indicates momentum has stopped contracting, but the RSI starts to rise before the ATR does.
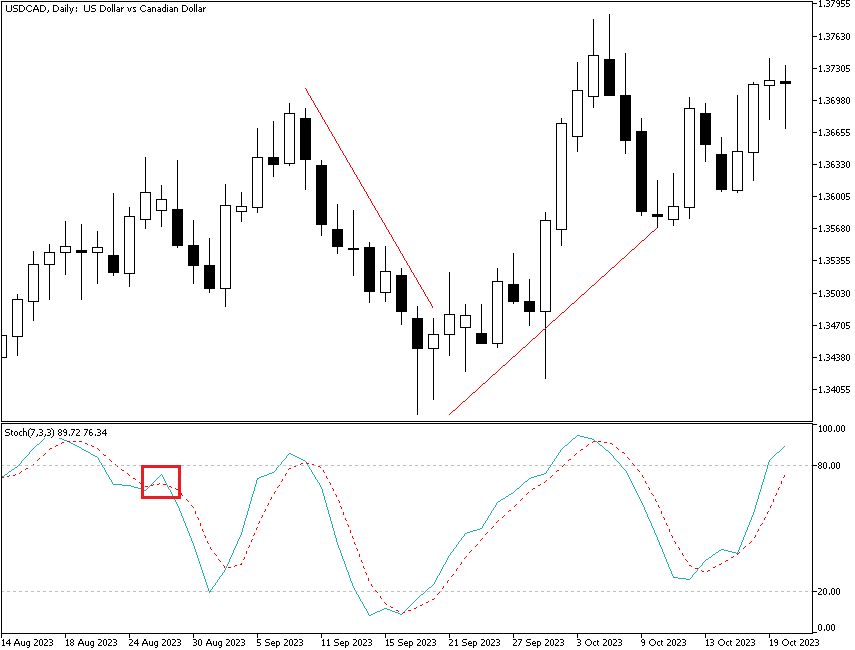
The stochastic oscillator is probably used by more traders than any other indicator to use momentum as a leading indicator. As you can see in the next image, the buy signal comes about 5 days earlier than the buy signal using raw momentum alone. Note that on the left-hand side of the chart the stochastic gives a false buy signal (red box) that is quickly reversed before giving the true buy signal a few periods later.
Finally, MACD, which is the most reliable of indicators in Forex, can be seen below. MACD gives a buy signal later than the stochastic. But later, after the price experiences a correction, we get only the most minor of sell signals, and it lasts only a few periods. If you were using MACD, at least the MACD embodying the parameters shown here, you would probably exit a long position but would not open a short position.
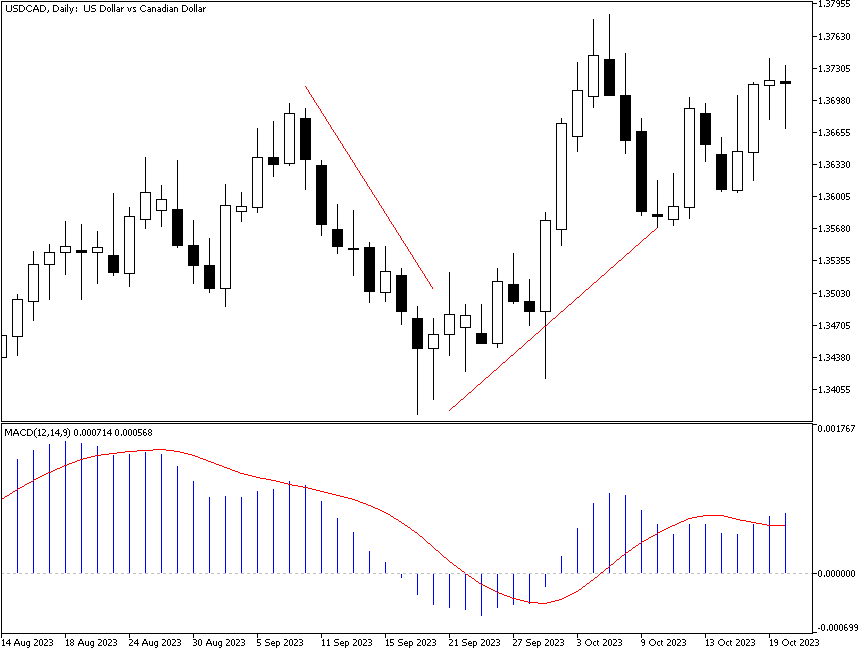
Each of the momentum indicators has its benefits and drawbacks, depending on what kind of trader you are. Fast traders like the stochastic, errors and all, because it keeps them in the market. If you are more risk-averse and prefer to see the bigger picture, MACD will keep you out of a short-lived or false upside bounce like the one shown here. Some analysts consider the MACD a lagging indicator because it bypasses the bounce, but that is a matter of opinion.
Bars, bar configurations, and patterns are as good as leading indicators, if not better, as arithmetic-based indicators. A breakout of a support or resistance line tends to be a reliable leading indicator. A number of bar configurations, including candlesticks, have high predictive value, like spinning tops, hammers, and hanging men, etc. Other fairly reliable patterns include double top and bottom, gaps, and island reversals.
Lagging Indicators
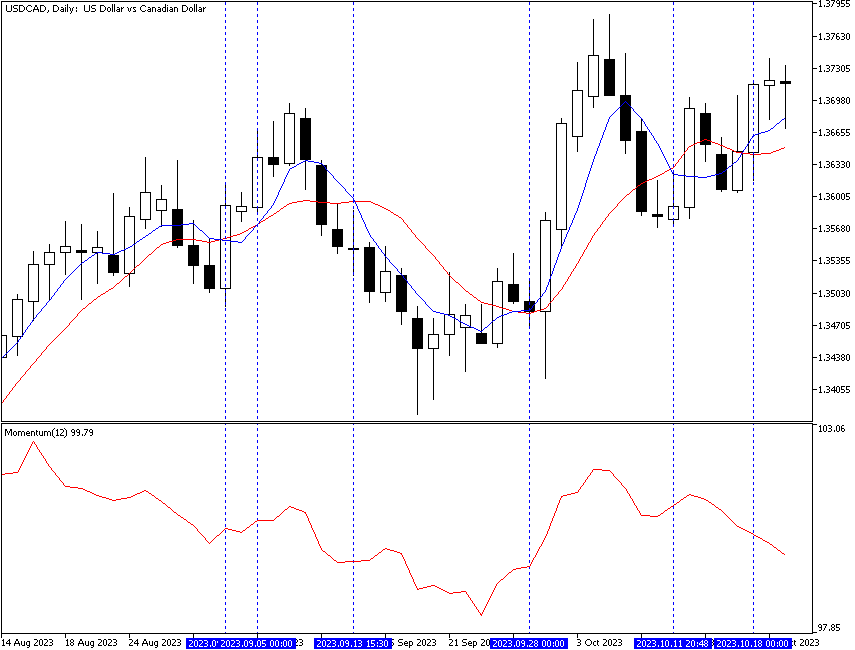
Any indicator based on a moving average is, by definition, lagging. The benefit of lagging indicators is their reliability quotient. By the time you get a moving average crossover using 5 and 10 periods or 10 and 20 periods, for example, the probability of your trade being in error is quite low. The next chart shows the 5-period moving average crossover of the 10-period, with the 12-period momentum in the bottom window. In this instance, the vertical lines mark the crossovers, and two crossovers in the middle of the chart happen to coincide with the dates when momentum was signaling buy or sell. The bearish crossover on the left was a trap, which could be predicted thanks to the fact that it contradicted the momentum indicator. The bearish crossover on the right also went against momentum and was also short-lived. The final, this time bullish, crossover also points in the direction opposite to momentum, meaning that it is probably also a trap. Usually, momentum leads by a few periods, and using a leading indicator together with a lagging indicator is to apply the confirmation principle. Because no indicator is reliable all the time, the confirmation principle is a really good idea, especially if you scale in to the trade using a leading indicator for your first small position and add to it when you have agreement from a lagging indicator.
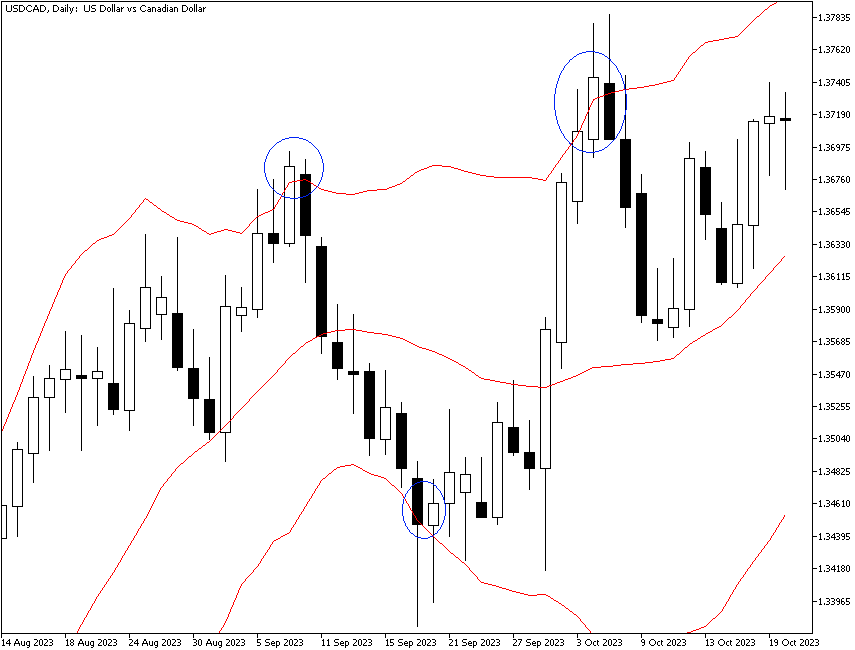
Bollinger bands are based on a moving average and so should be a lagging indicator, but in Forex, they can be either leading, coincident, or lagging. As noted in the lesson on Bollinger bands, when the price breaks the indicator's top or bottom, it is considered a breakout and is likely to be followed by a move in the same direction. Not in Forex. In Forex, we expect the opposite effect — a breakout is followed by a move in the opposite direction. The breakout may last two or three periods (and as many as five) before the reversal, but hardly ever more than that.
The final chart shows the same currency pair on the same timeframe, with breakouts of the Bollinger band marked with blue circles. Note that each of the breakouts resulted in a reversal of the trend after a day or two. This makes Bollinger great for confirmation of other indicators.
To summarize, the distinction between leading and lagging indicators is not a terribly useful one as long as you acknowledge that momentum will often lead and moving averages will always lag. You can never make a moving average a leading indicator, but the so-called leading indicators will generate a fair number of false (wrong) signals.