Moving Average Crossover
You can get a better idea of the direction a price is moving by looking at moving averages than by eyeballing the raw chart alone. As discussed in the previous lesson, the price crossing a moving average is a valid trading rule, but it delivers a lot of whipsaw losses. You can get a better buy-sell trading signal from the crossover of two moving averages. Using two moving averages instead of the price crossing a moving average reduces whipsaws. You still get them, but they will be fewer in number.
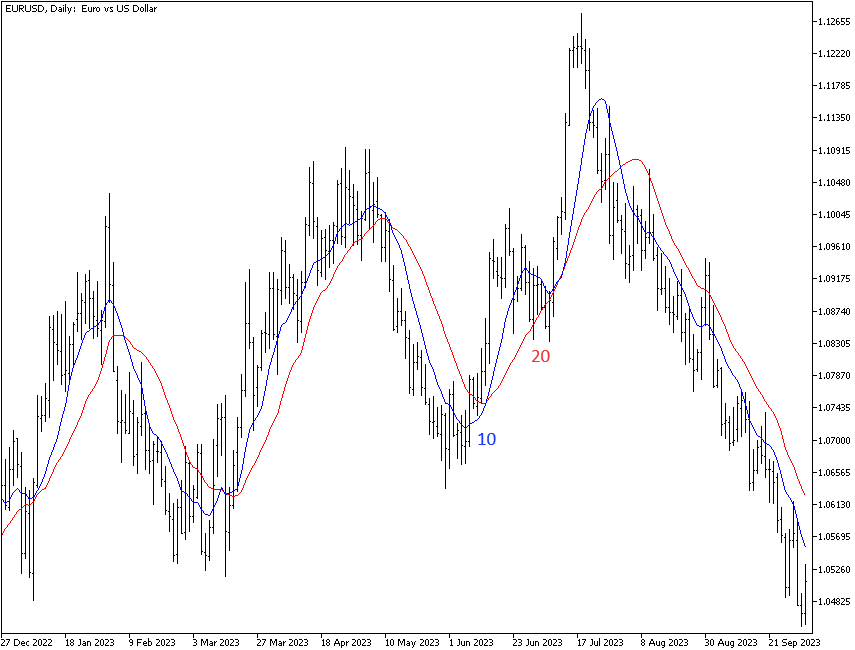
A classic example is when the 10-day crosses above the 20-day, you should buy. You should sell when the 20-day crosses the 10-day to the downside. We have been observing this particular moving average daily on multiple Forex chart combinations since 1979 and can affirm that it is a reliable indicator of direction change in Forex more than half the time. Some technical analysts apply the word “breakout” to the crossover.
The example chart below shows the blue 10-day moving average plotted against the red 20-day. This chart has five crossovers. There is an interesting space in the right-hand side of the chart where the blue 10-day falls to approach the 20-day, but it does not actually cross it. Each trade on this chart would have been profitable. Note that most charts of this duration will have at least one or two whipsaw losses.
Note that one bit of Forex trading lore has it that if the price breaks the 10-period moving average, it will continue to be just a hair shy of the 20-day. We cannot verify this lore with historical data, but some traders count on it and will always short a currency that crosses the 10-day with a profit target a few points short of the 20-day.
You are free to experiment with other combinations of moving averages, especially if the 20-period delivers too many whipsaws. Raise it to 22 periods. Some traders try to game the market by using oddball combinations, like 7 and 13 or 15 and 30. Be aware that there is no magic combination for a single currency or across all Forex prices. All moving average combinations deliver whipsaw losses, and they all lag the real action.
Fractals Again
The 10 and 20-day moving average combination is a classic regime – on the daily chart. You are probably using charts with the daily timeframe, 4-hour timeframe, and the one-hour timeframe. Note that the 20-period has magic properties on all timeframes, even the one-hour. This is not so mysterious if you stop and think about it. The 5-day is a week of trading days. The 10-day is two weeks. The 20-day is not quite a month (which is actually 22 days), but it is close enough for rough estimates. On the hourly chart, the 20-period is nearly a full 24-hour cycle. For some reason, prices are magnetically attracted to the 20-period moving average, and the price breaking the moving average line often has real meaning, not least because you know that in a two-moving average trading system, the price is going to drag the 10-day moving average down with it — unless a low is an aberrant spike. Sometimes, the price will be repelled at only a point or two away from the 20-period. This occurs more often than chance would allow.
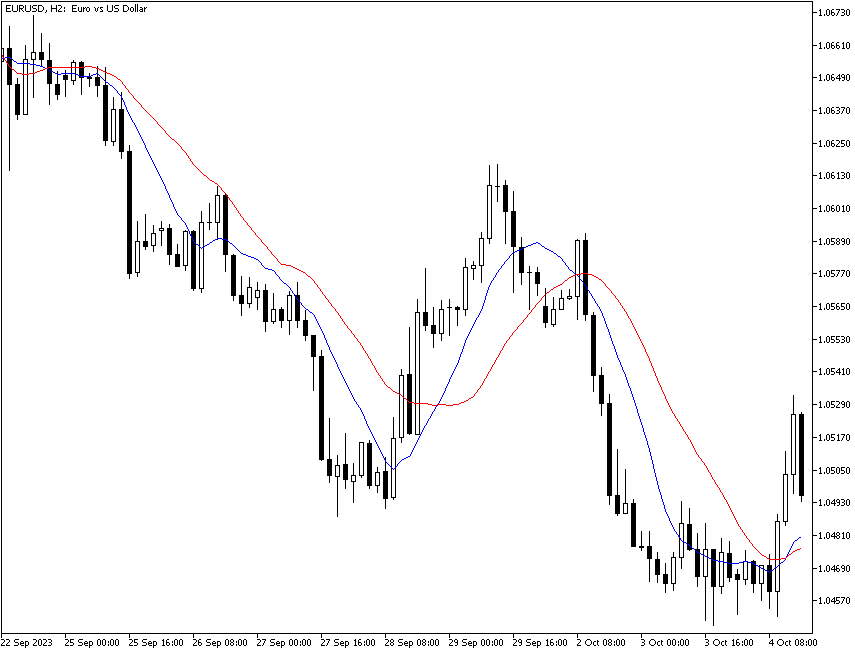
The important point is that you can get a perfectly acceptable trading system using the two-moving average trading system in any timeframe. See the next chart, which shows the EUR/USD on the two-hour (120-minute) timeframe. Again, we see the blue 10-period MA crossing below the 20-period on the left-hand side of the chart, then an upside crossover, and after that, resumption of the down move. Notice that the price does not cross the 10-day until four periods (or 8 hours) after the highest high of the rebound, and you do not get the 10-day crossing the 20-day until another 6 periods after that, or a 20-hour delay in getting a confirmed sell signal.
After whipsaws, this is the biggest problem with using a moving average crossover trading regime — it lags. Actually, just about every technical indicator has some lag, but moving averages lag the most of all.
Moving Average Ribbon
Why not put a whole slew of moving averages on one chart? This idea was put forward by Daryl Guppy and is named the moving average ribbon. The following chart illustrates the concept. The moving averages on this chart number 12, with each one adjusted by the same number of periods (one day) above and below the 20-day (from 14-day to 26-day average).
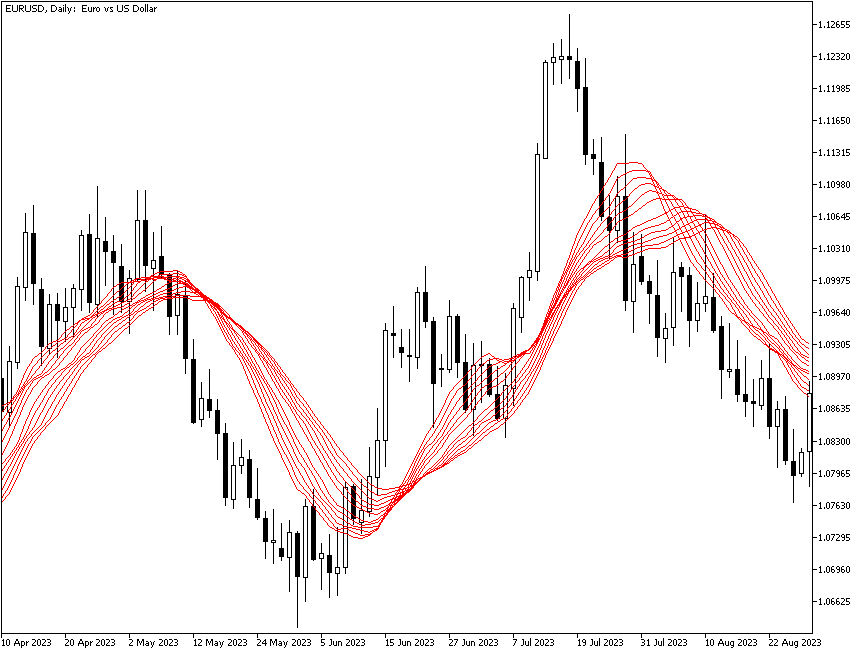
When we look at a moving average ribbon, we are not as concerned with any crossovers as we are interested in the space between the individual moving averages. When the moving averages are converging and getting closer together, traders are almost literally coming together to forge a consensus point of view about direction. When the moving averages are running in parallel, agreement has been reached. But when the moving averages are diverging and widening out, you have divergent points of view among the traders in this currency — and one of them is going to win.
As you can see on the chart above, there is a lot of daylight between lines on the left-hand side of the chart. The price has dipped sharply, but the strands of the ribbon are wide apart — traders do not agree. Sure enough, the up move resumes, and in the center of the chart, the ribbon strands get very close together and are running in parallel. By this point, the price is well above all the moving averages, and the ribbon has tightened down to a thin collection of lines. If you did not already have a position and are deeply risk-averse, that narrowest point is a confidence-builder that buying right here would be a good idea. And the decision would be vindicated by the price making a new highest high right afterward.
The moving average ribbon is an intriguing idea. It is probably more useful as a sentiment indicator than a trading guide.
Did You Know?
In equity markets, chartists came up with the idea that the 100-day (which is a little more than one calendar quarter) and the 200-day (which is nearly a year’s worth of data, the business year actually having about 240 days) are important numbers. If you conduct a backtest on any of the major equity indices, such as the S&P 500, you will find that these magic numbers are not really significant, but that is not the point — plenty of traders believe that they are and will act accordingly. The best we can say about the 200-day is that it means “long-term.”
Now comes the silly stuff. When the 100-day crosses the 200-day to the upside, it is named a “golden cross” and is a buy signal. When the 100-day crosses the 200-day to the downside, it’s called a “death cross” and is a sell signal. Both concepts are utter nonsense in equities and in Forex alike, by which we mean there is no empirical evidence from the historical record that these crosses are associated with major turning points, but be aware that not everyone agrees.