Basic Japanese Candlestick Patterns
Some candlesticks stand alone and have a specific meaning, while others need to be interpreted in the context of the other candlesticks that come before or after — specific combinations. Stand-alone candlesticks that we often see in Forex are the doji, spinning top, and hammer or hanging man.
There are far more patterns of multiple candlesticks than there are stand-alone candles with high meaning. Specific combinations include the star formations, engulfing bull or engulfing bear, the harami, evening and morning stars, three white soldiers or three black crows, tweezers bottom or top, and many others. In total, there are over 100 candlestick patterns, but if you learn just a handful, they will help your understanding of market sentiment. Many people believe that candlestick patterns excel in identifying reversal points, and in Forex, so many people agree with this view that you do yourself a disservice if you do not learn at least some of the key patterns.
Stand-Alone Candlesticks
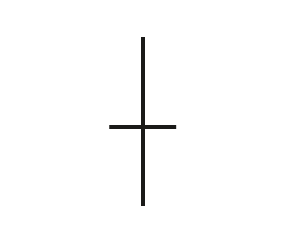
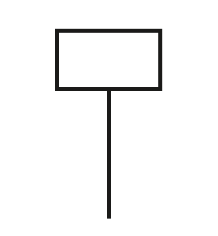
A special version of the candlestick is the doji. The open and close are so close together that the real body is just a line. The high and low project off the top and bottom, but the main action — the range between open and close — is minimal. A doji looks like a "+" sign. A doji means buyers may have tried to get the price higher during the course of the trading session, but they could not get it to close higher. Similarly, sellers may have gotten a lower price during the session, as shown by the lower shadow, but they could not get it to close lower. The day’s trading action was a standoff between bulls and bears — nobody won. The appearance of a doji — or worse, a series of dojis — means the market is paralyzed by indecision. It needs a new factor to trade on, and when that factor appears, the price will deliver a breakout.
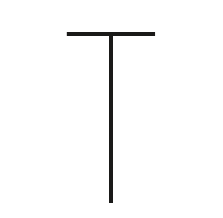
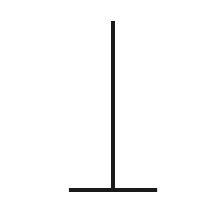
When the doji has an exceptionally long lower shadow, meaning the open and close are the same near the top of the lower shadow, it is named a dragonfly. A dragonfly coming after a series of lower closes may mean the down move is ending — bears could not get the close under the open. When the long shadow is the upper one, meaning the open and the close are the same at the bottom of the bar, it is named a gravestone. In Forex, a gravestone candle that shows up in an up move is a sign the bulls could not get the close above the open in that period — watch out.
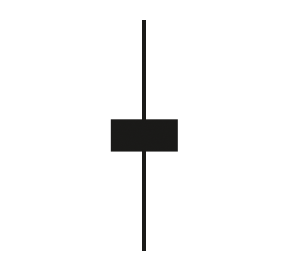
The spinning top is a candlestick in which the upper and lower shadows are taller than the real body. A little reflection shows why this is a sign of indecisiveness, like the doji — traders put in a significant high but could not get the currency to close there, and also a significant low but couldn’t get it to close there.
A series of dojis or spinning tops with the closes not far from one another is a danger sign — the market is range-trading and needs a catalyst for a breakout.
A hammer has a long lower shadow, meaning the price moved lower after the open but then rallied to close nearer to the open but still below it. That means it is a black or filled candlestick, and if it comes after a series of falling candles, it is a continuation pattern. If it comes after a series of rising candles, it is bearish and named a hanging man since it signals the possible end of the rise. We might say that the hammer does not really stand alone, but you will see it as stand-alone at first and then realize you need to look at what precedes it.

Combination Patterns
A star candlestick is one that stands apart from the preceding candle – separated by a gap. A gap always reflects special circumstances, especially in Forex, where the market is hardly ever closed. Fresh news has come out or some event has occurred to shock prices into a gap higher or lower. Stars come in various forms but always have a small real body — implying that while the gap may have meaning, the market remains at least a little uncertain. The candlestick term for a gap is a rising (or falling) window, a suggestive name. If the star is a white candle on a rising window following an up move, it often means the price rise is ending. This seems counterintuitive at first, but not if you think of the gap as a last gasp. The next candle will likely be black, and it may well “close the gap.”
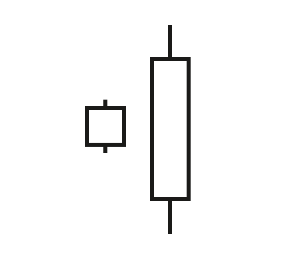
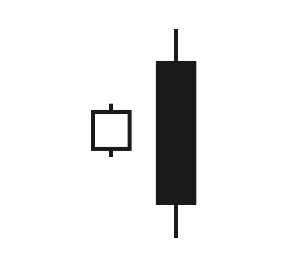
Engulfing candles are the opposite of dojis — they have long real bodies, so long that the open and close both surpass the open and close of the preceding bar. As in all bars, the bigger the candle, the more trading action occurred during the period. A bullish engulfing candle started out with an open below the bottom of the body the day before and closed over the top of the body the day before — lots of action and ending positively. The bearish engulfing candlestick is black and started the period above the top of the real body of the candle the period before — but then crashed, closing below the real body of the candle before. The relatively bigger size of the real body “engulfs” the candle of the period before and means strong sentiment. Both bullish and bearish engulfing candlesticks are seen in Forex, and they are reliable more than half the time.
One pattern that tends not to be reliable in Forex is three white soldiers and three black crows. These are three very large candles in a row. The conventional interpretation would have it that the 4th bar will also be higher (or lower), but that tends not to be the case in Forex. The next high or low may continue the trend, but not necessarily the close. This is one of many instances when it pays to combine candlesticks with other indicators, especially momentum, relative strength, and MACD.
As noted above, there are over 100 candlestick patterns — but there are more books and websites devoted to candlesticks than there are patterns! Candlesticks are a wonderful antidote to mechanical indicators because they constantly remind us that we are not dealing with physics or engineering but with human sentiment. The language of candlesticks helps — hanging man, gravestone, abandoned baby. However, you need to remember that candlesticks are like any other indicator — they indicate, they do not dictate. And their predictive value extends only as far as the next bar.