Stochastic Oscillator
The word “stochastic” refers to randomness, and thus, it is particularly unsuited for technical studies that seek pattern repetitions, i.e., non-randomness. Nevertheless, that is the name the inventor of the stochastic oscillator, George Lane, gave his tool, and we are stuck with it.
The stochastic oscillator is a momentum indicator that shows the placement of the close within the high-low range over a fixed period. The nearer the close to the highs, the greater the upward momentum. When the close starts to get nearer to the lows, a form of deceleration, we assume that falling upward momentum may well imply a change in direction. Lane believed that a change in momentum precedes a change in trend direction. On the whole, this is true, except when the market receives a shock. Then direction can turn on a dime with no advance warning from the stochastic oscillator (and remember, we get a fair number of shocks in Forex).
Like all oscillators, the stochastic oscillator is contained within a range. In this case, it is set by the widest high-low in the period under review, say 14 periods (the default setting). When the price is closing at or near the highs of the high-low range for a prolonged period, like all 14 days, the arithmetic of the indicator puts the indicator value up at or near 100%. The same is true on the downside — when the price is closing at or near the lows, the indicator will come out at zero. Sustained moves like this are not normal, and so we consider that an indicator reading near +100 or zero indicates overbought or oversold. In practice, most software will place the overbought/oversold line at 80 and 20.
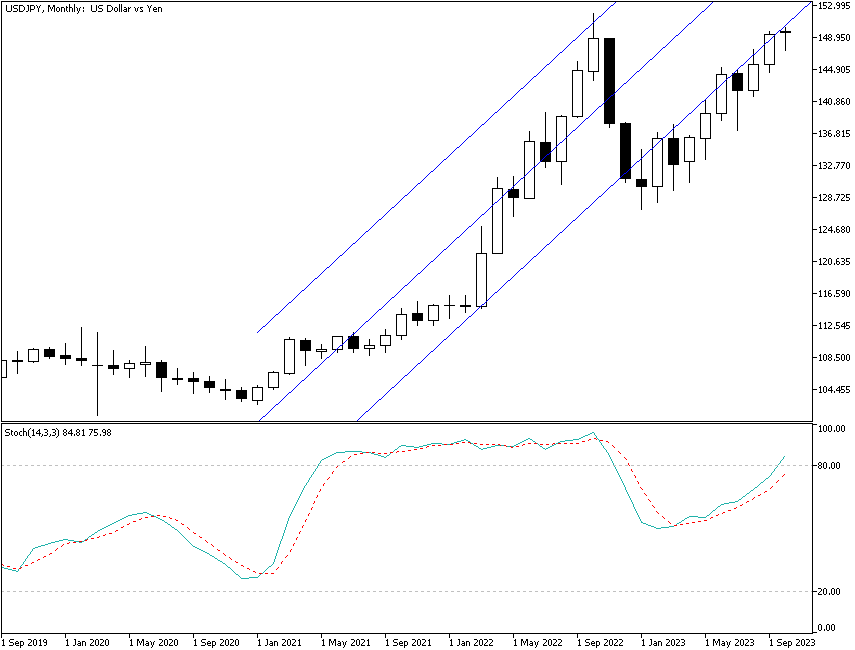
The stochastic oscillator is probably the most popular of the indicators in Forex used to estimate overbought/oversold, but watch out! It has the sad drawback of naming a currency overbought or oversold when it is really just on a prolonged trend. This is especially noticeable in USD/JPY, which can get the bit in its teeth and trend in a single direction for months while the stochastic oscillator keeps signaling that you should get out. The stochastic oscillator on the chart below shows the USD/JPY overbought between May 2021 and November 2022, even before the strong rally started in March 2022.

The formula for the stochastic oscillator comes in two parts. The first line of the indicator is:

This line is named %K, and K has no meaning except it was the letter of the alphabet Lane had reached when he found this version of the close relative to the range.
The second line of the indicator is the trigger line, and it is the 3-day simple moving average of %K. The second line is named %D, for the same reason as %K was named. Because it is a moving average, it will always lag %K and is named the “slow” component. As in all moving average exercises, the crossover is the triggered buy or sell signal, although, as noted above, extreme levels at 80 and 20 are also consulted to identify overbought/oversold.
The default period for the oscillator is 14 periods, but you are welcome to fiddle with other numbers. You can also dress up both components to make them faster and slower, and you will see numerous variations.
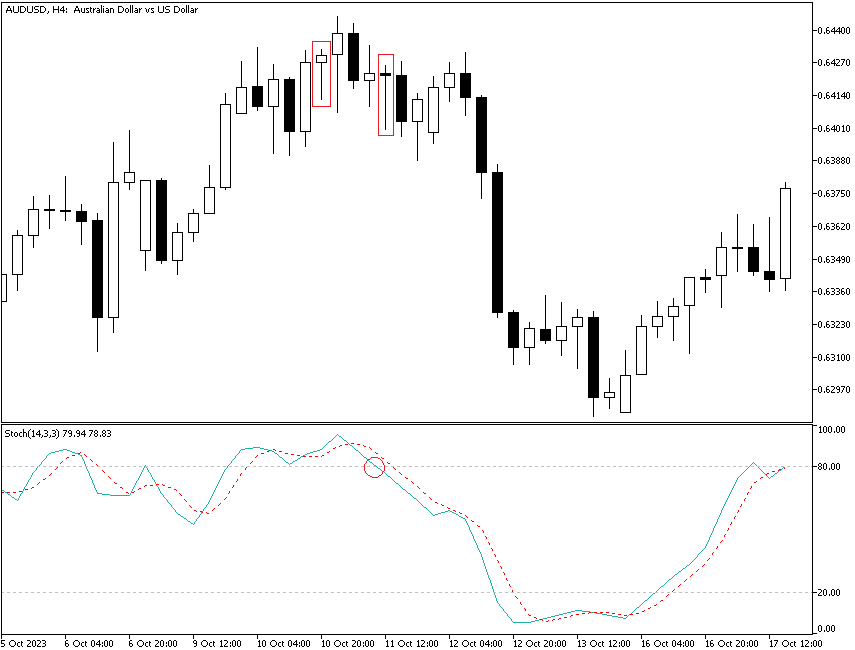
The stochastic oscillator is popular in Forex and widely considered a must-have indicator on every chart. Many analysts have an exaggerated view of its applicability. The stochastic oscillator can be dead wrong, repeatedly, if the currency is range-trading but in a choppy, wide range. Because Lane invented it in the 1950s, some writers say it has “stood the test of time.” This is silly. It is arithmetic — of course, it is valid and delivers reliable signals at least some of the time. The stochastic is most helpful in cases where you have other indicators to buttress a signal or an overbought/oversold judgment. See the next chart, for example. The currency pair is rising, but a hanging man candle appears, warning that the uptrend may be running out of steam. Yet one candle is not enough to confirm that, and the stochastic oscillator continues to show that the upward momentum still persists. Indeed, the pair moves to a new high. But the upward momentum waned after all, and the AUD/USD pair started to move lower. The oscillator lost its overbought status, and in the very next 4-hour period, a new hanging man candle appeared, confirming that the uptrend had probably come to an end. Prices were meandering in a range for a short while, and even attempted a rebound. Yet the oscillator stubbornly continued to point down, hinting that the rebound was false. And indeed, the currency pair sank afterward. In this instance, the stochastic oscillator confirmed an end to the uptrend and managed to warn about a bullish trap.

The stochastic oscillator works on multiple timeframes, but when you start looking at them, it will be easy to get confused. You can easily have a situation where the oscillator is overbought in two of four timeframes and oversold in the others. This is just a function of the arithmetic. If you want to use the stochastic oscillator in multiple timeframes, you need to use more periods in the shorter timeframes to get the indicator to “sync” across timeframes.