Moving Averages
Moving averages are not fancy and glamorous. The name is not impressive, and you cannot boast that you have a special, secret tool. And yet, moving averages are probably the single most useful technique in the technical analysis toolkit and form the basis of many, many indicators. Your eye tries to see regularity in a chart of bars, and it does that by blanking out outlier highs and lows, considered “noise,” and seeking a center. The moving average saves your eye by smoothing out the outlier highs and lows so that you can more readily see the direction in which prices are moving. A moving average outlines the current direction of prices, but always with a lag.
Calculations
A moving average is a simple average of prices, almost always the closing price, to which you add the new period’s data and subtract the first period’s data to keep the number of periods constant. Say you have 10 periods worth of prices. You sum them up and divide by 10. In the next period, you drop the first data point, add today’s new data, and divide by 10 again. By adding a period and dropping a period, the average “moves.”
That would be a simple moving average. Each data point has an equal weight. You can also weigh more recent data more heavily so that the moving average is closer to current prices and more representative of what is going on. There are two ways to do this — the exponential moving average and the weighted moving average. Technically, both are “weighted” moving averages. The first is weighted exponentially, and the plain “weighted” has individual progressive weights applied to each data point. All trading platforms offer these moving average variations, so you do not really need to know how to calculate them by hand, although you can easily do it in Excel or similar software.
Weighted Moving Average
Let’s say you have a series of 3 data points. You apply a weight of 3 to today, 2 to yesterday, and 1 to the first day. Today’s price is three times more heavily weighted than the price three days ago. In the example in the table below, the weighted moving average for USD/JPY comes out at ¥100.63, a little higher than the simple moving average but correctly reflecting the bigger price move between Day 2 and today.
Trick: You have to remember to sum the weighting factors correctly. It is easy to forget that when you multiply by one, nothing happens to the base amount, but when you add it to a series, the series goes up by one. This may seem too obvious to mention, but when you divide the weighted sums by 5 instead of by 6, you can be scratching your head to find your error.
| Day 3 | Day 2 | Day 1 (Today) | ||
|
Price |
100.40 |
100.50 |
100.80 |
|
|
Factor |
1 |
2 |
3 |
6 |
|
Weight |
1 × 100.40 |
2 × 100.50 |
3 × 100.80 |
|
|
|
100.40 + |
201.00 + |
302.40 = |
603.80 / 6 = 100.63 |
|
Simple MA |
|
|
|
100.57 |
Exponential Moving Average
Instead of applying a fixed numerical weight, the exponential moving average is calculated by applying a “smoothing constant,” which is fixed for each specific number of days in the moving average. The formula is
where N — is the number of periods.
Examples:
- 10-day EMA = 2 / (10 + 1) = 18.8%
- 20-day EMA = 9.52%
- 50-day EMA = 3.92%
These percentage amounts are applied to the last data point added to the series so that the last data point in a 50-day exponential moving average is weighted by 3.92%, but in a 10-day, by 18.8%, obviously a far higher amount. The exponential moving average weights the most recent data more heavily and is by far the most widely used moving average technique in Forex charting.
A comparison of three types of moving averages is presented in the figure below. The topmost red moving average on the left-hand side of the chart is simple. The next blue one is exponential. The bottom one is purple weighted.
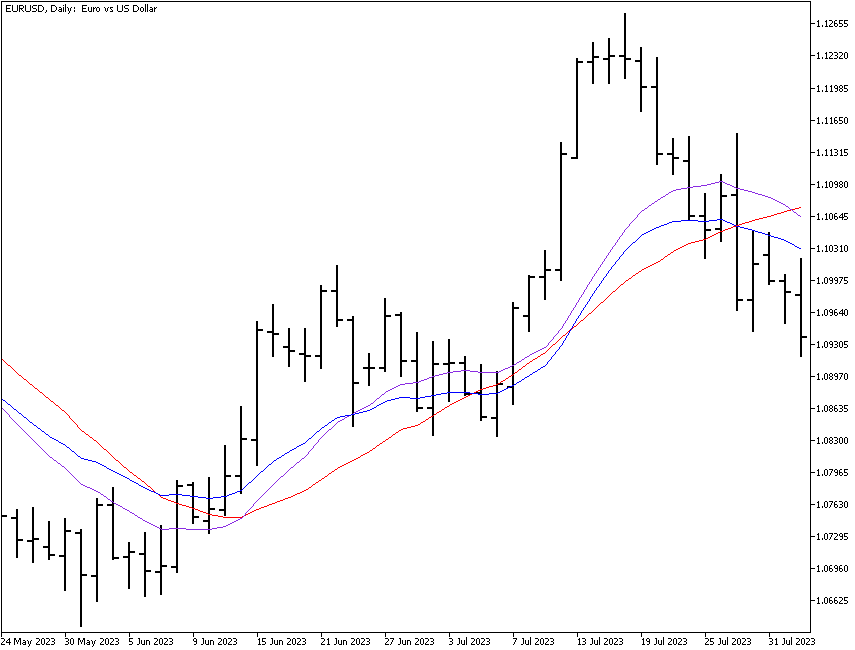
The most used numbers are 10 periods, 20 periods, 50 periods, and 100 periods. For daily chart work, the 200-day is usually added since it’s the magic “long-term” number and can be a powerful force when it is neared by current prices. Some analysts use the 100 and 200-period on all charts, even the hourly, although there is no evidence this adds any particular value. For example, no less an important name than Citigroup’s technical analysis team will sometimes name the 200-period moving average from the 4-hour charts. As in all matters pertaining to technical analysis, a metric is important and takes on market-moving capability if a sufficient number of traders buy into it.
Crossover Signals
An often-used technique is to consider the price crossing the moving average as a trading signal. For example, you place a 20-day moving average on your chart and buy when the price crosses above the 20-day average and sell when it crosses below the 20-day average. This is a tried-and-true basic trading rule. See the example chart showing the price crossing above the moving average with the accompanying arrow denoting “buy.” On the right-hand side of the chart, you see a crossover to the downside and an arrow pointing downward — the sell. If you had executed this exact trade, buying at the open on the day after the crossover and selling at the close on the day of the downside crossover, your gain would have been 195 points:
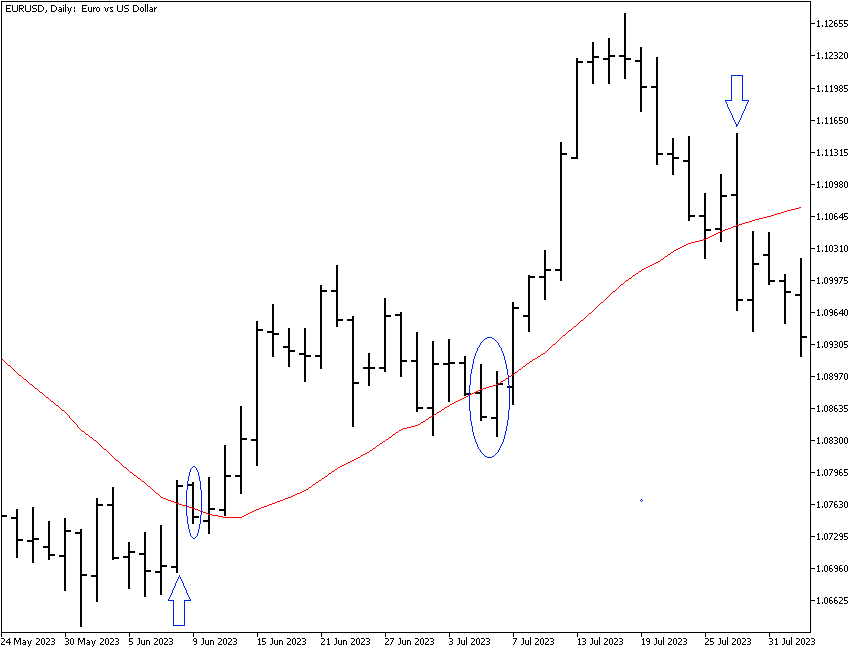
Buy at close 06/08/23 — 1.07814. Sell at close 07/27/23 — 1.09765. Difference: 195.1 points.
But right away, you can see the problem with this trading rule — sometimes, the price will violate the moving average for only a day or two, as shown in the circles. In this case, we ignored the one-day violation, but if you had obeyed the trading rule to the letter, you would have been whipsawed — exiting after only a day or two only to restore the original position. Whipsaws are very, very common in the price/moving average crossover trading rule. A possible solution is to require the price to reverse by more than a single day or by two or three. You can also add a safety cushion to the moving average, which ideally would be based on the historical record of the optimum number of points to add or subtract in order to avoid being whipsawed. Note that the optimum number of points for a false downside crossover is probably different from the optimum number of points for a false upside crossover due to trending bias, and the optimum number of points will change over time as the currency becomes more or less volatile.
Pro tip: If you are going to put moving averages on your charts, always use the same color for the 10-period, the 20-period, and so on. In no time at all, you will be subconsciously noting where the price is relative to these important moving averages.