While fundamental and technical analysis can make you a profitable Forex trader, there is no denying that these types of systems can get complicated fast. What if there were a way that you could trade without getting lost among a dozen indicators on your charts? Imagine making trading decisions based on the actual movement of price itself.
That is what price action is.
On a practical level, that means learning to identify key patterns which are formed by the candlesticks or bars on your charts. Once you become an expert at identifying well formed-patterns in context, you can get a feel for whether the market is consolidating or likely to break up or down.
In this guide, you will learn all the basics you need to know to get started with price action trading.
Let's get started by laying out some basic information about price action.
Price action basics
Price action is arguably the most bare-bones method of trading in existence. It has a long history of use, with many traders getting decades worth of results from it across a range of different markets (not just FX).
You can use price action to trade on any timeframe, but it is usually recommended that you start with daily charts. The reason is that more data has gone into forming the price bars at this level than on a smaller timeframe, which tends to make price action methods more reliable.
Something else which you should know about price action is that no indicators are required. In fact, some price action traders are “purists” in that they avoid using any indicators whatsoever. But lines of support and resistance can provide helpful context, and price action can be paired with technical indicators if you wish. Regardless of the approach that you end up taking, you should try to keep your charts as clean as possible.
Why trade price action?
Why consider price action trading rather than focusing your efforts on a fundamental or technical analysis system? Following are some reasons why price action is an excellent method, whether you are a complete newbie or a veteran Forex trader:
- Price action is direct. With price action, you are letting the movements of the currency pairs speak to you directly. You are essentially deriving your information directly from the source.
- Price action is simple. Fundamental and technical analysis can become convoluted fast. Technical analysis is sometimes inaccessible to a beginner, and even someone with a college degree in economics to have a challenging time with fundamental analysis. Price action distills trading down to its simplest form, removing all kinds of complexities and contradicting data from your path. This makes it outstanding for beginners and veterans alike.
- Price action is clean. With price action, you can say goodbye to charts covered with dozens of indicators. All that visual noise makes it hard to see what is going on, and it can be stressful to boot. Price action eliminates that noise and the stress and confusion which it can lead to.
- Price action is reliable and versatile. This is a trading method which has brought investors results for decades, and which can be useful for trading foreign exchange, commodities, stocks, and more.
Basically, it is difficult to think of any reasons not to consider price action trading. It is one of the most approachable and dependable methods in existence.
How to trade price action?
Here is how to trade price action in a few easy steps:
- Set up your charts using your preferred template.
- Watch your charts and look for a price pattern to form.
- If you see a well-formed price pattern, put it in context by considering support and resistance as well as the overall character of the market at this time.
- Optionally, if you have put moving averages or any other indicators on your charts, you can look for confluence to confirm your entry point.
As with any other trading method, you will need to come up with rules for how far out you set your entry point, and you will need exit rules as well.
Price action formations quick guide
So now you know the basic steps of trading price action. But what do price action formations look like? Let’s take a look at some common patterns and how to trade them.
Pinbars
The word pinbar is short for “Pinocchio bar.” You will understand why in a moment. This is a bar or candlestick where the open and close are close together, with the high or low protruding like a nose.
The reason that we call this formation a "Pinocchio bar” is because the nose is deceptive. If it is pointing upward, it means that price is likely to drop. If it is pointing downward, it means that price is likely to rise.
Ideally, you want to find a well-formed pinbar at an extreme, where it tells you that a reversal is about to take place.
So imagine the price has been rising for some time and is now at a swing high. If you spot a pinbar with the “nose” pointing up, that is an indication that the trend is now going to reverse and price is going to fall. It is time to go short.
It may be helpful to understand what has actually taken place when such a swing high pinbar forms. The bar opened, and then price rose, testing a line of resistance. That resistance was strong enough to push price all the way back down to close near where it opened. Because price tested that line and it held, it is unlikely to push past it, and will now move in the only direction it has to go, which is down.
You can encounter the reverse situation at a swing low. There, you may see a pinbar form with the “nose” pointing downward. In such a case, it is support which has been tested and which has held. That means that it is time to buy because price may be ready to rise.
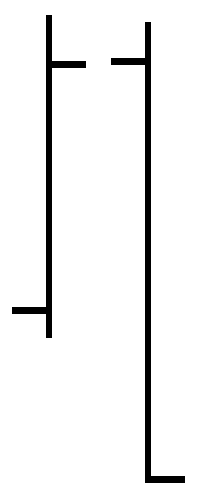
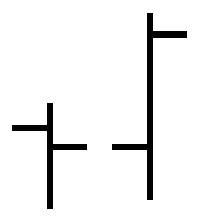
Outside bars
Another simple type of price pattern which is easy to spot is an outside bar. These may be either bullish outside bars (BUOBs) or bearish outside bars (BEOBs).
With an outside bar of either variety, you simply have a bar which is large enough that it contains the one which preceded it. If the previous bar is sticking out above or below it at all, you do not have a properly-formed outside bar.
Whereas pinbars tell you when a reversal is impending, bearish and bullish outside bars usually indicate that price is going to continue to move in the same direction.
So, if price is moving upward and you encounter a bullish outside bar, that means that it is time to buy, because there is strong upward movement.
If, on the other hand, price is moving downward and you encounter a bearish outside bar, that means that there is strong downward movement, and it is a good time to sell.
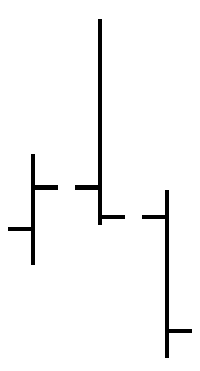
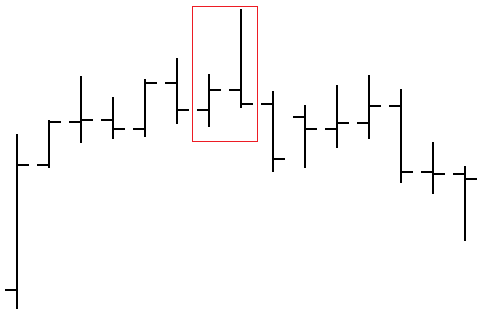
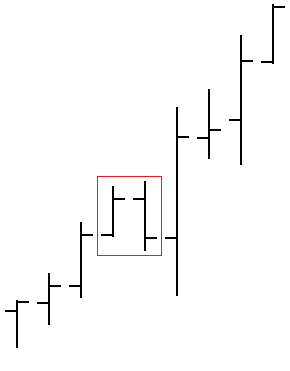
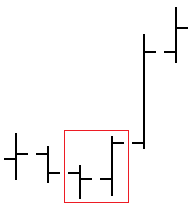
Inside bars
Now that you are familiar with the concept of outside bars, we can talk about inside bars. With an inside bar, the open, low, high and close of the bar do not extend beyond the previous bar.
Sometimes, you will see a string of inside bars forming, one after the next. When this is dramatic enough, the shape you get is triangular.
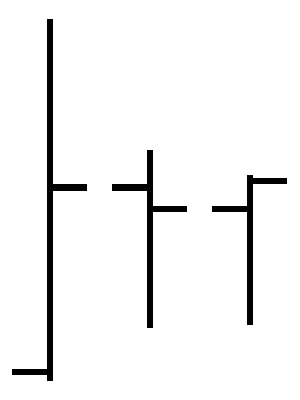
A set of inside bars forming in this fashion indicate that the market is consolidating. When this occurs, eventually, price is likely to break out in one direction or the other.
While any inside bar can be significant, these formations become more reliable with more bars.
For the formation to be formed in an ideal way, each bar needs to be entirely eclipsed by the one previous to it. None of the bars should protrude at all above or below the preceding ones.
Price action traders often look for four of these bars to form in a row. This formation is called an Inside 4 Bar, abbreviated I4B.
When you come across a well-formed I4B, the standard procedure is to place entries above and below the formation. That way, whether price breaks upward or downward, you will be able to get in on the trade.
DHLC and DLHC
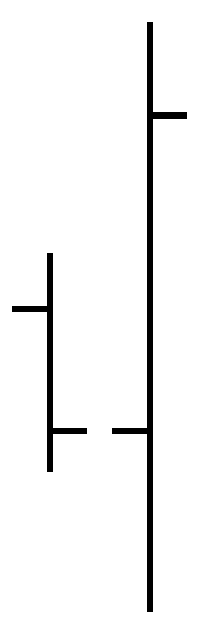
Next, let’s talk about DHLC and DLHC.
DHLC stands for “Double High Lower Close.” With this formation, you have two bars which form with the highs very close together. The second bar closes lower than the first.
When you see this pattern at a swing high, it signals a reversal, with price heading downward. The reason that the two highs formed close together is because there is too much resistance at that point for price to push higher. Indeed, during the second bar, it has been pushed aggressively lower, signaling the downturn.
The bullish version of this price pattern is “Double Low Higher Close,” abbreviated as DLHC. As you would expect, this formation consists of two bars with lows which are very close together and the second bar closing above the first.
In this situation, it is support which has been tested and which has held. This is why the two lows are close together. Price has been pushed back upward from the swing low, and is now climbing.
These are not the only example of price action patterns you can learn to identify, but they should be enough to get you started.
But wait! What about context?
You now know how to recognize some key price action formations. But does that mean that you are ready to trade them?
Many newbie price action traders learn the hard way that it is not enough simply to be able to spot a formation of bars and hit buy or sell. If bars are not formed in the most appropriate context, they may not signal what you think they do.
Learning how to identify favorable market conditions and spotting price patterns in the right context is perhaps the most challenging aspect of price action trading.
Here are some tips to help you with this aspect of price action:
- Avoid trading in markets where price is especially choppy and unpredictable. If you see a bunch of confusing whipsaws followed by a price pattern, it may not be the best time to leap in. What you think is a pinbar could just be another whipsaw.
- Learn how to recognize support and resistance. Try drawing lines at these pivot points to help you visualize where price may hesitate or turnaround.
- Consider applying moving averages or Fibonacci retracement levels to your charts. These visual aids also can help you to see where support and resistance are. Plus, moving averages can provide you with confluence to signal where a reversal may be unfolding. If you see a pinbar and a moving average crossover, for example, that is a stronger signal than if you simply saw one or the other.
Learning how to interpret context is very much an art form which takes time to develop. It is the stage where I suspect it is most common for novices to give up. But since going in, you are aware that this can present some roadblocks, you should be mentally prepared to work through them.
Price action has an established community
One more excellent thing about price action trading which is worth mentioning is that this isn't a journey where you need to go it alone. There are well-established communities of price action traders online. Among them are expert traders who have been posting their charts and sharing their methods for years, often for free and in public. It is smart to join one of these communities so that you have somewhere to post your own charts and ask questions of those with more experience. Your fellow traders can save you a good deal of time, confusion and stress by helping you to troubleshoot trades that have gone wrong unexpectedly. By keeping up with their charts, you can view examples of well-formed price patterns and solid context which can guide you in your efforts to learn to identify both. Eventually, when you have honed your own expertise, you can offer your wisdom back to the community and help out other traders who are just getting started.
General tips for price action trading
To conclude, here are some general advice for successful price action trading based on real-world experiences:
- Train yourself to recognize one pattern at a time. You may be tempted to jump right into your back testing with price action trading, but it is smart to do some study first. This should go beyond just reading about price action or looking at examples from other people. You should also look over historical charts on your own and search for as many examples as you can find of price action patterns which are well-formed. You can also note those which are not as well-formed and which perhaps did not signal price movements as reliably. Your goal isn't to learn just how to identify a pinbar or DHLC, but how to identify a great pinbar or DHLC.
- Don’t jump right into fast timeframes. If you want to trade on one-minute charts (M1) or five-minute (M5) charts, you can. But even experienced price action traders usually prefer longer timeframes. At the very least, you should learn on the longer time frames before progressing to shorter ones.
- Take only the best setups. You may have heard that the key to playing poker successfully is to fold and fold often. The same is true with successful Forex trading. When you see a price pattern, ask yourself if you are really holding a stellar hand. How well-formed are the bars? Are they in an ideal location? What are the market conditions looking like? Only play hands which have a strong chance of winning.
- Stick with major currency pairs. With the massive selection of currency pairs available for you to trade, you might be tempted to turn toward exotic pairs to search for more trading opportunities, especially if you feel frustrated by trading on a slower timeframe. The more exotic pairs tend to be choppier and more unpredictable with their movements, however. This means that they are more likely to function as a distraction than as a breeding ground for great opportunities.
- Confluence is helpful. If you find that it is difficult for you to establish context just by looking at price alone, or if you have a difficult time identifying the difference between a good setup and an excellent setup, looking for confluence either across timeframes or with the addition of moving averages can make it a lot easier to make trading decisions.
- Resist the urge to cover your charts with indicators anew. Even if you do decide to add some retracement levels or moving averages to your charts, try to talk yourself out of peppering your charts with half a dozen more indicators. All you will end up doing is complicating a method which functions through its simplicity. You also may end up with so many conflicting signals that you find yourself trapped in analysis paralysis more than find yourself trading.
- Beware of pullbacks which can stop you out prematurely. As with many other trading systems, one of the most frustrating things that can happen to you while trading price action is getting stopped out or faked out by a pullback. You can experiment with placing your trade entries at different distances to see if you can identify optimum defaults. An alternative is simply to await the initial possible pullback after a trade setup. If price pulls back and then continues in the direction you expected, you can get in on the trade.
- As always, have rules for exiting your trades as well. And remember, if the reason for a trade no longer exists (e.g., a new formation is giving you an opposing signal), it is generally best to get out.
- Pair your trading rules with a conservative and logical money management system. Without one, you can win the majority of your trades and still end up in the red. An easy and reliable money management system is to simply wager no more than 2% per trade.
- Backtest and demo test everything you try. Whatever experiments you run with price action trading, remember that you should never do it live with the possibility of losing real money. You should begin by backtesting with historical charts to see if the changes to the method are viable. Preferably, you should test one variable at a time, not multiple changes. If your backtesting results show promise, you can demo test with live data.
It cannot be emphasized enough that if you have questions along the way, there are plenty of resources available to help you for free, as well as fellow traders who would love to share their knowledge. Take advantage of both.
Conclusion
Price action is among the simplest and most effective trading methods. If you are in search of an alternative to fundamental or technical analysis, want to clean up your charts, and are motivated to learn a powerful strategy for Forex, it is hard to go wrong with price action.
Whether you have been trading for many years now or you have just discovered FX, you can pick up the basics of price action trading in an afternoon and get right to studying it in-depth.
With practice identifying patterns and context, this method can empower you to profit across a range of time frames as you invest in currency pairs and other assets. Good luck!