Stop-Loss Methods
Any stop-loss method, which is applied consistently, is better than not using any stop-loss at all, but once you acknowledge that you should use a stop, it is only sensible to use the best one you can devise. You can design your stop to be in sync with the market, or you can design it to fit your trading plan needs, but the best of all possible worlds is to find a stop that fits both. This can be very difficult and tricky and takes some soul-searching.
Market Sync Stops
The underlying philosophy of market sync stops is that the market should dictate your stop. You never know when you enter a position whether the upcoming period will be volatile or flat, contain breakouts, be trending, or deliver special circumstances (like a gap). The best stop to make the most of differing market conditions is the stop that adapts to the market conditions.
And the single most adaptive indicator we have in the toolkit is the average true range (ATR). The classic market sync stop-loss technique is to set the stop as a function of the ATR for the period you plan to hold the position. Let’s say you are buying at X, and you know the ATR for your expected holding period is 60 points. If you set your stop at X minus 61, it is unlikely that you will get stopped out on a large random price move. But since you will never enter at the exact low and exit at the exact high (or vice versa for a short position), you should probably subtract more than one point from the ATR from your entry to set a stop — perhaps 10 points for a total of 70. This gives you an additional cushion of 18% of ATR.
Setting your stop as a function of ATR is logical and dynamic. When the market is flaky and choppy, ATR goes up, and so your stop widens to prevent getting zapped by a random move. When the market is orderly, ATR drops, and your stop is smaller.
ATR has a few problems, though, and not the least of them is that 70 points can represent a very large move in your timeframe. And this has some serious repercussions for the Rule #1 of setting stops:
Rule #1: Your expected gain on any one trade should be a bigger number than your stop.
Since it is difficult to expect to make more than ATR on a trade, how can it make sense to set the stop at a bigger number? Ideally, the most risk-averse scheme would have the profit target a fraction of ATR and the stop a multiple of ATR, but that simply does not work because it violates Rule 1. Arithmetically, you need far more gains than losses in order for such a regime to work, and that violates common sense. It would be nice (but not essential) for the number of winning trades to be higher than the number of losing trades, but not always, and not with such a big disadvantage already built in.
Setting the stop as a multiple of ATR is a big disadvantage if you are a short-term trader. So, the solution is to set the stop at a fraction of the ATR, meaning you are leaving yourself at the risk of a random move. You have to accept that if you are going to use ATR to set stops.
Rule #2: The purpose of a stop is to limit losses, not eliminate them.
Setting stops at a fraction of ATR — and a smaller fraction than your target — is the only solution. Even though you know that you will get stopped unfairly sometimes. “Unfairly” meaning the price resumes your favored direction right after your stop and you are out in the cold with no position. The solution to unfair stops is to have a re-entry rule after a stop, not to have a stop so wide that you are all but eliminating the risk of getting stopped.
But the ATR stop runs into another problem, and that is the rest of the chart. Let’s say you have reduced your stop from the multiple (70 points) to a fraction (say two-thirds, or 40 points), but that stop lands beyond some critical chart event, like a support line. Since you would not be going long in the first place if you expected support to get broken, should you not modify the stop to adjust to the support line? The answer is yes, of course you should. But which chart events, exactly? And how do you resolve the conflict between ATR-set stops and chart-event stops?
Before trying to answer that question, consider some of the chart events.
Using Multiple Indicators
You can always just set a stop at the lowest low of the past three periods (or the highest high for a short position) or some other arbitrary limit. This actually works quite well in backtests, but we have less crude and simplistic tools.
The Parabolic SAR is the topmost indicator designed specifically to provide a stop. One refinement of the classic trailing stop parabolic SAR is named the “chandelier exit,” designed by Chuck LeBeau. This attaches the first calculation point to your entry, not to the market’s “extreme” high or low.
Many other indicators, like the moving average crossover and MACD, have a built-in stop. You can also use the Bollinger Band as a stop because, in Forex, penetration of one of the bands by 1-3 periods reliably forecasts the end of the current move.
You can use a plain old moving average as a stop, too. In the example chart below, stopping out at the price crossing the 20-period moving average was the right move.
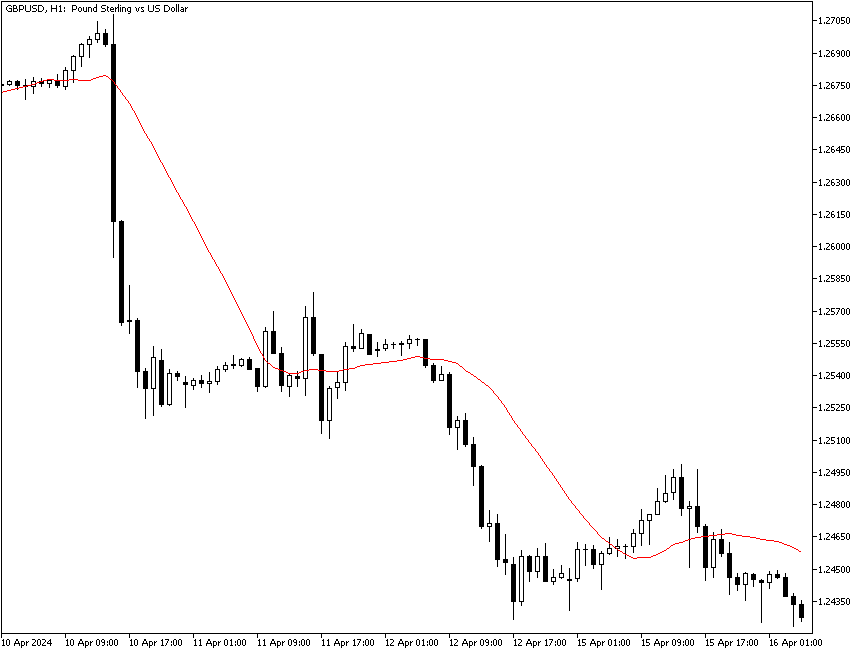
If you add the parabolic SAR to the same chart, you see the parabolic agrees with the crossover at the same period. Over on the right-hand side of the chart, the parabolic SAR is jittering back and forth with buy/sell signals, and the price bars are straddling the 20-period moving average, which is what all trend-following indicators do in a range-trading price series—generate whipsaws and become useless. These charts are of the 60-minute timeframe, by the way.
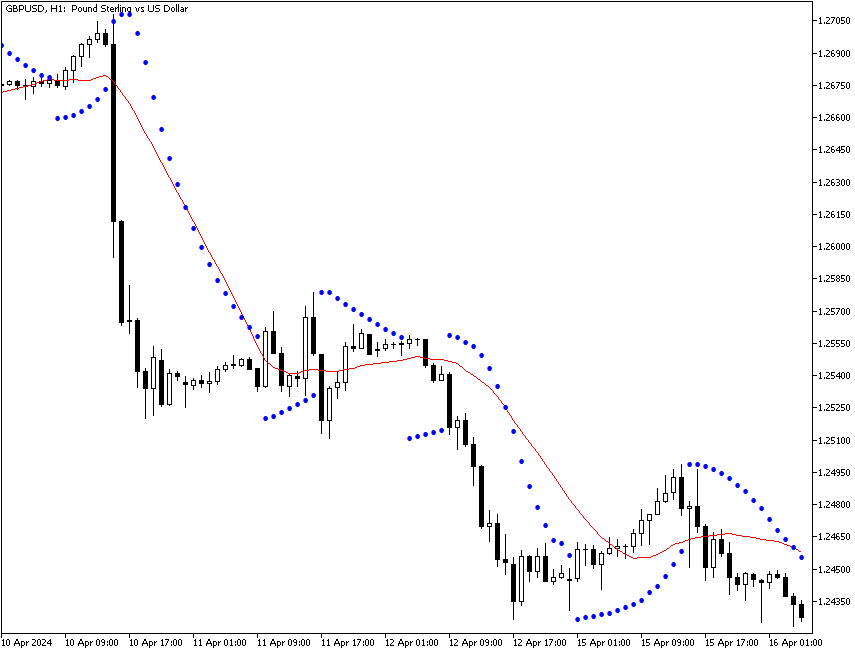
This points out two things:
- Getting confirmation from more than one indicator is always a good technique, especially if they have different arithmetic methodologies. If we add the stochastic oscillator to the parabolic SAR and the moving average crossover, we get the stop signal one day early.
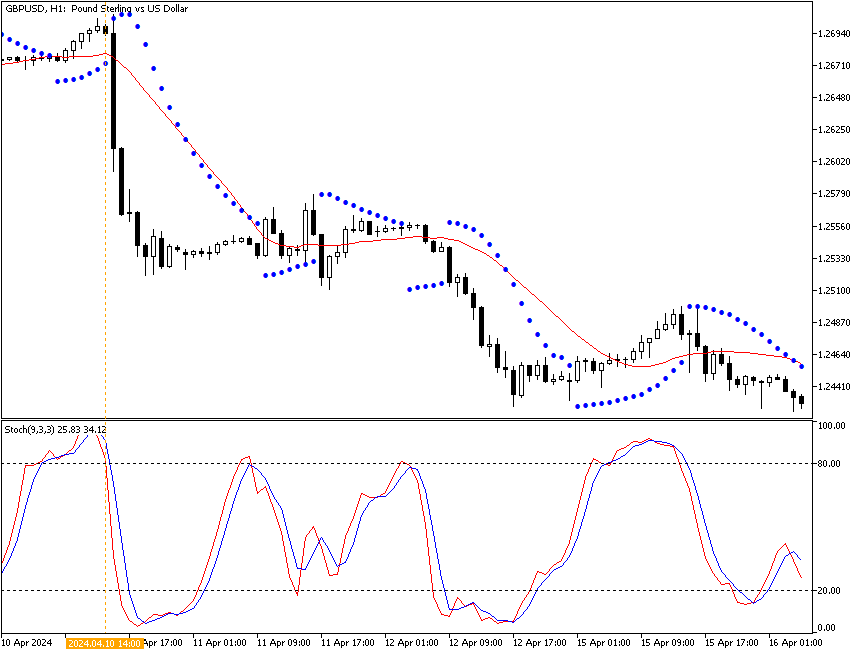
Getting a warning about stop-loss earlier with a stochastic oscillator - Setting stops in a trending market is relatively easy compared to setting them in a ranging market.
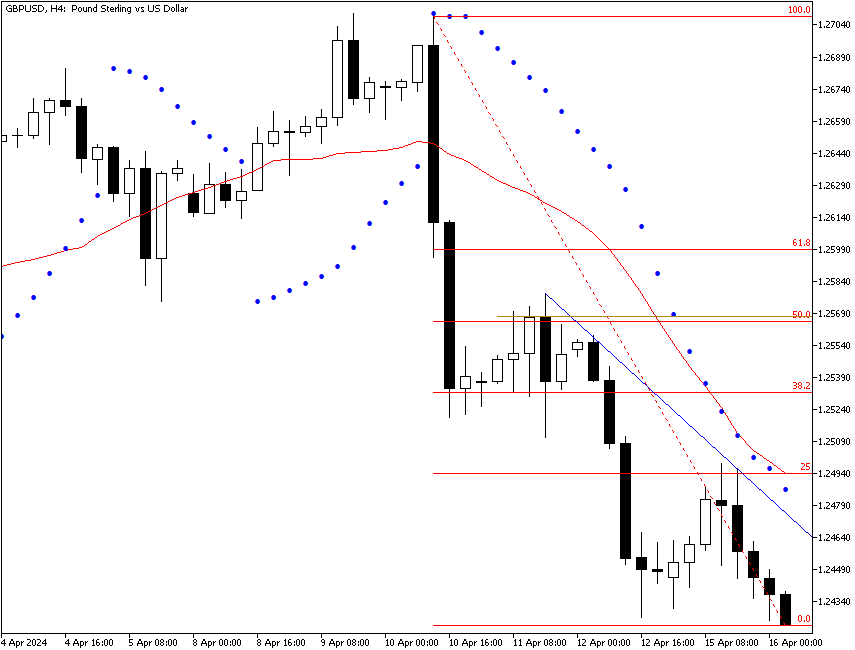
When you are trading in a narrow time window (like 1-4 hours), you can sometimes forget to look for perspective. Widening out the timeframe can be helpful, as in the next screenshot. This is the 240-minute (H4) version of the same chart. We can easily draw a resistance line connecting two prominent highs. Support and resistance can be used to set stops, although not necessarily in this instance. Here, the resistance line we care about is the horizontal gold line that bisects the bar that follows the breakout bar. We expect prices not to rise above the gold line, and indeed, so far, they have not.
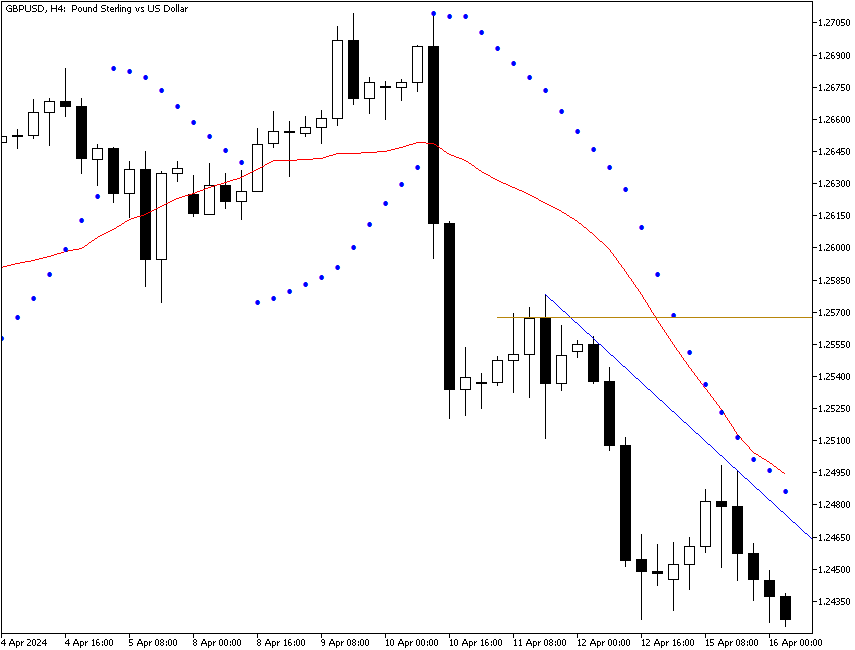
You can use the gold line as a secondary stop if you are stopping out a multi-lot position in tranches. In other words, let’s say you have 4 lots. You stop out one lot on the stochastic oscillator heading north. You stop out another two lots when the parabolic SAR and the moving average crossover occurs in the next period. But you hang on to your one remaining lot until the gold line is crossed.
Another useful indicator for perspective purposes is the Fibonacci retracement sequence. Whatever you may think of Fibonacci numbers, plenty of traders use them, and you are doing yourself a disservice not to consult the retracement sequence every chance you can. On the chart below, we see the 50% retracement is just below the gold breakout bar midline. You may want to modify the last-lot stop to give a little extra room just above both of them. A break of both would be a form of confirmation. It would be helpful to know what percentage of the time this currency breaks the 50% retracement line and/or the gold midline, but it is not essential — after all, the purpose of a stop is to limit losses, not to guess whether this is one of the 75% of the times the pullback does not exceed a 50% retracement.
Trading Plan Stops
The purpose of a stop-loss is to limit the loss on any one trade to a specific sum of money or percentage of capital. In other words,
Rule #3: The stop-loss should be related systematically to the amount of trading capital.
The stop should be relevant to your money situation and not just to market conditions. In the ATR fraction case above, we came up with a 40-point stop, or roughly $400. Let’s compare that to the amount of total capital. If the trader has $10,000, then a $400 loss is 4% of capital. The standard maximum percentage amount that is usually recommended is 2%, so a stop of 40 points is double the recommended amount. The only way to make 40 points boil down to 2% is to double the amount of capital — or, of course, to trade a smaller position size.
If the trader has only $1,000 in starting capital, a stop of 40 points is 40% of capital. After two losses in a row (which happens all the time), the low-capitalization trader is out of business. The $1,000 starting capital trader can have a stop of 20 points. But the market can move 20 points in 3 minutes. The stop will get hit 8 out of 10 times on randomness alone.
This is a very hard lesson to accept. Many traders refuse to face it, but the arithmetic carries with it the whiff of doom — set your stops to the market without regard for capital, and before you know it, you will not have enough capital left to trade. Of all the mistakes made by beginners, this is the most common and the most often fatal (after not using any stop at all).
The problem is that to trade Forex with a realistic expectation of making a gain and using a decent-sized stop of 2% of capital, you need more than $1,000 or even $10,000 in starting capital… or you need to trade the smallest contracts. Switching to the shortest possible timeframe also works as it reduces the average stop distance. That means you cannot be much of a trend follower since you have to be in and out in a short period of time. This is a pity because Forex can be highly trended, and that’s where the profit opportunity lies.
Having said that, there are some amelioration factors that you can apply. The first is to backtest various stops against scenarios that you see repeatedly. You may find that a 20-point stop works more than half of the time when your set of stop indicators kicks in. Or perhaps they work only 50% of the time, but adding a third or fourth indicator raises that to well over 50%. Always remember that back-testing has severe limitations — conditions may be similar, but they are never exactly the same.
A key variable in improving the functionality of a low stop-loss point count is to trade only when the price is trending. Statisticians have been tearing their hair out for decades trying to figure out how to define when trendedness ends, but in practice, a savvy and observant trader can detect when the change is coming, using bar-reading, candlestick patterns, momentum, and a dozen other techniques.
Solutions
Hunting for stop exhaustion is a strategy that some professionals use. In a pullback, as a price probes for the temporary bottom, or a bounce, when a price looks for a temporary top (as shown in the example charts above), there comes a tipping point moment when the next few bars will demonstrate whether the pullback or the bounce is over. Remember, entries are really the important number. If you can enter at the beginning of the resumption of a move, you have a good entry — and a built-in stop, which is the last lowest low. In the Fibonacci example above, the market has already told you that the price is not likely to bounce above the 50% retracement and the midline of the bar that follows the breakout bar. If it then goes down, you can assume that unless fresh positive news comes out, everybody and his brother will place his stop where it was the last time. If you get back into the long trade in this currency, the stop distance is almost certainly a lot smaller than the 40 points in the ATR-based stop regime. In fact, with any luck, it will line up more with the 2% maximum risk per trade recommended, even on a bigger position size.
Some analysts say stop hunting occurs more often at round numbers or some other magic formula. While it is true that Forex prices close at round numbers more often than chance would allow (research by no less august a body than the US Federal Reserve), we cannot verify that round numbers are reversal points more often than chance would allow. If you think about it for a minute, since we count reversals from the last lowest close, it is probably true that reversal points tend to be round numbers, but from that, you cannot deduce that any old round number close will likely be a reversal tipping point.
The important point is that you are looking for something on the chart to modify your stop to a level that is both adaptive to market conditions and consistent with your trading plan, the first feature of which is staying in business by not losing too much of your capital.
The other big solution is trailing stops. A trailing stop is one that you make progressively tighter to the current price as the price moves in the direction that is profitable for your position. The parabolic SAR is a classic trailing stop.
Say, your initial stop is 40 points, but now the price has moved up 20 points, so to protect that gain, you raise your stop closer to the new price, say 30 points. Now, it moves up another 20 points, and you cut your stop again to 20 points. You have made 40 points from your starting position, and now the win/loss ratio is 2:1, which is exactly where you want it to be. If you are lucky and have latched on to a big move, you may be able to move the stop up to the breakeven level (i.e., your entry) and after that, if the move keeps going, to protect a net gain.
Trailing stops are recommended by just about every commentator, probably because trailing stops are sensible. Nobody seems to notice that the majority of Forex traders have such a short holding period that a trailing stop is simply not feasible. You would be adjusting your stop every minute or so over a 15-minute or one-hour holding period and miss most of the price action in the process. Trailing stops on a short-term timeframe take concentration and can be nerve-wracking. Luckily, modern trading software allows automated trailing stops, reducing the amount of work required from traders. All the same, a trailing stop is the ideal solution to your initial stop being arbitrary and unrelated to market action.