If you are in search of a way to identify when an asset is overbought or oversold, you could try using the envelopes indicator.
In this guide, we will cover what envelopes are, how to plot them on your charts, and how you can use them as part of your trading strategies.
What is the envelopes indicator?
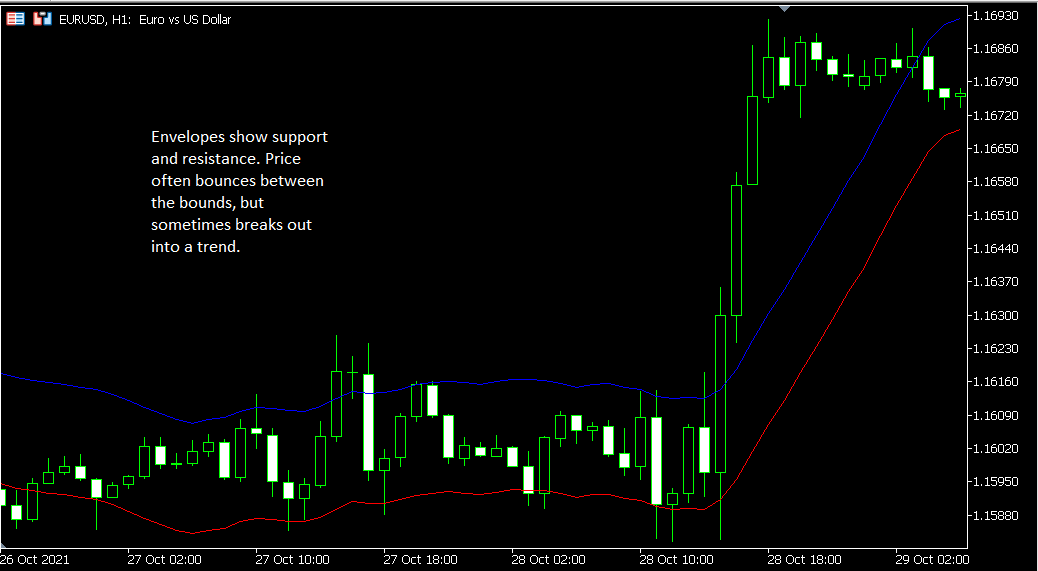
The envelopes indicator is a set of moving averages. When you plot them, you will notice that price often ranges between the two of them, but sometimes breaks above and below.
Key point: A pair of moving averages forms the envelopes indicator.
How is the envelopes indicator calculated?
When you plot envelopes on your chart, you will need to choose:
- The type of moving average you want to use
- The period for each moving average
- The percent for the envelope
What is the purpose of the percent? It has to do with sensitivity. If you are worried about fakeouts in volatile conditions, you should choose a higher percent. If, on the other hand, the market is not volatile and you are worried about not finding enough trade entries, a lower percent may be appropriate.
Here is an example of the calculations for an envelope. This one uses simple moving averages, a 10-day period, and 1%.
- Upper Envelope: 10-day SMA + (10-day SMA × 0.01)
- Lower Envelope: 10-day SMA - (10-day SMA × 0.01)
Maybe you want to change the percent to 5%, but keep everything else the same. Then you would use:
- Upper Envelope: 10-day SMA + (10-day SMA × 0.05)
- Lower Envelope: 10-day SMA - (10-day SMA × 0.05)
Perhaps you want to go with a 20-day SMA instead with 5%. Then you would use:
- Upper Envelope: 20-day SMA + (20-day SMA × 0.05)
- Lower Envelope: 20-day SMA - (20-day SMA × 0.05)
When you add the envelopes indicator to your chart, you put in the inputs you want, and the charting platform takes care of the math.
Also, note that some envelopes indicators seem to plot with a mid-point SMA, displaying three lines. Others seem to plot without the mid-point SMA, displaying two lines.
Key point: Although the computations for the envelopes indicator are relatively easy to understand, your charting platform it should take care of them for you once you select your inputs.
What does the envelopes indicator show us?
The pair of moving averages that comprises the envelope indicator shows us when conditions are overbought or oversold.
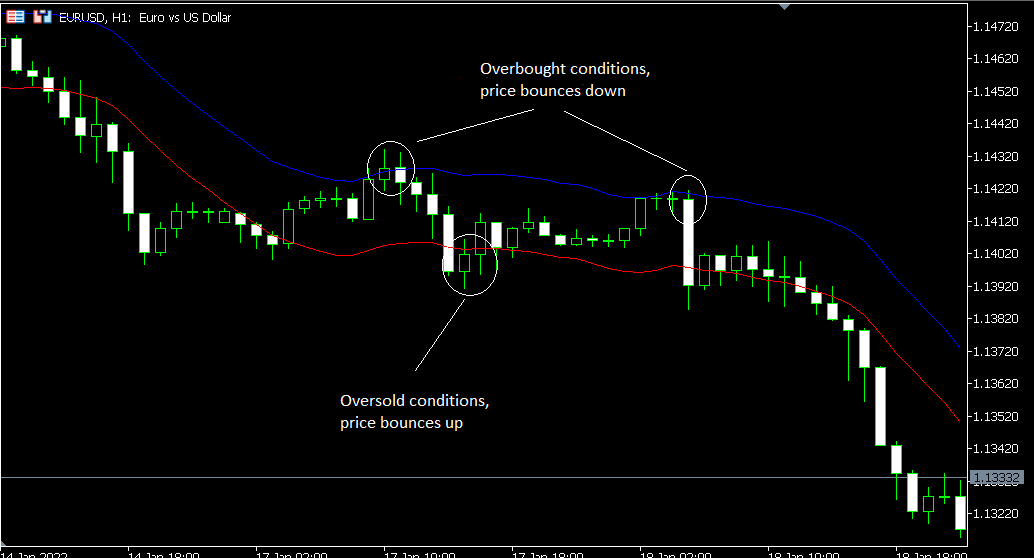
When you see the price of an asset pass the lower bound of the envelope, that suggests that the market is oversold, and that you should buy. The lower bound is showing you an area of support.
If, on the other hand, you see price pass the upper bound of the envelope, that suggests that conditions are overbought, and you should sell. The upper bound is showing you an area of resistance.
Something else you will notice about envelopes is that they can help you visualize trending and ranging markets.
When price is trending upward or downward, the moving averages comprising the envelopes will be doing the same thing.
When price is ranging sideways, you will likewise see the envelopes moving more or less sideways as well rather than strongly upward or downward.
Key point: By plotting envelopes on your chart, you can detect when an asset may be overbought or oversold. You also can visualize trending and ranging markets.
How to plot the envelopes indicator on your charts?
It is easy to plot envelopes. Here are the steps if you are using MetaTrader 4:
- In the menus, go to Insert, then Indicators, then Trend, and then Envelopes.
- You can now input your parameters. Once you are done, click on OK.
- The indicator will now be displayed on your chart. You are ready to look for trade setups.
Key point: It takes just minutes to add envelopes to your Forex charts
How to use the envelopes indicator while you trade?
You may see some confusing and seemingly contradictory instructions on how to use the envelopes indicator while you are trading. This is because context determines a lot about how you should interpret crosses above and below the boundaries of the envelope.
Because the two bounds represent potential overbought and oversold conditions, usually, you will use the envelopes indicator like this:
- If price closes below the bottom bound, you will buy.
- If price closes above the upper bound, you will sell.
But there are exceptions when a new longer-term trend is forming.
Think about the way support and resistance behave in general. Usually, price bounces off of them, and they act as containment. But in some situations, when support or resistance are broken, price will continue to push onwards in a strong trend.
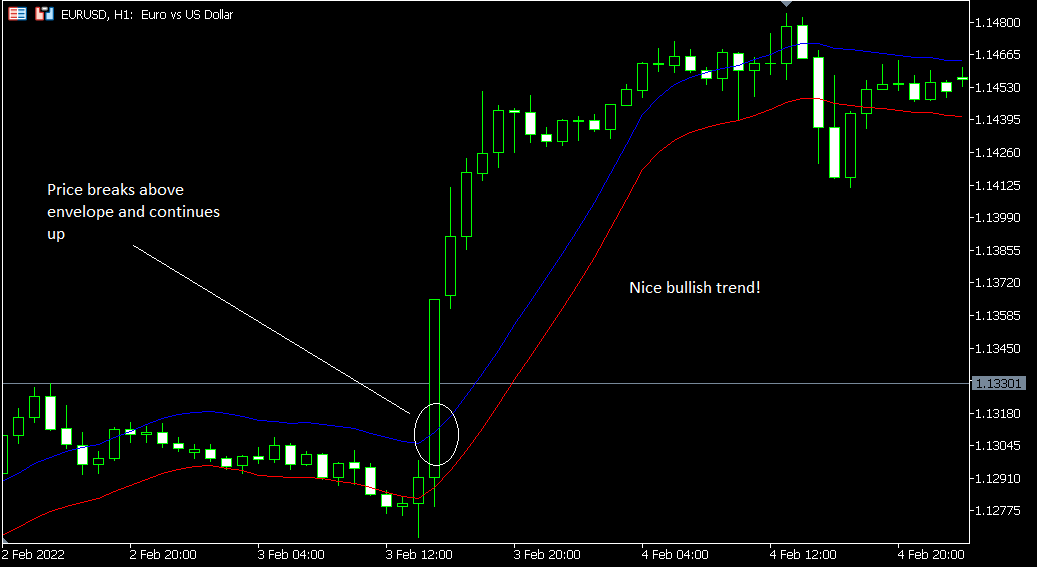
That applies when we are talking about envelopes as well. If you notice that price has broken one of the lines and does not appear to be bouncing back, it could mean that a trend is forming in that direction.
In such a situation, you would instead trade like this:
- If price closes below the bottom bound and seems to have truly broken support, you could sell, as there could be a downtrend beginning.
- If price closes above the upper bound and seems to have truly broken resistance, you could buy, as an uptrend could be forming.
You can see how this could get to be confusing. We will talk a bit more about this in the section below.
Key point: Since the bounds of envelopes act as support and resistance, typically, we would take long positions when we see price closing below the bottom line, and short positions when we see price closing above the upper line. But in cases where support or resistance appears to have been truly broken by a strong trend up or down, we might trade instead in the direction of the trend.
General tips for using the envelopes indicator
- You will need a rule to help you figure out how to use envelopes. If price closes above the upper line, for example, will you go short, assuming it is overbought, or will you go long, assuming resistance is broken and a trend is forming upward? You might make your decision based on how long price lingers above the line, or whether it passes back under it again. Test out different entry rules to find out what works most consistently.
- Consider adding other indicators or using price action. Something else that may make the trade signals you get from envelopes less ambiguous is the presence of other indicators on your chart to provide confluence. You could also find confluence by looking for price patterns that signal a trade entry.
- Pay attention to the overall context of the market. How volatile are conditions for this asset? Are there a lot of whipsaws? Remember, you can adjust the percent used for the calculations for the envelopes to help you avoid getting faked out.
- Backtest and demo test. When you are adding any new indicators to your charts, it is critical to conduct extensive testing before you start risking real money on your trade setups. That goes for envelopes just as it would for any other Forex indicators.
Key point: Context, rules, and testing are essential to make good use of envelopes.
Conclusion
The envelopes indicator can help you identify overbought and oversold markets and to spot trends. Now you have a tool you can use to figure out when an asset may be overbought or oversold. As a bonus, it can also help you detect the formation of long and short trends that break outside of the levels of support and resistance it identifies. Use envelopes as part of a tested trading method to get the best results.
If you have any questions about the Envelopes indicator or if you just want to discuss its use in trading with others, you can proceed to our Forex forum.