For oscillators that can generate buy and sell signals, consider adding Bulls Power and Bears Power indicators to your Forex charts.
While these are two different indicators, they work the same way, and usually are used in tandem.
What are the Bulls Power and Bear Power indicators?
These indicators are the work of Alexander Elder, and are described quite well by their names. The Bulls Power indicator is telling you how strong the bulls are (the buyers). The Bears Power indicator is telling you how strong the bears are (the sellers).
Sometimes, they are also referred to as "Elder Ray indicators." Elder himself apparently coined this name, and was inspired by the idea of a "X-ray" for the markets.
Key point:
You can visualize the strength of buyers and sellers in the market by plotting the Bull and Bear Power indicators.
How are the Bulls Power and Bear Power indicators calculated?
The calculations for the Bulls Power indicator and the Bears Power indicator are pretty straightforward.


While one might hypothetically use any exponential moving average, most commonly, one uses the 13-day EMA, as suggested by Elder when he came up with these indicators.
As always, you do not need to concern yourself with running these calculations manually since your trading platform will take care of it for you.
Key point:
The Bulls Power indicator and Bears Power indicator are both calculated using a simple formula comparing the EMA with the high or low respectively.
What do the Bulls Power and Bears Power indicators show us?
What we are looking at with the Bulls Power and Bears Power indicators is the distance between the EMA and the high/low. This corresponds with the influence of the bulls/bears to continue to push price past the EMA.
You will notice on your charts that the Bulls and Bears Power indicators can both display negative or positive values.
Note that positive values in the Bulls Power indicator indicate bullish strength, while negative values in the Bears Power indicator indicate bearish strength.
Key point:
Bulls and Bears Power indicators help us visualize the strength of buyers and sellers respectively.
How to plot the Bulls Power and Bear Power indicators on your charts?
Here are the steps to plot the Bulls Power indicator and Bears Power indicator on your MT4 Forex charts.
- First, you need to plot the moving average on your chart since you need to look at it while planning trades. Click on Insert, then Indicators, then Trend, then Moving Average. In the Method dropdown, click on Exponential. Then set the period to 13. Apply to Close. Choose whatever color you like, and add the EMA to your chart by clicking OK.
- Add the Bulls Power indicator to your chart. To do this, click on Insert, Indicators, Oscillators, then Bulls Power. We recommend that you change the color of the Bulls indicator to green in order to make it readily visually identifiable.
- Add the Bears Power indicator to your chart. To do this, click on Insert, Indicators, Oscillators, then Bears Power. We recommend that you change the color of the Bears indicator to red in order to make it stand out from the Bulls indicator.
That's all there is to it. You are now ready to look for setups using the Bulls Power indicator and the Bears Power indicator.
Key point:
You can add the bulls and Bears Power indicators to your charts in MT4 in a few quick steps.
How to use the Bulls Power and Bear Power indicators while you trade?
Elder not only created this set of indicators, but he also proposed a method for trading with them. Here are his rules for buying and selling.
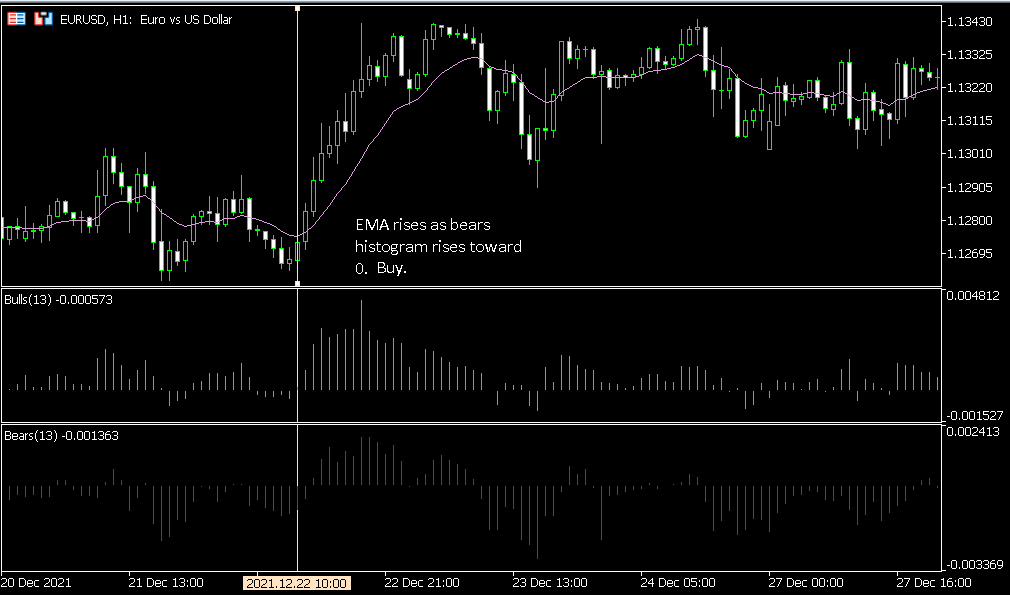
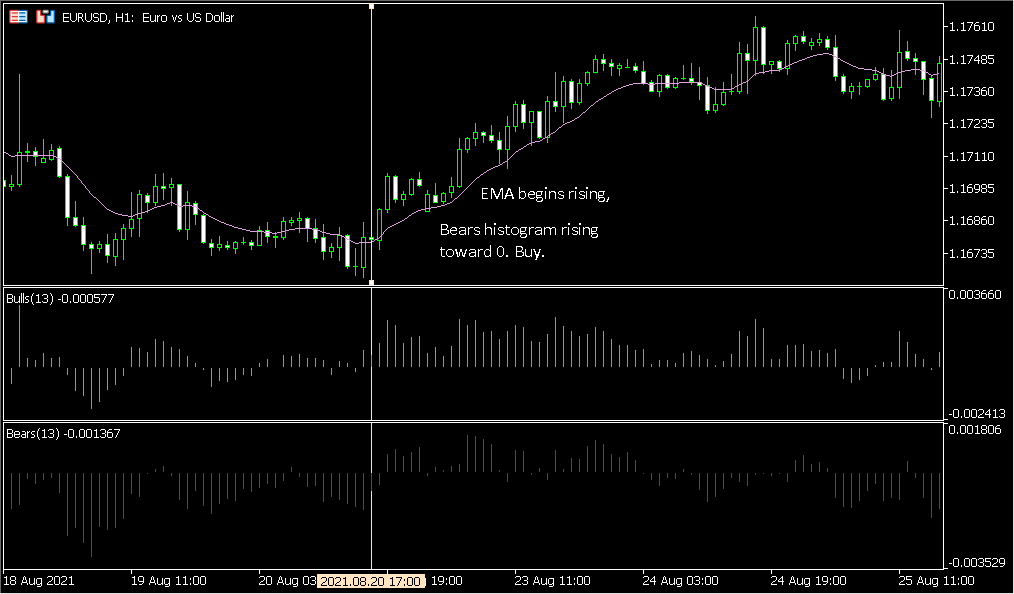
Buy when:
- The EMA is rising.
- Bears Power is negative but moving closer to 0.
While those are the only two required conditions, the following conditions suggest an even more ideal setup:
- The more recent histogram peak for Bulls Power is higher than the one before.
- There is bullish divergence between the Bears Power histogram and price.
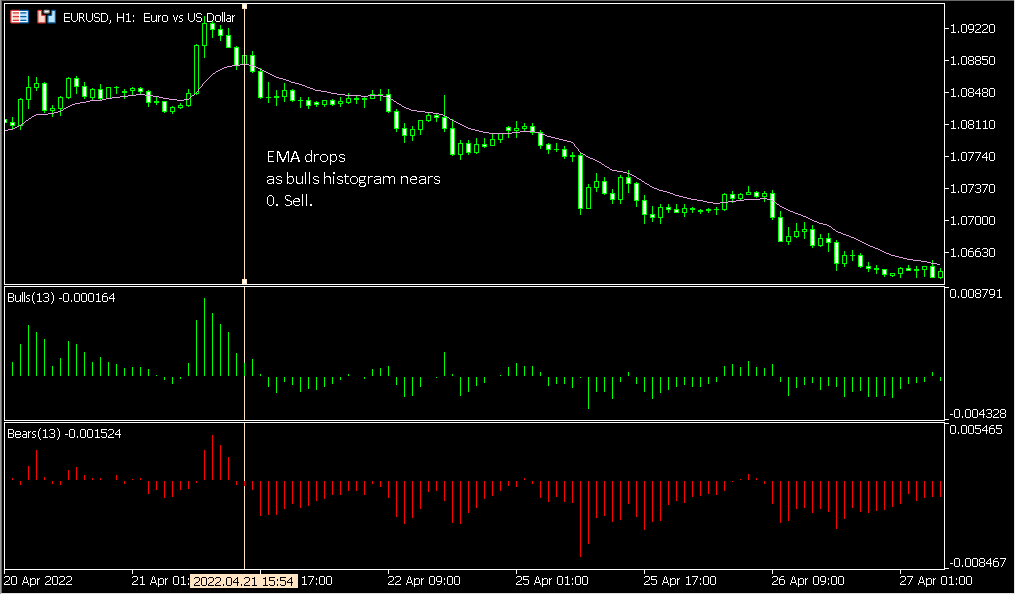
Sell when:
- The EMA is falling.
- Bulls Power is positive but moving toward 0.
These optional criteria make for an even better setup:
- The most recent histogram low for Bears Power is lower than the one proceeding.
- There is bearish divergence between the Bulls Power histogram and price.
Key point:
Elder's method for trading using the bulls and Bears Power indicators requires that you plot the EMA on your chart and that you meet two required criteria for entry. There are two optional criteria as well for even stronger setups.
General tips for using the Bulls Power and Bear Power indicators
- Use all system components together. Elder created the bulls and Bears Power indicators to be used together along with the 13-day EMA. They were not intended to function as standalone individual indicators.
- Test before going live. Before you use this system to trade with real money, make sure you backtest and demo test. Once you know you have the potential to be profitable, you can risk real money.
- Modify the system if you want, but again, test. You do not necessarily need to use Elder's system exactly as he engineered it. But if you are going to make any changes, do not forget to test them first.
Key point:
However you choose to use the bulls and Bears Power indicators in your trading, always check if you are profitable in demo before going live.
Conclusion: The Bulls Power and Bear Power Indicators
Now you know how you can use the Bulls Power indicator, Bears Power indicator, and 13-day EMA together to generate buy and sell setups for Forex trading. While Elder's method may seem complex at first, it is relatively straightforward once you see it in action.