Divergence Trading
The concept of divergence as a guide in trading has been around for many decades and was popularized by Gerald Appel, inventor of the moving average convergence-divergence indicator (MACD). In recent years, divergence trading has become increasingly talked about as a stand-alone or near-stand-alone technique.
Note that in Forex, we are speaking of price values diverging from price momentum, not the price diverging from volume, the price of one currency diverging from another currency, or the price diverging from the price of a different asset. All three can be named “divergence trading.” In equities, the divergence of volume from price is a hugely valuable tool. When the price is making a new high but on low or falling volume, the rally is weak. Alas, we do not have reliable volume statistics in spot Forex.
In classic divergence trading, the core idea is that momentum leads price. When momentum reverses direction, we expect prices to follow. If prices are rising but momentum starts falling, we have a bearish divergence. A bullish divergence occurs when prices are falling but momentum starts rising. The bigger the divergence, the more likely the price is to follow momentum. The longer the divergence lasts, the bigger the price reversal in the end: a divergence over a few hours can mean nothing, but a divergence over several days or weeks will be more reliable. If you are entering a new position based on momentum contrary to the price direction, you are taking a lot of risk, and the shorter the timeframe, the bigger the risk.
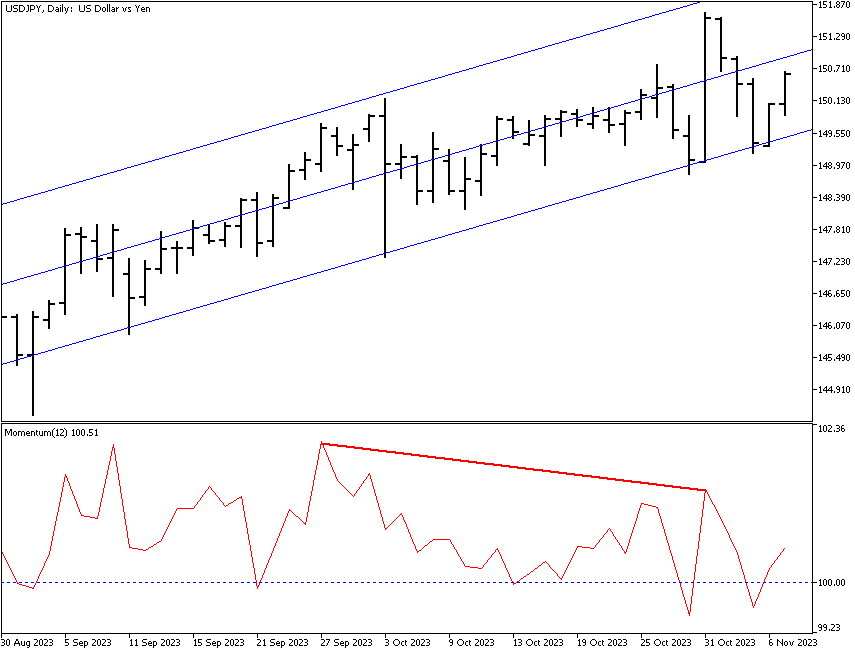
See the USD/JPY chart on a daily basis. The blue price line is a linear regression line, while the red line in the bottom window simply connects momentum highs. This is a simple depiction of a price-momentum divergence that serves to remind you that the up move will be ending. You can use any of a number of indicators when seeking divergence, including MACD, RSI, and the stochastic oscillator. The most commonly seen indicator in Forex is the stochastic oscillator, probably because it works better on shorter timeframes than MACD.
Did you know? According to one of our trader polls with almost 1,000 participants, the Relative Strength Index (RSI) was named as the best indicator for divergence trading.
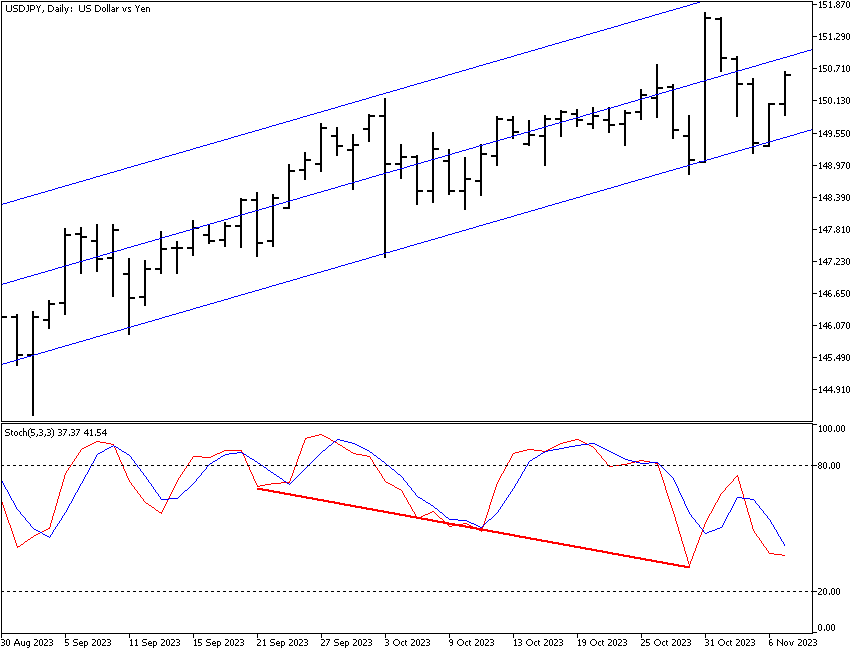
See the next chart for an example. Note that the stochastic exaggerates the “waves” of action/reaction embedded in every trend. It is up to you whether you want to see a Fibonacci sequence in these waves. Remember that the stochastic oscillator will show a currency to be vastly overbought or oversold while it is trending strongly over a long period. During a long-lasting trend, a direction reversal in the stochastic is extremely unreliable.
The next figure introduces a new factor — the slope of the lines connecting a series of highs or lows. You can estimate the slope of a move by drawing a line connecting highs and lows, as shown on the chart below, or using linear regression lines, as shown in the figures above. It does not really matter which type of line you employ because what you are seeking is a strong slope that is paired with a slope going in the opposite direction with less momentum. Below, the left-hand set has a stochastic that is horizontal and a price sloping upward, whereas the right-hand divergence is approximately the same number of degrees. What does this mean? It means that you initially did not have any divergence and had to look elsewhere for direction. Since by now, it started to look like the last high may turn out to be a blow-out high, and the price direction may turn downward or at least sideways, you expect the slope of the indicator to confirm the new downward direction, which it proceeds to do.
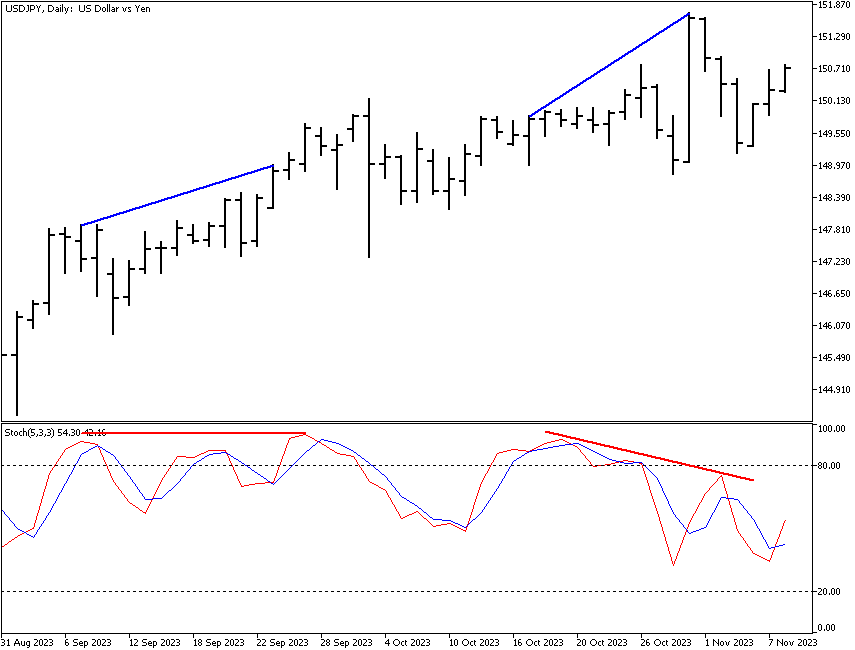
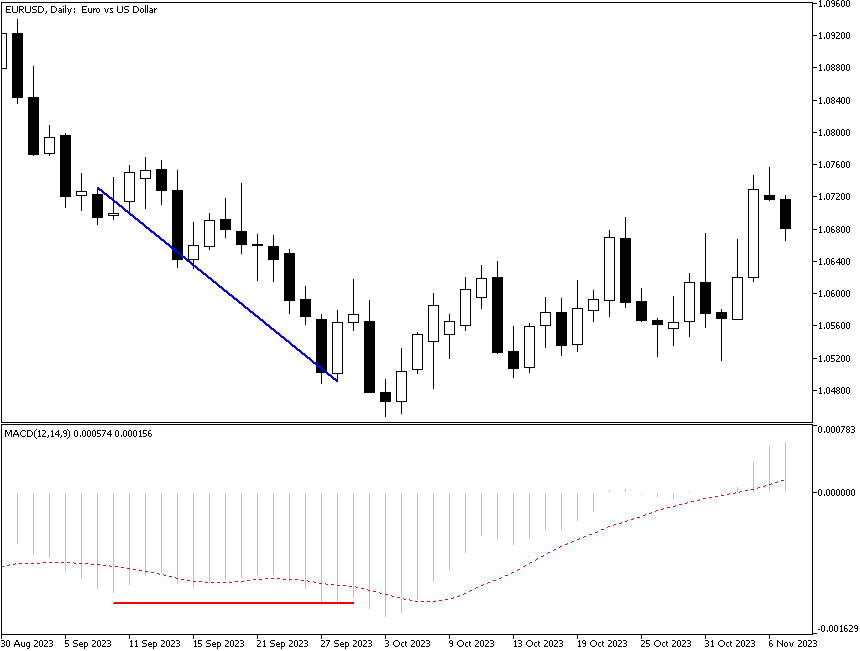
In fact, the horizontal slope of the indicator line means that momentum has returned to zero. Since momentum is a leading indicator, this is good news, if sometimes ambiguous. See the EUR/USD daily chart below. The price was falling, logging a series of mostly lower highs, while the MACD was flat. Flat vs. falling highs are still a form of divergence since the meaning of the flat MACD is that momentum has stopped falling. It is not rising, but if you are a risk-taker, this might not be a bad place to enter long. And indeed, the MACD started to rise, and the rise coincided with the price starting to log higher highs.
Some analysts want to see three hits of a high in price combined with three hits of a low in the indicator, or vice versa, which is called the “1-2-3 Divergence Trade.” Some analysts go overboard and speak of multiple types of divergences, including “hidden” divergences and other fancy-sounding folderols. These are all just invented names applied to the core concept of price and momentum going in opposite directions. Do not be intimidated.
Nevertheless, do be afraid of entering divergence trades without confirmation from other indicators or from fundamentals.