When you add a moving average (or nearly any other indicator) to a chart, you can usually set the base price type to apply it to. That choice is most often left unchanged from its default — the Close price. However, changing it might be worthwhile in various applications. For an FX trader interested in technical analysis, it is advantageous to learn what base price types are available and what implications they bear.
Close price the staple of price type for indicators and even some chart types (e.g., line chart). Yet it is often nothing more than a conventional price data point with little fundamental value to currency trading — even daily closes are pretty meaningless in the 24 hour a day market.
Open price is rarely different from the previous Close in Forex. Still, it can be used in those cases when you don't want the indicator value at the latest candlestick to change with each tick. Once the candle has appeared, its Open level doesn't change.
High price can be relied on in applications that aim to detect resistance levels and for easy spotting of divergences.
Low price, when used as the source for an indicator, will give a picture based on the minimum rates seen during each period. This can be useful if you are trying to detect support levels or to smooth lower lows (for example, for divergence analysis).
Median price is the mean average between the High and Low rates:  . It is a sort of a middle ground between the highest and the lowest exchange rates demonstrated during formation of one candlestick or one bar.
Typical price is calculated as  and gives equal weight to all three price data points while omitting the Open level completely. This is done because the previous Close would more often than not lie very close to the current Open, giving undue weight to that level.
Weighted price, which calculates as  , does exactly what Typical price is avoiding — it assigns additional weight to Close. It is worthwhile to mention that in Forex, only weekly Close levels are that meaningful that they would warrant assigning extra importance.
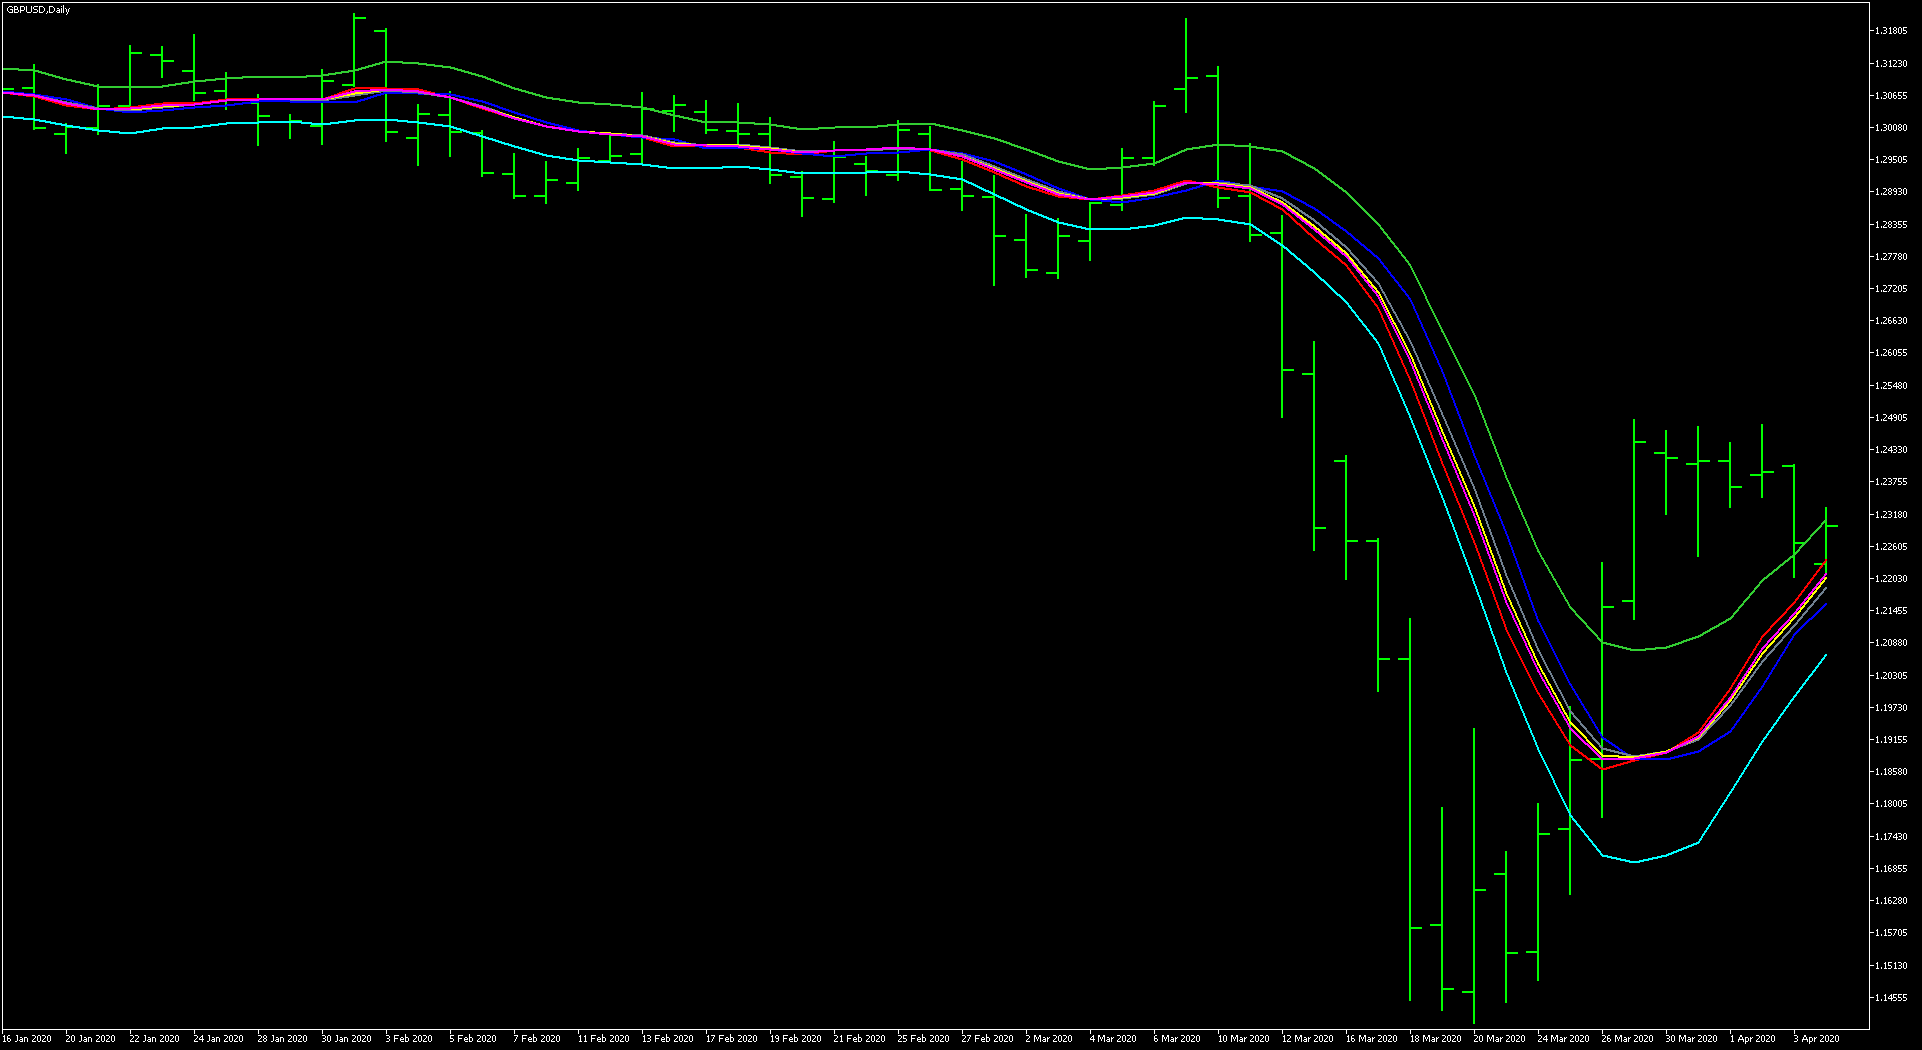
The chart screenshot below illustrates the potential differences between the seven base price types listed above. All lines are simple moving averages applied to different base prices. The red one is Close, the blue one is Open, the green one is High, the cyan one is Low, the gray one is Median, the yellow one is Typical, and the magenta one is Weighted:
It is also possible to use outputs of other indicators as the inputs for your indicators. For example, it is possible to apply TA indicators to all sorts of exotic chart types that way —
Conservative traders use Close as the base price for all indicators and expert advisors. However, it is possible that High and Low are both better representing the actual price action — after all, a Close is just some random data point chosen only due to its position in time, while High and Low demonstrate important maximum and minimum levels during the entire period. Perhaps, we should give more weight to what two MA's (applied to High and to Low) tell us than to what one MA applied to Close says?
If you have any questions about the price type that can be used for indicator calculations and chart drawing, please submit them on our Forex forum.