Warning!
The latest backtest of this expert advisor on the period from 2013-01-01 through 2022-04-14 has shown a complete account wipeout.
Do not run this EA on a live account! Use it for educational purpose only. The backtest results presented below are outdated.
Introduction
Ichimoku Chikou Cross is a MetaTrader expert advisor based on standard Ichimoku Kinko Hyo indicator with default settings. Specifically, it uses the cross of Chikou span with price to generate trading signals. The signals are confirmed by the relative position of current price and Kumo. Additional confirmation comes from relative position of latest Chikou span level and Kumo at that time. The expert advisor does not use any stop-loss or take-profit levels but exits all trades on reverse signals that, in contrast to entry signals, do not require any confirmation. Optional ATR-based position sizing is available for improved money management.
Ichimoku Kinko Hyo
Ichimoku Kinko Hyo (Ichimoku Kinkō Hyō, often simply Ichimoku) is a technical indicator released by a Japanese journalist back in 1960's. It is used as a one-glance method to assess the current situation with the price chart. It consists of five main elements: Tenkan-sen (basically, a fast moving average based on High-Low difference rather than traditional Close levels), Kijun-sen (slow moving average), Senkou Span A (average of Tenkan-sen and Kijun-sen plotted with some shift in the future), Senkou Span B (average of maximum and minimum price for the given period plotted with the same shift in the future), Chikou span (price Close level plotted with the same shift but in the past). Senkou Span A and B together form what is known as Kumo cloud.
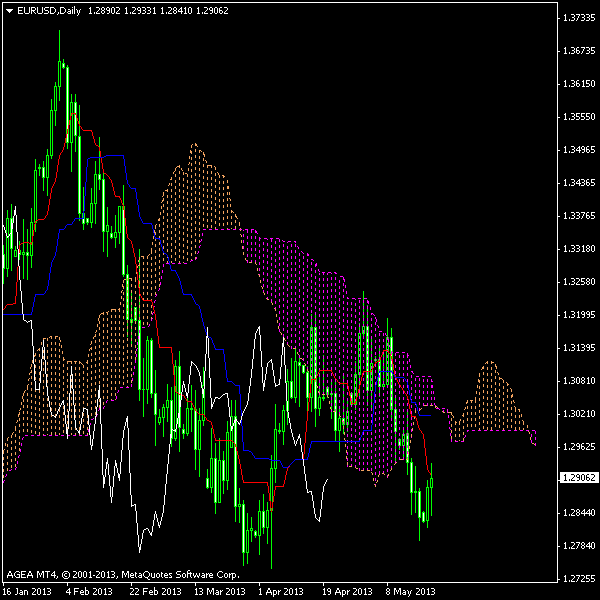
The chart below shows the complete Ichimoku Kinko Hyo setup. The red line is the Tenkan-sen, the blue line is the Kijun-sen, the brown line is the Senkou Span A, and the magenta line is the Senkou Span B. The Kumo cloud is colored brown when Senkou Span A is above Senkou Span B, and it is colored magenta when Senkou Span A is below B. The white line is the Chikou span.
There is a number of ways to use Ichimoku Kinko Hyo in trading — from Tenkan/Kijun crosses, to Kumo crosses, to crosses of price with any of the Ichimoku's five components.
Trading Strategy
Ichimoku Chikou Cross expert advisor uses a less popular but seemingly effective trading strategy — buy whenever the Chikou span crosses the price Close from below and sell whenever the Chikou span crosses price Close from above. Here is the list of steps it goes through:
- Wait until a new bar opens.
- Get two latest (completed) Chikou span values. Basically, they are nothing more than two latest price Close levels, but they are visually shifted back by Kijun period bars.
- Get two price Close levels at the time when those Chikou span values are displayed — i.e. Close price levels with the same shift to the past.
- If current Chikou is above respective Close level and the previous Chikou was below or at the same level as respective price Close, a bullish signal is generated and a bearish signal is invalidated.
- If current Chikou is below respective Close level and the previous Chikou was above or at the same level as respective price Close, a bearish signal is generated and a bullish signal is invalidated.
- If current Chikou is at the same level as the respective price Close, both bearish and bullish signals are invalidated as, obviously, the Chikou/price cross is ongoing and there is no telling where will it turn.
- Get the values of Senkou Span A and B at the time of latest (completed) price Close.
- If Close is above both Senkou Span A and Senkou Span B, bullish signal is confirmed.
- If Close is below both Senkou Span A and Senkou Span B, bearish signal is confirmed.
- Get the values of Senkou Span A and B at the time of latest completed Chikou span.
- If Chikou span is above both Senkou Span A and Senkou Span B, bullish signal is confirmed.
- If Chikou span is below both Senkou Span A and Senkou Span B, bearish signal is confirmed.
- If there is a bullish signal, close a short position (if there is any) and check confirmations. If both bullish confirmations are present, open a long position and invalidate the bullish signal.
- If there is a bearish signal, close a long position (if there is any) and check confirmations. If both bearish confirmations are present, open a long position and invalidate the bearish signal.
Trade Examples
Sell
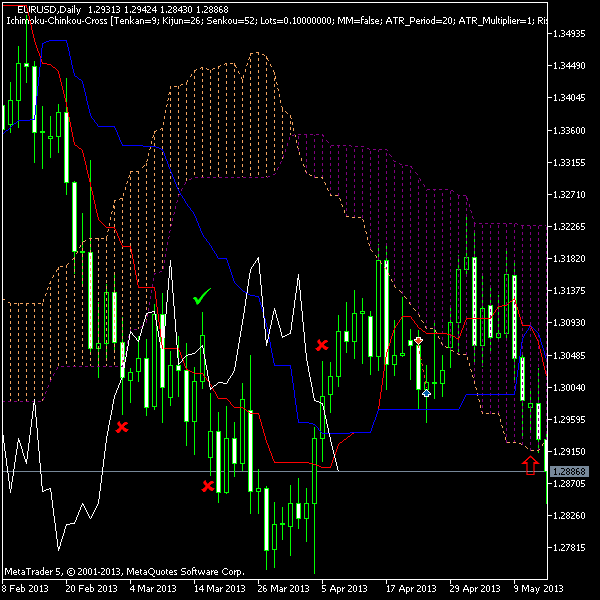
The chart example below shows four entry signals generated by Ichimoku Chikou Cross EA. Only one of the signals is confirmed by both additional conditions.
- The first signal (leftmost red x mark) is generated when Chikou span crosses price Close from below. Both cross and price Close at the moment of cross (26 bars ahead) are below Kumo — the signal is not confirmed.
- The second signal is bearish (the green tick) and is generated when Chikou span crosses price from above. It is confirmed by Kumo cloud (both cross and price Close are below Kumo), and the entry results in a winning position (shown with small red arrow connected to a blue one). It is exited one bar later when Chikou posts value above the price Close.
- The third signal (second red x mark from the left) is generated on the following bar. It closes the previously open sell position, but does not initiate a new buy position because both price Close and Chikou cross are below Kumo.
- The fourth signal (rightmost red x mark) is a potential sell position. The cross itself is properly positioned under the Kumo cloud. The problem is that the price at the moment of cross (26 bars ahead of the cross) is inside Kumo, not below it. You can see it marked with the big red arrow on the chart.
Buy
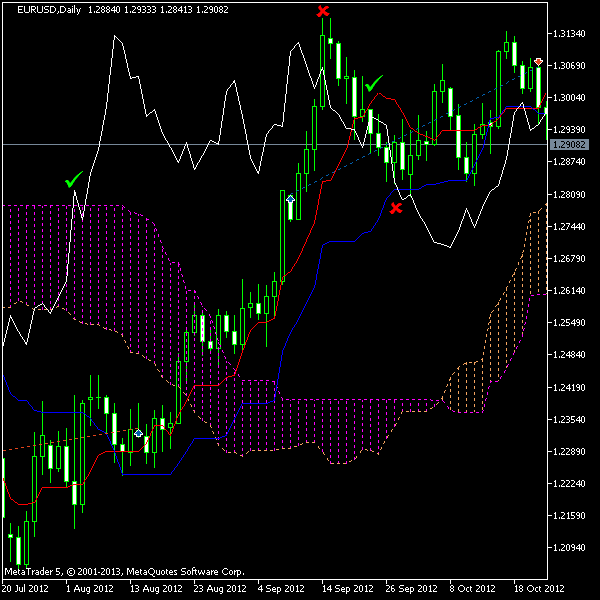
The example for long position entries based Ichimoku Chikou Cross EA strategy shows four entry signals too. Only two of them are confirmed and only one of the confirmed results in a successful trade.
- The first signal (leftmost green tick) is generated when Chikou span closes above the Kumo cloud getting the final confirmation. The actual Chikou/price cross happened earlier below Kumo and is not shown on chart. Then the price closed above Kumo and a few bars later Chikou closed above the Kumo cloud. Now all two confirmations have been received. The signal triggered opening of a long position (shown with a small blue arrow 26 bars ahead of the green tick). The position was closed later by a reverse signal (leftmost red x mark and a small red arrow 26 bars ahead of it).
- The second signal (leftmost red x mark) is not confirmed for entry. It just serves as an exit signal for the previous position.
- The third signal (second green tick) is a fully confirmed buy signal because it is generated above Kumo when the current price closed also above Kumo. The entry point is not displayed on chart as the actual price level is located 26 bars ahead and does not fit the chart. Unfortunately, it results in a short-lived losing trade.
- The fourth signal (second red x mark) is an incomplete short signal that cancels the previous trade but fails to get its own confirmations as both Chikou cross with price and the latest price Close are above the Kumo cloud.
Position Sizing
Ichimoku Chikou Cross expert advisor supports two position sizing modes: plain fixed position size and ATR-based position size. There is nothing special about the first mode — a trader just enters a volume in lots to be used with every position opened by the EA. The second mode enables either common fixed fractional position sizing or fixed money risk position sizing. In both cases, the Average True Range indicator (with a given period) is calculated before entering a new position. An optional multiplier is then applied to the obtained value. Position volume is then calculated based on the risk tolerance given either in percentage points or in currency units, with previously calculated ATR value as a potential stop-loss amount.
Backtest Results
The backtest of the Ichimoku Chikou Cross expert advisor was performed on the period from 1 January, 2001 through 23 May, 2013 (more than 12 years) on the EUR/USD D1 chart.
When fixed position volume of 0.1 standard lot has been used, the resulting net profit was $6,696 on $10,000 starting account balance with the maximum relative drawdown of 8.08%.
With ATR-based position sizing enabled (ATR period = 20; ATR multiplier = 1; 2% risk tolerance), the resulting net profit increased to $23,776 on the same $10,000 starting account balance, while the maximum relative drawdown increased to 14.57%.
Input Parameters
Ichimoku
- Tenkan (default = 9) — period for calculating Tenkan-sen.
- Kijun (default = 26) — period for calculating Kijun-sen.
- Senkou (default = 52) — period for calculating Senkou spans.
Money Management
- Lots (default = 0.1) — basic lot size for fixed position sizing. Used when MM = false.
- MM (default = false) — if true, ATR-based position sizing is enabled.
- ATR_Period (default = 20) — the period of the ATR indicator, which is used for position size calculation. Works only if MM = true.
- ATR_Multiplier (default = 1) — a value, by which the ATR indicator value will be multiplied. Works only if MM = true.
- Risk (default = 2) — risk tolerance in percentage of account balance/equity. Works only if MM = true. This input parameter is ignored if UseMoneyInsteadOfPercentage is set to true.
- FixedBalance (default = 0) — if set to non-zero value, it is used instead of account balance/equity for position size calculation. Works only if MM = true.
- MoneyRisk (default = 0) — risk tolerance in account currency. Works only if MM = true. Requires UseMoneyInsteadOfPercentage to be set to true.
- UseMoneyInsteadOfPercentage (default = false) — if true, position size is calculated based on risk amount given in account currency (MoneyRisk) instead of balance/equity percentage risk (Risk). Works only if MM = true.
- UseEquityInsteadOfBalance (default = false) — if true, position size is calculated based on account equity instead of balance. Works only if MM = true. Ignored if UseMoneyInsteadOfPercentage = true.
- LotDigits (default = 2) — number of decimal places allowed by your broker in order volume. For example, if your broker allows micro lots (0.01), then this parameter should be set to 2. If your broker allows only mini lots (0.1) this parameter should be set to 1. Required only if MM = true.
Miscellaneous
- OrderComment (default = "Ichimoku-Chikou-Cross") — the commentary for positions opened by this EA.
- Slippage (default = 100) — the acceptable price slippage in pips.
- Magic (default = 201305102104) — the order magic number to filter positions opened by this EA. Used only in MT4.
MiniFAQ
What is the average win/loss size generated by this EA?
Its backtest on EUR/USD @ D1 showed an average losing trade of 141 pips and an average winning trade of 338 pips.
How often does this EA trade?
On daily EUR/USD chart (default setting), this EA will trade 9-10 times a year on average.
What is the difference between the versions for MT4 and for MT5?
MT5 version will mess up with positions of other expert advisor on the same currency pair. MT4 will use Magic number to avoid that.
Did it show profitable results on any other currency pairs?
Yes, for example on AUD/USD and USD/JPY, but they are too insignificant compared to results obtained using the EUR/USD currency pair.
Did you optimize the input parameters of this expert advisor?
No, all backtests have been performed using standard Ichimoku Kinko Hyo periods proposed by Goichi Hosoda (the indicator's author): 9, 26, 52.
Warning!
This EA is ECN-safe.You can freely use this expert advisor with ECN (market execution) brokers as it either does not apply any stop-loss and take-profit levels in its trading orders or sends only pending orders.
Downloads
Ichimoku Chikou Cross for MT4 Zipped Ichimoku Chikou Cross for MT4 Ichimoku Chikou Cross for MT5 Zipped Ichimoku Chikou Cross for MT5 Ichimoku Chikou Cross for cTrader Zipped Ichimoku Chikou Cross for cTraderDiscussion
Warning!
Before you ask basic questions regarding installation of the expert advisors, please, read this MT4 Expert Advisors Tutorial to get the elementary knowledge on handling them.
Do you have your own trading results or any other remarks regarding this expert advisor?
Discuss Ichimoku Chikou Cross with other traders and MQL programmers on the experts forums.