Average True Range is a technical analysis indicator that measures the price change volatility. It was developed by J. Welles Wilder Jr. for commodity market analysis. The indicator says nothing about trend strength or direction; instead it just shows the volatility level.
Calculation
True Range
Before proceeding to average true range calculation, it is necessary to calculate true range. True range is calculated using the following formula:
TR = max(Hight − Lowt, abs(Hight − Closet − 1), abs(Lowt − Closet − 1))
Where TR — true range for the period t,
Hight — price High for the period t,
Lowt — price Low for the period t,
Closet − 1 — price Close for the period (t − 1),
max() — maximum value selection function,
abs() — absolute value calculation function.
The formula is translated into:
TR = max(Hight, Closet − 1) − min(Lowt, Closet − 1).
Where min() — minimum value selection function.
Average value
Average true range for a given number of periods can be calculated after calculating the true range values for all those periods. The popular number of periods for ATR is 7 (proposed by the indicator's author in his book New Concepts in Technical Trading Systems) and 14 (used, for example, in MetaTrader default settings).
The principle of exponential moving average calculation is applied:
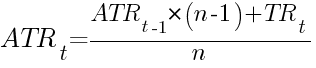
Where ATRt — average true range for the period t,
ATRt − 1 — average true range for the previous period (t − 1),
TRt — true range for the period t,
n — number of periods for averaging.
The first average true range value is calculated using this formula:
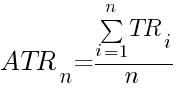
Where ATRn — average true range for the period n — the first period, for which all the n true range values are present,
TRi — true range for the period i.
Examples
7 periods
The first example shows a complete calculation process for the 7-day average true range on the EUR/USD currency pair. 8 price quotes is enough to calculate 2 ATR values. The price Close values are used with the negative shift of 1 period because only shifted values are used in the TR formula:
| i | Close | High | Low |
|---|---|---|---|
| 0 | 1.2919 | - | - |
| 1 | 1.2884 | 1.2942 | 1.2842 |
| 2 | 1.2881 | 1.2929 | 1.2846 |
| 3 | 1.2836 | 1.2889 | 1.2796 |
| 4 | 1.2881 | 1.2900 | 1.2819 |
| 5 | 1.2905 | 1.2933 | 1.2840 |
| 6 | 1.2857 | 1.2997 | 1.2833 |
| 7 | 1.2932 | 1.2956 | 1.2821 |
| 8 | - | 1.2993 | 1.2904 |
True range calculation:
TR1 = max(1.2942, 1.2919) − min(1.2842, 1.2919) = 1.2942 − 1.2842 = 0.0100;
TR2 = 1.2929 − 1.2846 = 0.0083;
TR3 = 0.0093;
TR4 = 0.0081;
TR5 = 0.0093;
TR6 = 0.0164;
TR7 = 0.0135;
TR8 = 0.0089.
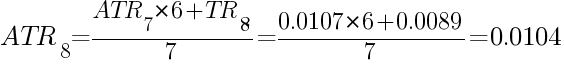
The first average true range is calculated using simple arithmetic average formula:

The next average true range should be calculated using moving average formula:
14 periods
The second example shows calculation process for the 14-day average true range of the EUR/USD currency pair's quotes. 2 ATR values will be calculated, so a total of 15 Close/High/Low quotes are required. Close prices are taken with a negative shift of one period as the TR formula uses them with t − 1 index:
| i | Close | High | Low |
|---|---|---|---|
| 0 | 1.3111 | - | - |
| 1 | 1.3075 | 1.3140 | 1.3053 |
| 2 | 1.3078 | 1.3131 | 1.3067 |
| 3 | 1.3151 | 1.3194 | 1.3071 |
| 4 | 1.3041 | 1.3176 | 1.3009 |
| 5 | 1.2935 | 1.3050 | 1.2935 |
| 6 | 1.2974 | 1.2999 | 1.2941 |
| 7 | 1.2919 | 1.3029 | 1.2912 |
| 8 | 1.2884 | 1.2942 | 1.2842 |
| 9 | 1.2881 | 1.2929 | 1.2846 |
| 10 | 1.2836 | 1.2889 | 1.2796 |
| 11 | 1.2881 | 1.2900 | 1.2819 |
| 12 | 1.2905 | 1.2933 | 1.2840 |
| 13 | 1.2857 | 1.2997 | 1.2833 |
| 14 | 1.2932 | 1.2956 | 1.2821 |
| 15 | - | 1.2993 | 1.2904 |
True range calculation:
TR1 = max(1.3140, 1.3111) − min(1.3053, 1.3111) = 1.3140 − 1.3053 = 0.0087;
TR2 = 1.3131 − 1.3067 = 0.0064;
TR3 = 0.0123;
TR4 = 0.0167;
TR5 = 0.0115;
TR6 = 0.0064;
TR7 = 0.0117;
TR8 = 0.0100;
TR9 = 0.0083;
TR10 = 0.0093;
TR11 = 0.0081;
TR12 = 0.0093;
TR13 = 0.0164;
TR14 = 0.0135;
TR15 = 0.0089.
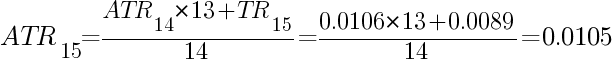
The first average true range is calculated using simple arithmetic average formula:

The next average true range should be calculated using moving average formula:
Chart
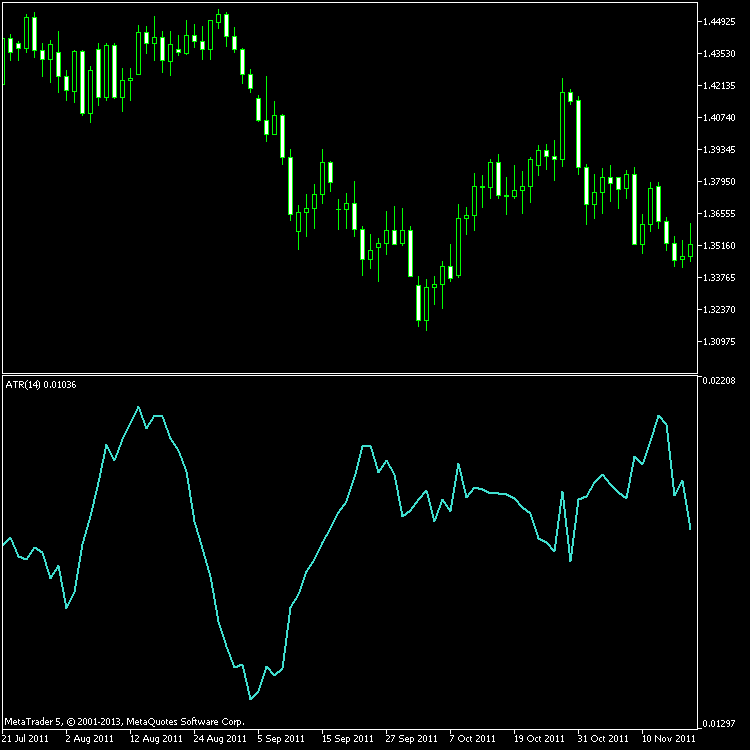
The following chart displays the average true range (cyan line below) for the EUR/USD price (shown above). Standard Average True Range indicator from the MetaTrader 5 trading platform with period set to 14 is used for calculation.
Application
As the indicator's mathematical formula suggests, average true range cannot be used for trading signals on its own. ATR is showing neither trend's strength nor its direction. A trader can apply it as a price volatility gauge and then use this information in trading:
- Some trading strategies require high (scalping, grid) or low (trend trading) volatility. Average true range can help measuring it, both in automatic and in manual modes. It is important to remember that indicator's values are relative but absolute and thus should be compared to the values derived from the same trading instrument and not to some specific fixed threshold.
- ATR can be used as a stop-loss value because price deviation for a number of pips greater than time period's average range is definitely a significant change in price's behavior. For example, such a stop-loss can be used for intraday trading, while ATR is calculated on daily chart. ATR Trailer expert advisor is based on ATR as its trailing stop-loss.
- ATR can also be used as a potential stop-loss in trading systems. It is applied in position sizing for strategies that do not set stop-loss order. In this case, the potential loss size is limited by the current market volatility.
Dependence on Period
Traders should understand that the average true range values is not increasing directly with the increasing period number (e.g. from 7 to 14). Raising the number of periods for calculation leads to better smoothing of the indicator (noise removal) and to increased lag — i.e. time between the actual volatility change and the indicator value change).
At the same time, changing the period itself (timeframe) can lead to a significant change in the calculated indicator value as the price change range is dependent on the length of this range (e.g. one day or one week).
Sources
- J. Welles Wilder, Jr. New Concepts in Technical Trading Systems. ISBN 0-89459-027-8
- http://codebase.mql4.com/250
- http://www.mql5.com/en/code/12
- http://ctdn.com/algos/indicators/show/221