Flags and pennants are chart patterns that occur frequently on Forex charts. These patterns are made up of the following sections:
- An initial price move which starts the pattern.
- A consolidation area where the price trends sideways or opposite the initial move.
- A breakout move which completes the pattern.
Flags and pennants are variations of the same pattern, with the only difference being the shape of the consolidation area. This area is a rectangle (or, to be more precise, a parallelogram) in the flag, and has a triangular shape for a pennant. This is why the consolidation areas are sometimes traded as channels in a flag, and as a triangle in a pennant. The outcome is the same for both patterns, and each pattern has a strong initial bullish or bearish component.
Components of flag and pennant patterns
What makes up the three components of flag and pennant patterns?
- The initial price move is called a pole. This is the price movement in a particular direction that tends to be very steep, and precedes the consolidation area which gives the pattern its name.
- The price consolidation follows the initial price move. This area is formed by the price trading sideways or in the direction opposite to the pole, such that the highs and lows of the price bars or candles can be connected by separate trend lines to form an area that resembles a channel or a rectangle for a flag, and a triangle or a wedge for a pennant. The patterns derive their names from the shape of this consolidation area.
- The breakout completes the pattern. The breakout relies on the identification of when time or price filters show that the price has pushed out of the consolidation area to initiate the completion of the pattern. This breakout move aligns with the initial trend, making these flags and pennants continuation patterns.
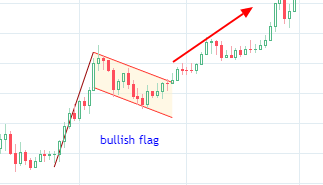
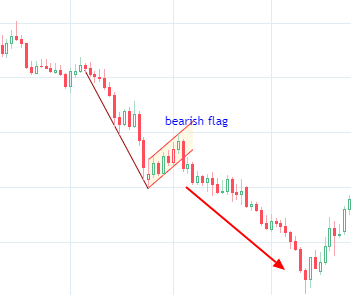
Take a look at the bullish and bearish versions of the flag pattern. You can see the initial price move (the pole), the consolidation area that is made up of two parallel lines that connect the tops and bottoms of the candlesticks, and the breakout move that went in the direction of the initial trend.
Below you can see the variations of the pennant pattern. Following the initial trend move that forms the pole of the pattern is the consolidation area that resembles a triangle (usually the symmetrical version or a wedge).
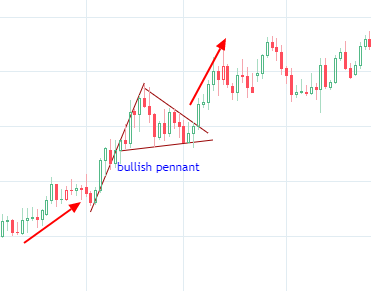
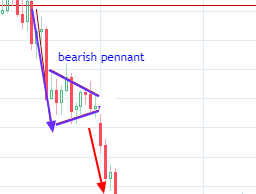
Pennants tend to form faster and have more aggressive price breaks of the consolidation areas than flags.
How to trade flag and pennant patterns
Trading currency pairs using flag and pennant patterns isn't very complicated. You can follow these three steps:
- Pattern identification.
- Current trend checkup.
- Setting up an entry and an exit.
How can an FX trader combine all these elements to produce a tradable setup based on a flag or pennant chart pattern? Below, each step is described in detail.
Pattern identification
Watch for an initial steep price movement — a strong swing up or down. That would be the pole of the pattern. Next, identify a sideways trading zone or a consolidation that retraces some of the initial move. Trend lines that connect the highs and lows independently should either be parallel to each other (for a flag) or should converge to meet each further in the future (for a pennant). The sideways consolidation area tends to bend against the trend rather than trade strictly sideways.
Current trend checkup
One of the most important condition for any flag or pennant pattern to work is for the chart to demonstrate a previous trend in the direction of the pattern's pole movement. Bullish flags and pennants have to be inside a general uptrend (or at least pose a significant, compared to the preceding chart behavior, rally themselves). Bearish flags and pennants have to be inside a general downtrend to be valid. Sometimes, traders attempt to open a position based on a bullish pattern found inside a declining trend or based on a bearish pattern inside a rising trend. Although it may work from time to time, but success rate of such invalid setups is inferior to that of a correctly located flag or pattern.
Setting up an entry and an exit
Entry
The trade can be entered only when the price has broken the consolidation area in the direction that the initial move (the pole) was. This is confirmed using a candle's close, which should be well above the consolidation area of a bullish pattern or well below the consolidation area of a bearish pattern. To put it more clearly, there must be a breakout candle that breaks through and then closes well beyond the pattern’s border, which means that its Close value isn't near or just above/below the pattern's border but rather at a considerable distance. Using 10% of the channel's width for a flag or of the pennant's base width for a pennant can be a good rule of thumb here.
Once the breakout is confirmed, the trader executes the trade in the direction of the breakout: long trades for bullish flags/pennants, and short trades for the bearish flags/pennants.
Exit
To set up a profitable exit (take-profit) with flag and pennant chart formations, you can use a measured move. A measured move is the move that starts at the opposite side of the consolidation area and is of the same length as the initial move (the pole). Measure the distance from the start of the pole to the far end of the consolidation area (L). Then apply the same distance to the consolidation's border opposite to the breakout point. Set your take-profit at the resulting price level. Take a look at the chart screenshot below. As you see, the breakout move lasted nearly the same as the measured move we applied.
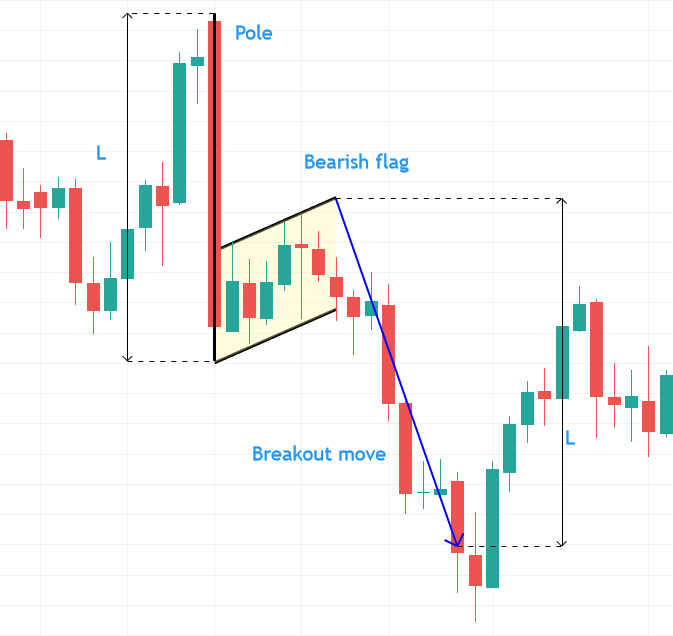
Once the breakout hit a price target that corresponded to the same length as the pole, the price started to retrace in the opposite direction. This shows the importance of using the measured move in setting trade exits in flags and pennants.
Stop Loss
The stop-loss for each pattern is set near the top of the consolidation area for a bullish pattern and near the bottom of the consolidation area for a bearish pattern. See the chart examples in the section below for real-life chart markups of stop-losses for bearish flags and pennants.
After you calculate your stop-loss and take-profit levels, you have to consider whether the resulting risk-to-reward ratio is good enough for you to trade this setup. If not, it might be a better idea to skip the current pattern.
Chart examples
This chart snapshot shows the daily chart of gold, where a bearish flag and a bearish pennant followed each other in sequence. Both take-profit (TP) and stop-loss (SL) levels are marked for the patterns.
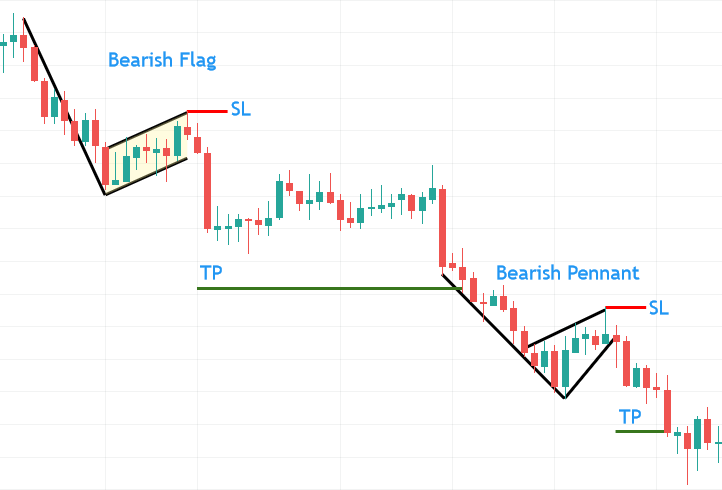
As an exercise, can you on your own:
- identify how the TP points were calculated in each of the patterns?
- identify how these patterns were determined and their borders plotted?
- identify where breakout points are and what the approximate TP:SL ratio is?
If you can, then you are on your way to successfully trading Forex pairs and CFD's with flag & pennant formations.
Are there instances where these patterns can fail? Flags and pennants have a rather low failure rate. It is rare to see a correctly established pattern fail. Pattern failures usually result from an incorrect identification of a general trend the pattern is in or from a premature entry on a non-confirmed breakout. Sometimes, there are no traceable causes for pattern failure. This is why all trade entries must be secured with a stop-loss. Here is an example of a failure of a bullish flag pattern on a weekly silver CFD chart:
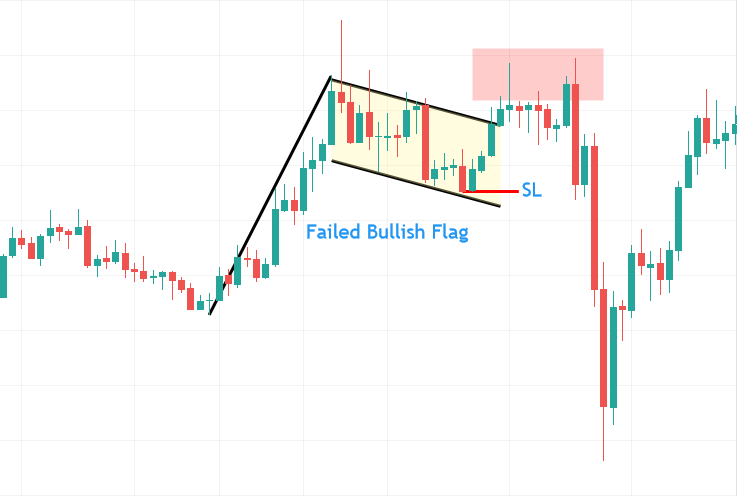
The bullish flag failed to continue significantly after it had broken out of the upper flag border as it met a significant resistance zone (red background).
Conclusion
Flags and pennants occur frequently on currency and commodity charts. They are best traded on the 4-hour, daily, and weekly timeframes. The breakout is determined using a combined price and time filter — a breakout candle has to close well above/below the border. The initial move (the pole) is used to calculate the approximate extent of the breakout move, and this is used to determine your trade’s target. A protective stop is determined by the consolidation area's peak point. Applying flags and pennants in Forex trading can be a viable addition to any chart pattern trader's tool set.