How do you know when a market is overbought or oversold? One indicator that can help you to visualize these conditions on your Forex charts is the Money Flow Index, often just called MFI for short.
This guide will teach you how to plot this indicator on your charts, how to interpret it, and how you can put it to good use while you trade.
What is the Money Flow Index?
The Money Flow Index is a type of oscillator designed by Gene Quong and Avram Soudack. It is weighted by volume.
Money Flow Index formula
To get money flow index manually, follow these steps:
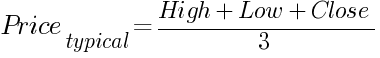
- Calculate the typical price by averaging together the high, low, and closing price:
- Multiply the typical price by volume to get the money flow:

Compute the positive money flow and the negative money flow separately.
If the typical price on a given day is higher than it was the day before, it is a positive money flow day. Add together the money flow for all such days to compute positive money flow.
If the typical price on a given day is lower than it was the day before, it is a negative money flow day. Add together the money flow for all such days to compute negative money flow.
There may be days where there is no typical price change compared to the previous day. You can ignore those days in your positive and negative money flow calculations.
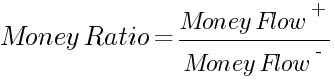
- Compute the money ratio by dividing positive money flow by negative money flow:
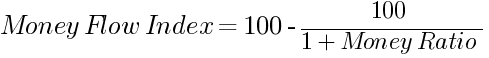
- Calculate the money flow index using the following formula:
The math above may seem like a lot of work, but when you use trading software like MT4, you will not need to worry about doing these calculations by hand. The trading platform will take care of all of the math for you.
How to read Money Flow Index?
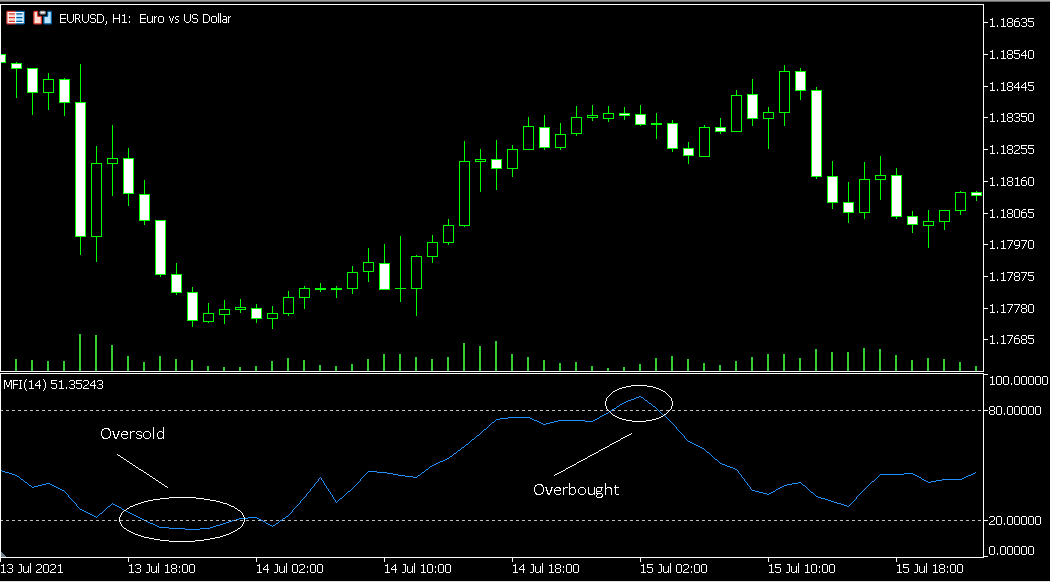
When you plot it on your chart, you will see a line oscillating between 0 and 100, with additional horizontal lines drawn at 20 and 80. In terms of its appearance, it is quite close to the Relative Strength Index (RSI), a similar oscillator.
Key point: The Money Flow Index (MFI) is a kind of oscillator that ranges between 0 and 100.
What does the Money Flow Index show us?
The name “money flow index” describes quite well what it is the MFI is showing us. For the asset that you are looking at, you can see how money is flowing in and out.
The main utility of monitoring money flow in this fashion is that you can get a feel for whether the market may be overbought or oversold.
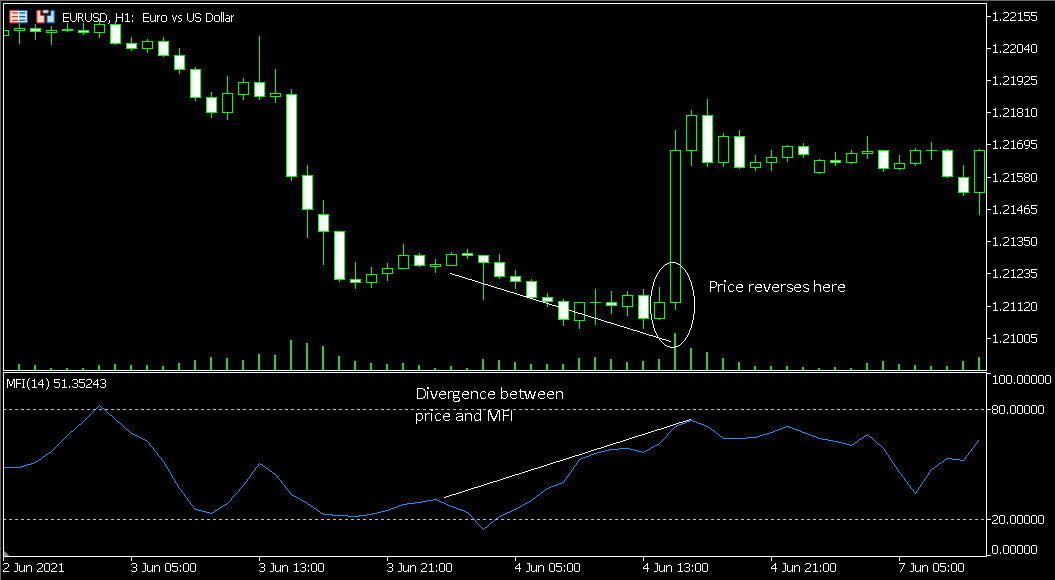
Sometimes, you can also spot reversals based on divergence.
Key point: You can plot the MFI on your charts to detect when an asset may be overbought or oversold.
How to add the Money Flow Index to your charts?
- Attach the indicator to your chart. Where you will find it depends on your charting platform. In MT4, it is under Insert->Indicators->Volume.
- Go with the defaults, or choose custom settings for the period, volumes, and levels.
- Now you can use the indicator. It will appear on the bottom of your chart.
Key point: You can quickly and easily plot the MFI on your charts.
How to use the Money Flow Index in trading?
There are a few ways you can make use of the Money Flow Index in your trading strategy:
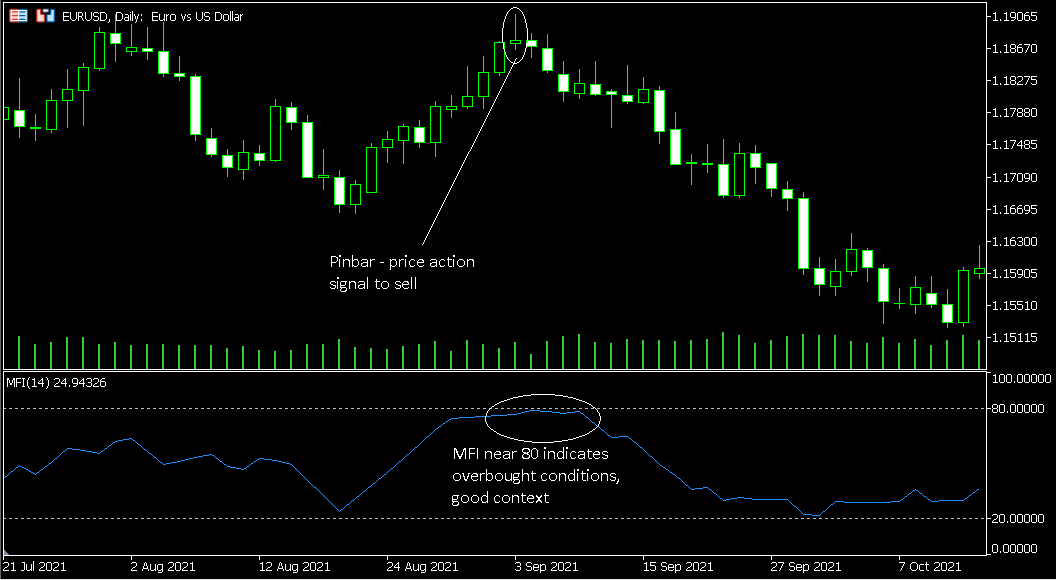
- Look for overbought and oversold conditions. When you see the oscillator pass above 80, that may mean the market is overbought. When you see it dip below 20, that may mean it is oversold. Some traders prefer to use 10 and 90, though this will give you fewer signals.
- If the MFI is trading within the 20 and 80 bounds, keep an eye on whether it is above or below 50. When it crosses above 50, buying pressure exists. Selling pressure exists when it drops under 50.
- When you see the oscillator drop below 20, that may mean that it is time to buy. When it is above 80, it could be time to sell.
- Look for divergences. Sometimes you will see the indicator and price going in two different directions. As an example, say that the asset’s price is rising. But you see the oscillator dropping. In such a situation, there is a reduction in buying pressure. It could be time to sell. The reverse can happen as well.
- Having a hard time knowing when a retracement is complete? During a retracement, you will sometimes notice the oscillator fleetingly crossing above 80 or under 20, and then returning. Once it returns, the retracement is likely done and you can enter the trade.
Key point: You can use the MFI to determine if the market may be overbought or oversold, or to look for reversals in the market using divergences. Sometimes the MFI can also help you time your entry into trend trades by showing you when a retracement is done.
General tips for using the Money Flow Index
- Simply plotting the MFI on your chart is not in and of itself a trading system. While the MFI can give you some perspective on what is going on in the market, by itself, it will not give you all the information you need to identify solid setups. So, you should use it along with other indicators to get a comprehensive picture of the market. You could, for example, use it to confirm what other indicators are telling you.
- Before you put the MFI to use, you need to backtest and demo test your trading strategy. Only go live once you see that your method has the potential to generate profit.
- Which is better — the MFI or the RSI? That depends on who you ask. The momentum-based RSI is the one that more traders are familiar with. But you can get just as good of results with the MFI, depending on your strategy. Indeed, there are even Forex traders who use both of these indicators on their charts at the same time. You will need to figure out what works best for you based on your tests.
Key point: The Money Flow Index needs to be part of a tested, proven strategy if you want to put it to effective use.
Conclusion
The MFI can lend valuable context to your trading method, but isn't a trading method on its own. If you have been looking for a tool to add overbought and oversold context to your charts, help you spot potential reversals, and assist you in making sense of retracements, the Money Flow Index may be just what you are seeking.
Try adding the MFI to your chart. Train yourself to look for divergence, and watch the 20, 80, and 50 lines to keep track of buying and selling pressure. Incorporated into a reliable trading method, this oscillator can help you to get in on reversals quickly and maximize your profit potentials.
If you have any questions about the Money Flow Index indicator or if you just want to discuss its use in trading with others, you can proceed to our Forex forum.