Trading Breakouts
A breakout is a significant change in price direction. The classic definition of a breakout is price penetrating a support/resistance line (including triangles, flags, and pennants), but breakout can be defined in fancier ways, such as breaking a Bollinger Band, ATR band, or linear regression channel, or by special bars like the engulfing bullish candlestick and key reversal bar. A breakout is usually a big one-time move in the opposite direction of the existing trend, although sometimes a breakout sneaks up on the critical level and slides over it instead of breaking it with any violence. Just about every trader watches for breakouts with an eagle eye, even long-term position traders. As a rule, the earlier you jump on a breakout trade, the bigger the gain.
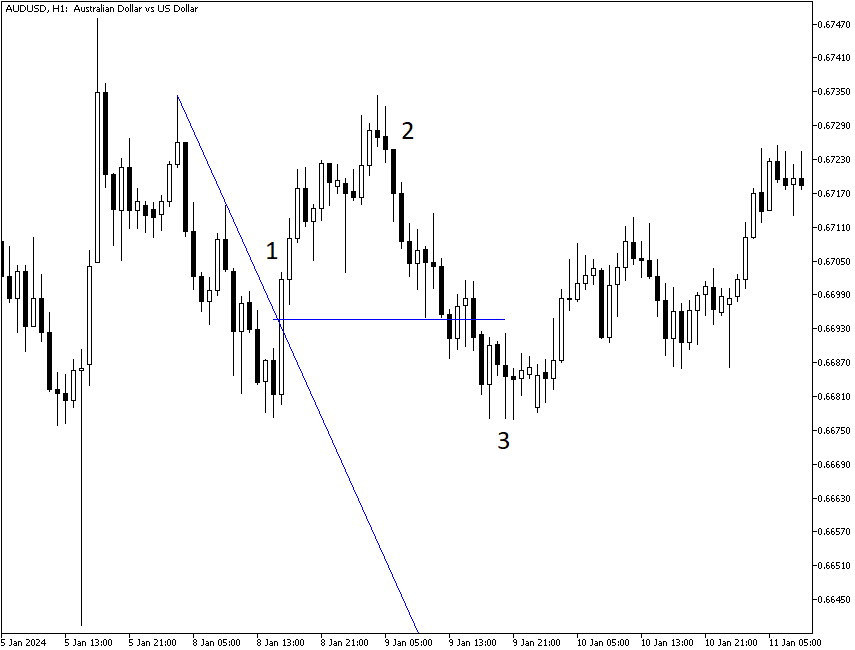
The problem is that many breakouts in Forex are false – they fizzle out, and the price resumes in the pre-breakout direction. This is not hard to understand. The breakout occurs in the first place because of a change in sentiment toward the currency. Please see the example chart below. The breakout is characterized by a very tall candlestick that breaks upside resistance and is followed by a few more mostly higher highs. However, the new sentiment lacks staying power, and after an upward correction (which reaches about 100% of the previous down move, by the way), the currency reverses. When the price penetrates the breakout point on the downside, you know the breakout has failed. The price goes on to a lower low. Traders had a change of heart about the newly positive sentiment that triggered the upside breakout.
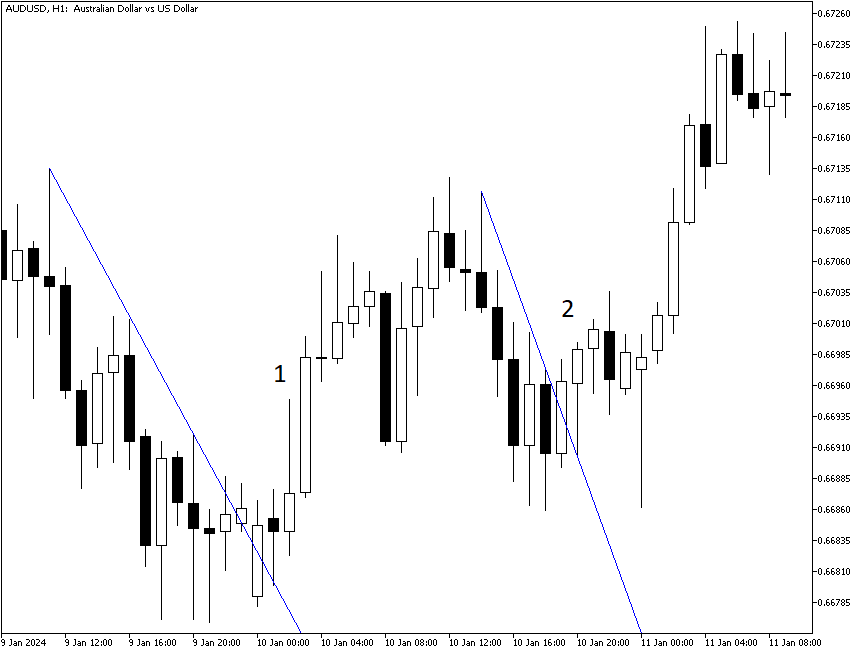
Note that sentiment changes often. A few days later, after the new lowest low, they got that positive sentiment back and staged another upside breakout, followed by another move higher. You can see it on the next chart. So far, the second breakout has not failed. It is a curiosity that the resistance lines appear to be almost parallel. This is a frequent occurrence and probably reflects that each currency has its own momentum habits. This particular currency pair is AUD/USD. Support and resistance lines in another currency pair, say NZD/USD, have a different slope.
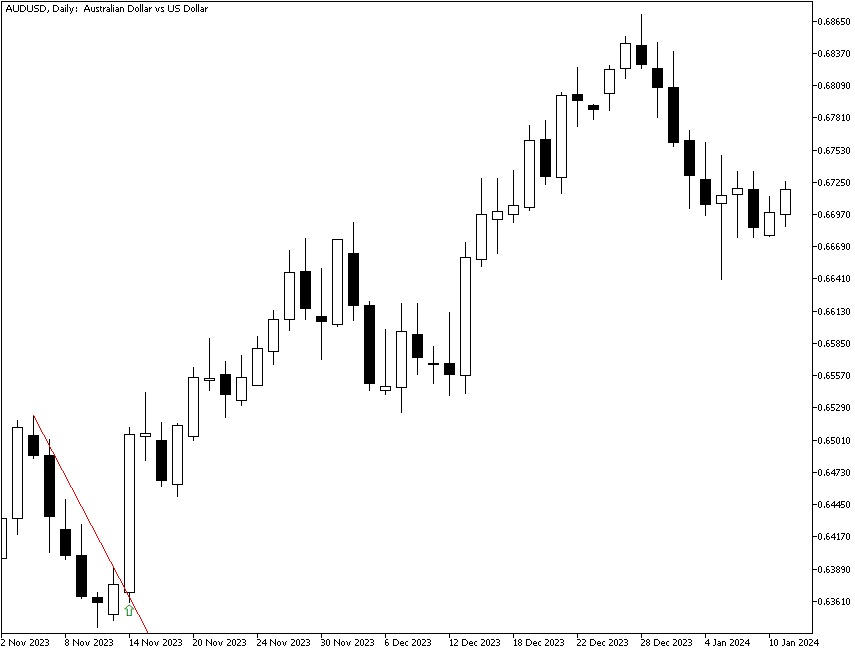
Breakouts are often caused by an important piece of news or an event that changes sentiment, like an important macroeconomic report that deviates from expectations. The next chart depicts AUD/USD in November 2023. A report showed that US inflation slowed more than experts had predicted, causing the US dollar to fall against other currencies. As a result, the AUD closed above the resistance line on the day when the report was released. As we can see on the chart, the breakout proved to be true as the pullback after the breakout was not nearly big enough to bring the price close to the breakout level, and the currency pair continued its move higher.
Sometimes, a breakout takes place in the absence of any news or detectable change in sentiment. Clearly, some player or group of players had a change of sentiment, but we may not find out what it was until long afterward. Or some players were trying to drive the price to a level so they could buy more cheaply or sell more dearly. When you are trying to reconcile fundamentals with a breakout on the chart and cannot find reasons, you have to decide whether to obey what you know about the fundamentals or to have faith in the chart. This is a personal decision, but most traders choose to trade the breakout and plan to get out fast in case it fizzles. If you wait until a breakout is confirmed, you will have an opportunity loss since a large portion of the gain comes early in the breakout move.
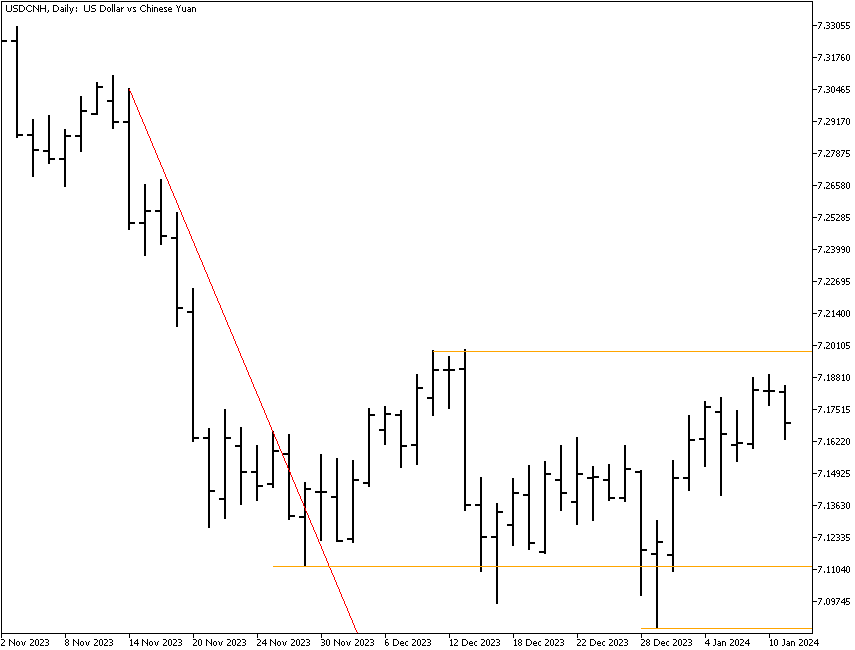
Confirming a breakout can be tricky. Some analysts consider a breakout valid if the move is some minimum percentage change, like 20%. We find such a rule to be not useful. A breakout can be valid at 10% or invalid at 40%. One rule is to consider the breakout not false if a previous high or low is matched and surpassed. The USD/CNY chart below shows an upside break of the red resistance line, but then the price fails to make a higher close (topmost gold line). This is usually a sign of a failed upside breakout, but in practice, you cannot be sure until it closes below the low made before the breakout (next lower gold line). A bigger test of failure is if it closes below the new low made after the breakout (bottommost gold line).
If you are new to technical analysis, breakouts are about to become the bane of your existence because they can be so confusing. Breakouts seem to be fizzling when all that is happening is a large group taking an early profit — and then the move resumes. Breakouts go hand-in-hand with pullbacks, and so you need to get a clear idea of both concepts.