Popular results
Position Sizer
Calculate risk-based position size directly in your MetaTrader platform and execute a trade in one click or a press of a button.What Is Forex
Learn what Forex is and how it works from this simple explanation.Supertrend
Download the Supertrend indicator for MT4 and MT5 to detect trend changes based on the price action.Position Size Calculator
Calculate your position size based on risk, stop-loss, account size, and the currencies involved. A simple online calculator for quick results.Float
Float MetaTrader indicator — a sophisticated indicator that analyzes the previous chart history for the given currency pair and then tries to analyze the trends in the current situation. It shows where trends start and end in a separate chart window and Fibonacci retracement levels combined with DiNapoli levels on the main chart. It also displays how long ago the local high and low were detected. This indicator is available for MT4 and MT5.
The indicator repaints its levels based on all the bars it analyzes (200 by default). This means that you cannot use its detections of new peaks or troughs as trading signals as they will be revised based on how market situation develops further. This indicator should be used only for the analysis of trend swing durations and important chart levels.
Input parameters
- Float (default = 200) — the number of bars to process for trend analysis. The lower is the number means more up-to-date data but less accurate analysis.
- ObjectPrefix (default = "FI-") — prefix for chart objects for compatibility with other indicators.
- DisableDinapoli (default = false) — if true, then DiNapoli levels won't be drawn in the main chart window.
- DisableFibonacci (default = false) — if true, then Fibonacci levels won't be drawn in the main chart window.
- DrawVerticalLinesAsBackground (default = false) — if true, vertical lines for trend start and end will be set as chart background to avoid concealing the chart itself.
- SwingBorderColor (default = clrBlue) — the color of the swing zone borders.
- SwingBorderWidth (default = 1) — the width of the swing zone borders.
- SwingBorderStyle (default = STYLE_SOLID) — the line style for the swing zone borders.
- SwingLinesColor (default = clrRed) — the color of the swing lines.
- SwingLinesWidth (default = 1) — the width of the swing lines.
- SwingLinesStyle (default = STYLE_DOT) — the line style for the swing lines.
- FiboColor (default = clrGreen) — the color of the Fibonacci levels.
- FiboWidth (default = 1) — the width of the Fibonacci levels.
- FiboStyle (default = STYLE_DASH) — the line style for the Fibonacci levels.
- DinapoliColor (default = clrRed) — the color of the DiNapoli levels.
- DinapoliWidth (default = 1) — the width of the DiNapoli levels.
- DinapoliStyle (default = STYLE_DOT) — the line style for the DiNapoli levels.
Float indicator example
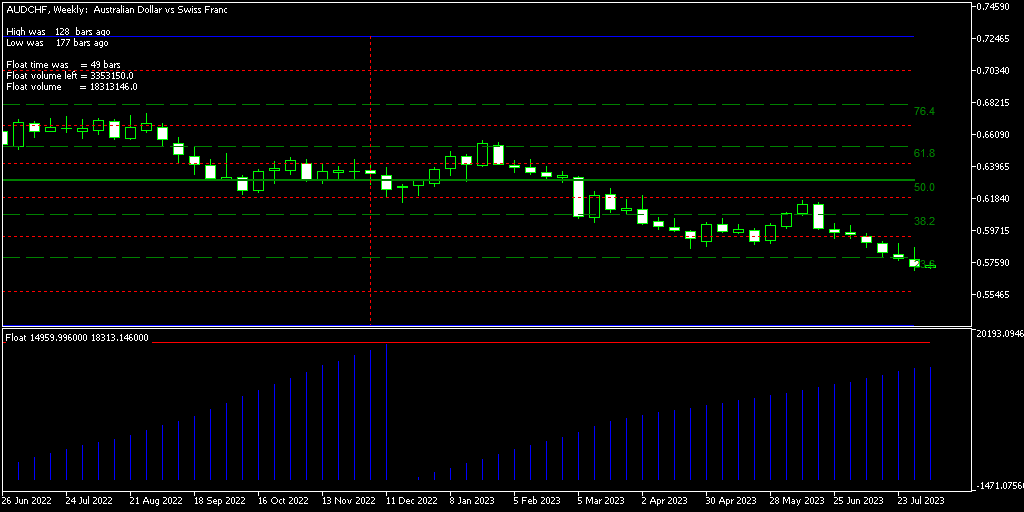
As you can see, the trend's start and end are marked clearly on the chart with this indicator. You can attach it and wait for the beginning of the next trend and then decide whether to buy or sell. Fibonacci retracement levels can be used for the target and stop-loss levels.
Using Float indicator in expert advisors
Float indicator supports multiple output buffers to give access to all of its information to MetaTrader expert advisors that call it via iCustom(). The main two indicator buffers give access to all timeseiries of the volume histogram and the red Float line in the separate chart window:
- 0: Float histogram
- 1: Float line
Other data is put directly to the output buffers at the latest bar shift (0/zero):
- 2: Swing top — the highest price of the Float period
- 3: Swing bottom — the lowest price of the Float period
- 4: High distance — the distance from the current bar to the highest price
- 5: Low distance — the distance from the current bar to the lowest price
- 6: Swing time — the length of Float period in bars
- 7: Float volume
- 8: Float volume left
- 9: Fibonacci 23.6 level
- 10: Fibonacci 38.2 level
- 11: Fibonacci 50.0 level
- 12: Fibonacci 61.8 level
- 13: Fibonacci 76.4 level
- 14: DiNapoli 0 level
- 15: DiNapoli 1 level
- 16: DiNapoli 2 level
- 17: DiNapoli 3 level
- 18: DiNapoli 4 level
- 19: DiNapoli 5 level
- 20: CV start — the datetime stamp of the beginning of the Float period
- 21: CV end — the datetime stamp of the end of the Float period
- 22: Swing end 1 — the datetime stamp of the end of the 1st swing Float period
- 23: Swing end 2 — the datetime stamp of the end of the 2nd swing Float period
- 24: Swing end 3 — the datetime stamp of the end of the 3rd swing Float period
- 25: Swing end 4 — the datetime stamp of the end of the 4th swing Float period
- 26: Swing end 5 — the datetime stamp of the end of the 5th swing Float period
- 27: Swing end 6 — the datetime stamp of the end of the 6th swing Float period
- 28: Swing end 7 — the datetime stamp of the end of the 7th swing Float period
- 29: Swing end 8 — the datetime stamp of the end of the 8th swing Float period
- 30: Swing end 9 — the datetime stamp of the end of the 9th swing Float period
The Fibonacci and DiNapoli buffers are getting filled only if they are enabled. Swing end values are getting filled only if there are swing Float periods on the chart.
Download (ver. 1.02, 2023-08-07)
Float in .zip for MetaTrader 4
Float in .mq4 for MetaTrader 4
Float in .zip for MetaTrader 5
Float in .mq5 for MetaTrader 5
Discussion
Warning!
If you do not know how to install this indicator, please read the MetaTrader Indicators Tutorial.
Do you have any suggestions or questions regarding this indicator? You can always discuss Float with the other traders and MQL programmers on the indicators forums.
Changelog
1.03 - 2025-05-11
- Added new indicator buffers to give access to expert advisors to all the available information.
- Fixed an issue with random values in the historic part of the chart for MT5.
1.02 - 2023-08-07
- Added color/style/width parameters for the indicator's lines.
1.01 - 2022-03-06
- Refactored MQL4 and MQL5 code.
- Added ObjectPrefix input parameter to make possible adding more than one instance of Float to one chart and to make it compatible with other indicators.
- Improved calculation performance.