Market sentiment shows the current disposition of traders relative to specific currency pairs. While
You would need to combine information from several brokers to get a more precise picture of the situation with the retail sentiment because brokers base their sentiment values on their client base, which is limited even at big companies. Below, you will find descriptions of some of the most popular online Forex sentiment meters.
Oanda
Oanda provides retail sentiment data via its premium indicators set for MT4 that live account traders can download and install on top of their MetaTrader 4 platform.
In reality, the sentiment analysis tool is an expert advisor, not an indicator and is called OANDA Sentiment Trader. It can be used to place trades and to track existing positions across currency pairs.
Anyway, it offers two views: the current trading symbol and the list of currency pairs.
The symbol view offers a doughnut chart with percentage values for long and short trades held by Oanda's retail traders:
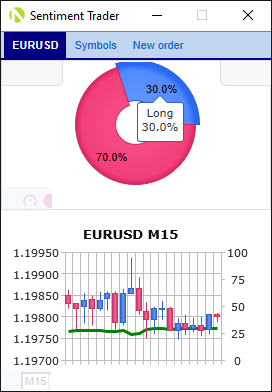
Below the sentiment chart, there is a price chart featuring the history of the sentiment index. However, the highest timeframe available there is H1 (hourly) with a maximum of 20 data points in the chart.
The list of symbols includes 11 currency pairs and 1 commodity pair (gold). Hovering the mouse pointer over a sentiment histogram invokes a tooltip with the exact percentage value for long or short positions:
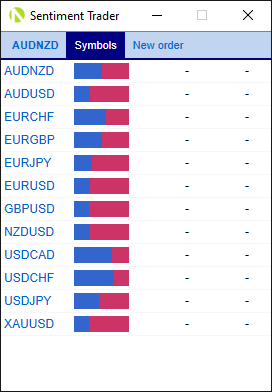
The symbols in Oanda's Sentiment Trader panel include: AUD/NZD, AUD/USD, EUR/CHF, EUR/GBP, EUR/JPY, EUR/USD, GBP/USD, NZD/USD, USD/CAD, USD/CHF, USD/JPY, XAU/USD.
Overall, the market sentiment information offered by Oanda isn't very exciting. Combined with the requirement of opening a live account with them (which is a real pain), this makes it a suboptimal choice of a Forex sentiment analysis source unless you are already trading with this broker.
ForexFactory
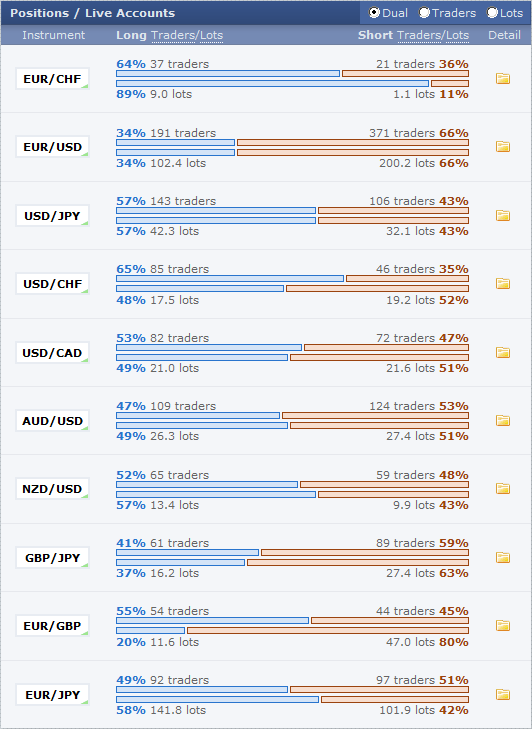
Positions / Live Accounts indicator shows a breakdown of long/short traders and lots for 10 currency pairs at a time. By default, they are: EUR/CHF, GBP/USD, USD/JPY, USD/CHF, USD/CAD, AUD/USD, NZD/USD, GBP/JPY, EUR/GBP, and EUR/JPY. However, they can be changed to almost any other currency pairs. The numbers are presented in a very accessible manner.
Additionally, it is possible to view the details for an individual currency pair. They include Traders, Lots, Average Entry Price, Average Trade Duration, Winning Trades and Losing Trades. All values are broken down into longs, shorts and total. The details also show a chart for lots/traders in M5, H1 or D1 timeframe. There are about 40 hours of data available for M5, 30 days for H1, and 10 months for D1.
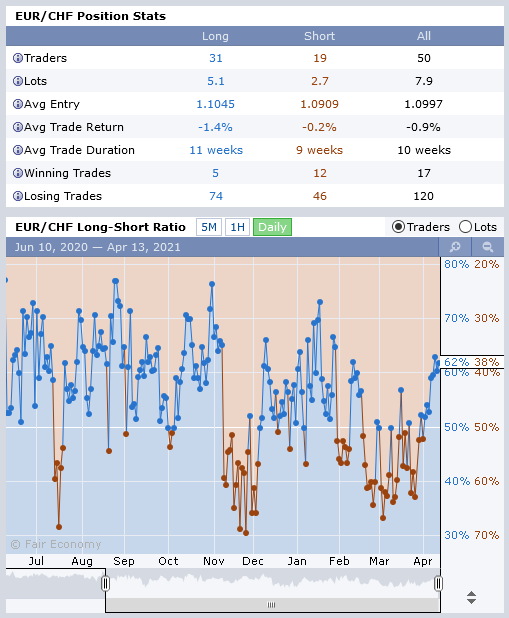
A breakdown of community members and the sizes of their positions is visible below the details chart. This breakdown can also be switched to entry prices mode, showing the average entry rates of those positions. While many members protect their positions with privacy settings, some share their trades fully.
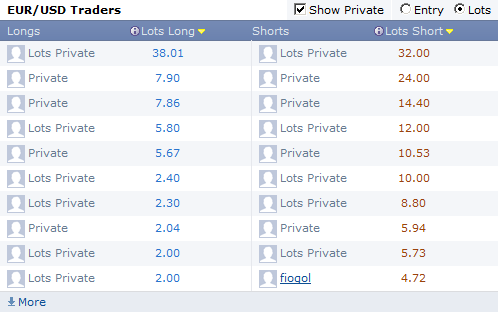
ForexFactory is not a broker but a community website for traders. Nevertheless, they are able to offer their own sentiment meter. Its biggest problem is that it is based on the accounts of the traders who voluntarily signed up with ForexFactory and connected their live account to the website. This results in a limited and somewhat biased sample.
DailyFX
IG Client Sentiment is a sentiment metric based on number of traders who are long and short on a given Forex instruments. It is based on the data from IG's live account holders. The data is updated in
The data includes the current sentiment breakdown for the number of long/short positions and a daily and weekly sentiment change in the number of longs and shorts, and in open interest. The data is given for all major Forex pairs, gold, silver, and some stock market indices.
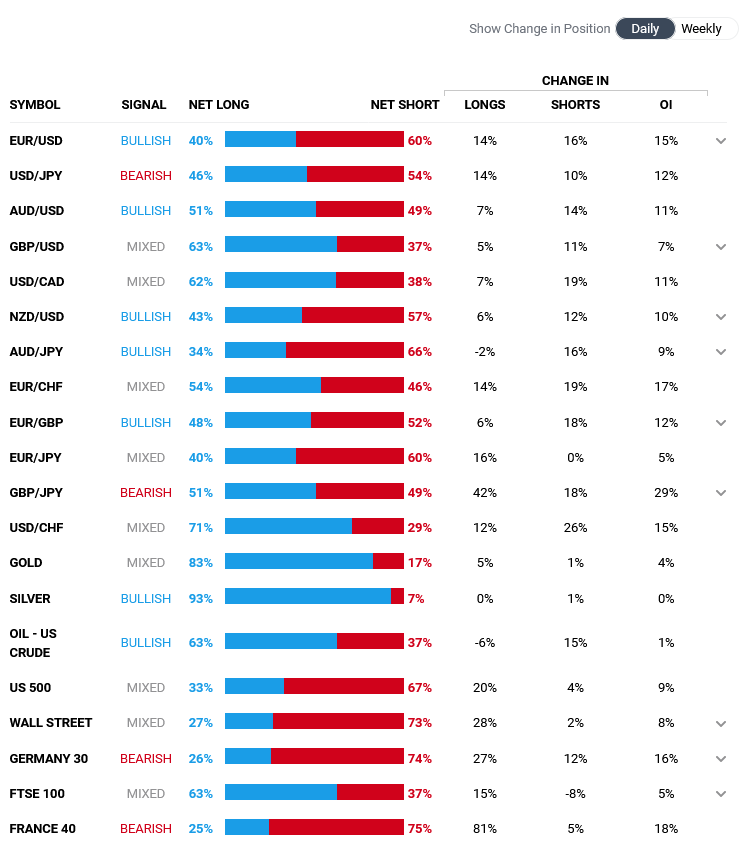
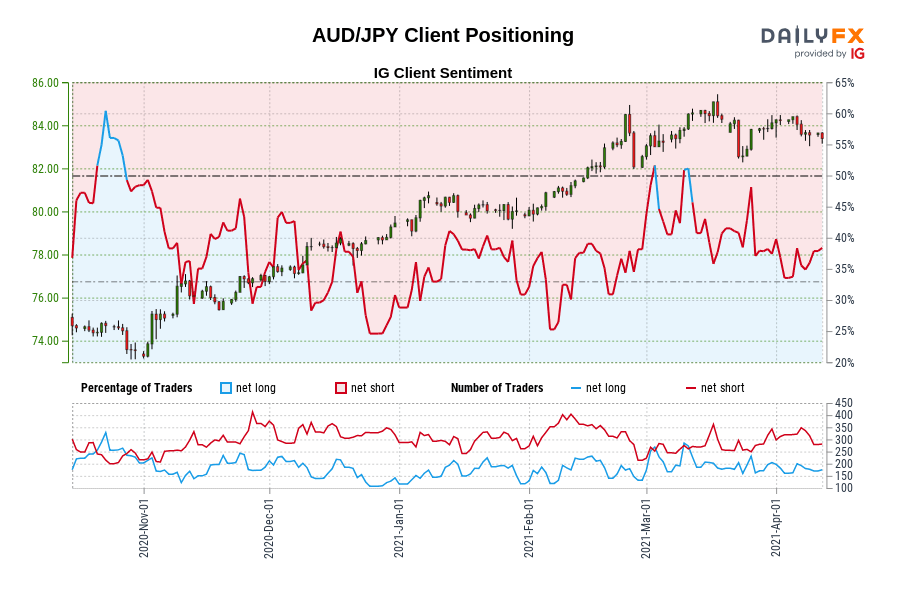
You have also an option to go to the Full IG Client Sentiment Report to check some detailed reports for many of the above-mentioned trading instruments. This report includes a 6-month sentiment chart for the currency pair. For example, here is one for AUD/JPY:
Saxo Bank
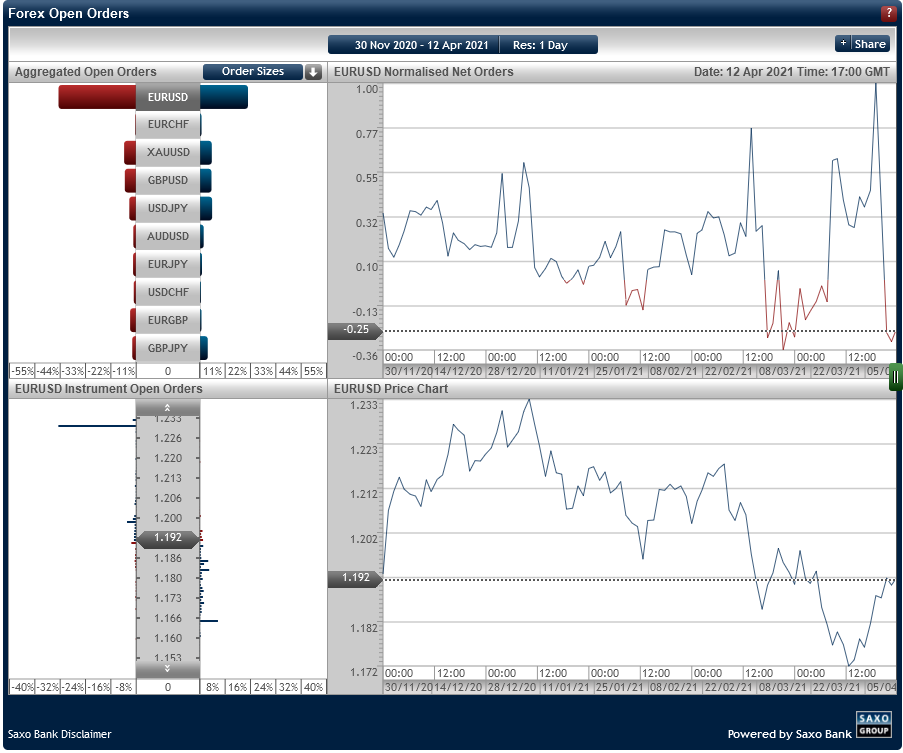
Provided by Saxo Bank, FX Open Orders and FX Open Positions charts offer order data similar to Oanda's. They are available in a
The following data is provided for each of the 10 supported currency pairs (AUD/USD, EUR/CHF, EUR/GBP, EUR/JPY, EUR/USD, GBP/JPY, GBP/USD, USD/CHF, USD/JPY, and XAU/USD):
Aggregated Open Orders. Order sizes and buy/sell ratios. It is a single diagram for all currency pairs. Clicking on a currency pair name will bring up three other charts:
- Normalized Net Orders — relative proportion of buy and sell orders at a given point in time.
- Instrument Open Orders — shows a number of buy and sell orders at given price points.
- Price Chart — a good old currency pair price chart.
Saxo Bank:
Aggregated Position Ratios. Position sizes and long/short ratios. It is a single diagram for all currency pairs. Clicking on a currency pair name will bring up three other charts:
- Normalized Net Positions — relative proportion of long and short positions at a given point in time.
- Instrument Open Positions — shows a number of long and short positions at given price points.
- Price Chart — currency pair price chart.
Saxo Bank:
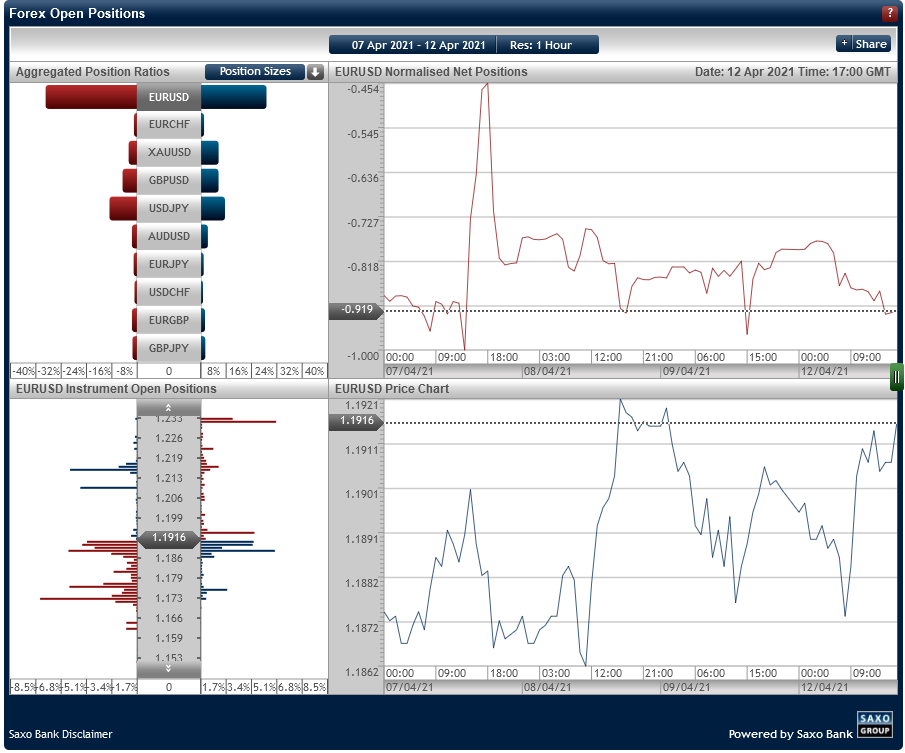
Hourly data is available for a time horizon of up to 6 months and there are 5 years of data for 1-day resolution.
Dukascopy
SWFX is a short form of Swiss Forex Marketplace — an ECN network provided by Dukascopy. The main advantage of SWFX is that it is divided into two parts — Liquidity Consumers and Liquidity Providers. The former are comprised of regular traders, money managers and hedge funds. Even if they use limit and stop orders, they are counted as liquidity consumers as they do not do it on a regular basis. Providers are banks and currency marketplaces who regularly set up bids and offers for other participants to trade on. Each trade in one category has a corresponding trade in another one.
Each category features both the current sentiment index and its historical version. The current index presents the percentage shares of buy and sell positions for a given currency pair or currency. The historical index shows
The indicators are updated every 30 minutes.
Currently, the sentiment index can be accessed on two pages on Dukascopy's website — SWFX Sentiment Index offers Liquidity consumers data on 8 currency pairs, gold (XAU/USD) and Brent crude oil:
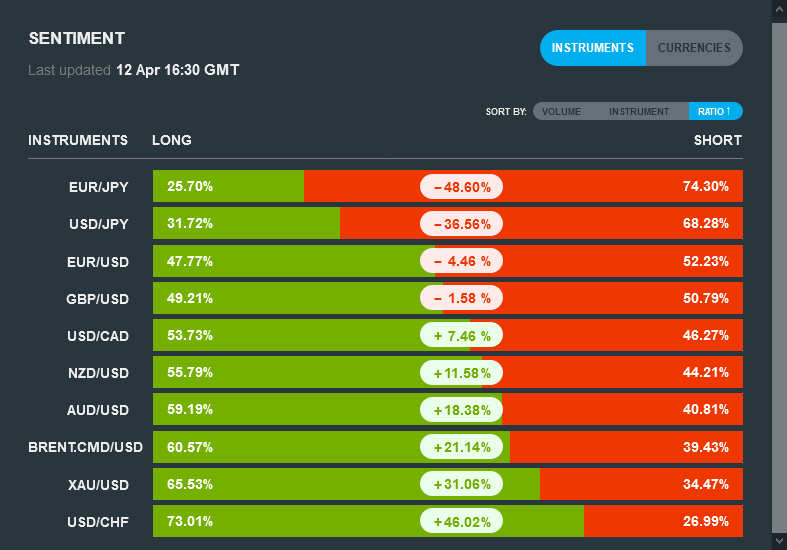
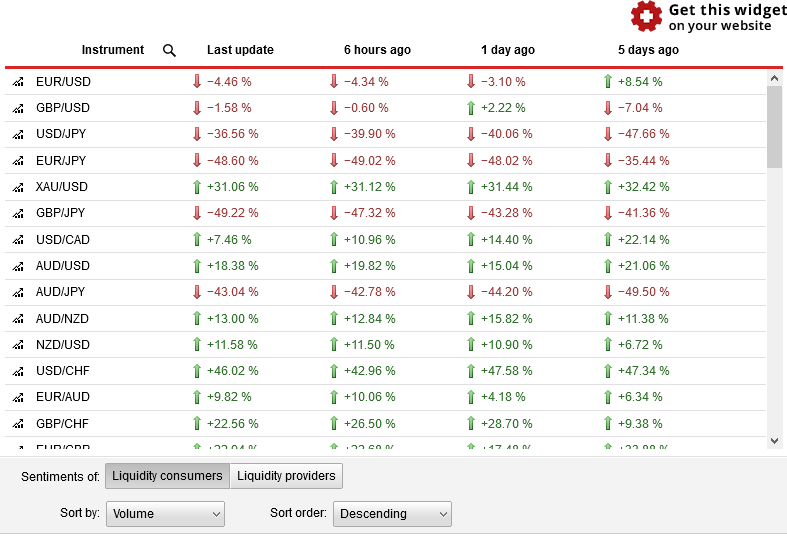
This page also features the historical changes to the sentiment index, which is available for all of Dukascopy's currency pairs:
SWFX ECN Marketplace page offers a sentiment indicator for all trading instruments available at Dukascopy but without any historical information:
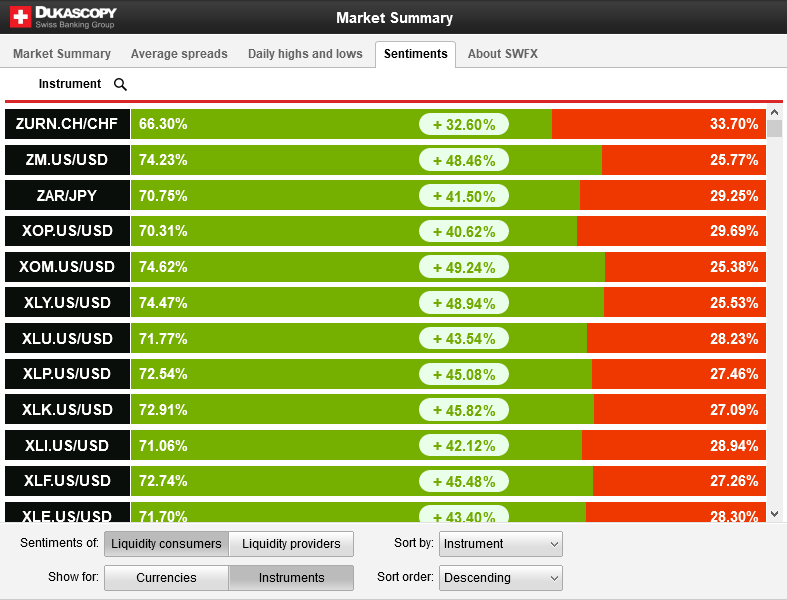
It can be switched from Liquidity consumers to Liquidity providers, but there is little sense in this operation as they are exact inverse values of each other.
cTrader
cTrader is one of the popular Forex trading platforms. Similarly to MetaTrader, it is completely free for traders. It is also very easy to open a demo account after installing cTrader.
cTrader offers a retail market sentiment indicator for all trading instruments, including dozens of currency pairs, cryptocurrencies, stock indices, and even individual shares.
The sentiment indicator isn't sophisticated and apparently just incorporates the data from all cTrader platforms. You cannot see the historical values — only the current sentiment is available.
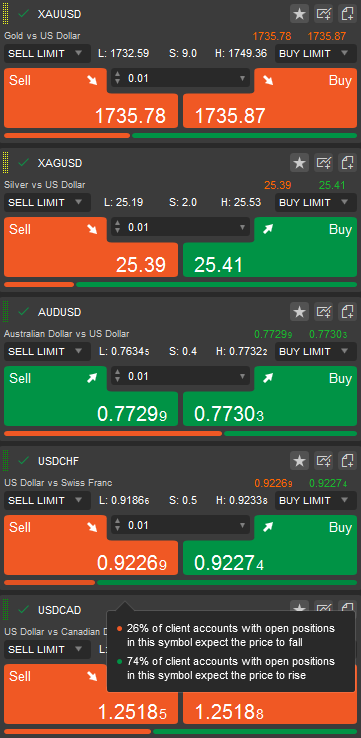
It is viewable in expanded Watchlist view, in the separate Symbol Window, on the chart (right below the quick trade buttons), and in the Symbol tab to the right of the charts. The orange line represents the shorts, the green one represents the longs; a tooltip with percentage values is shown if you move the mouse pointer over the sentiment lines. Here is how it looks like in the Watchlist (after expanding the symbols):
FXCM
FXCM is another Forex broker that offers a sentiment indicator of its traders' positions — via the web-based version of its Trading Station 2.0 platform.
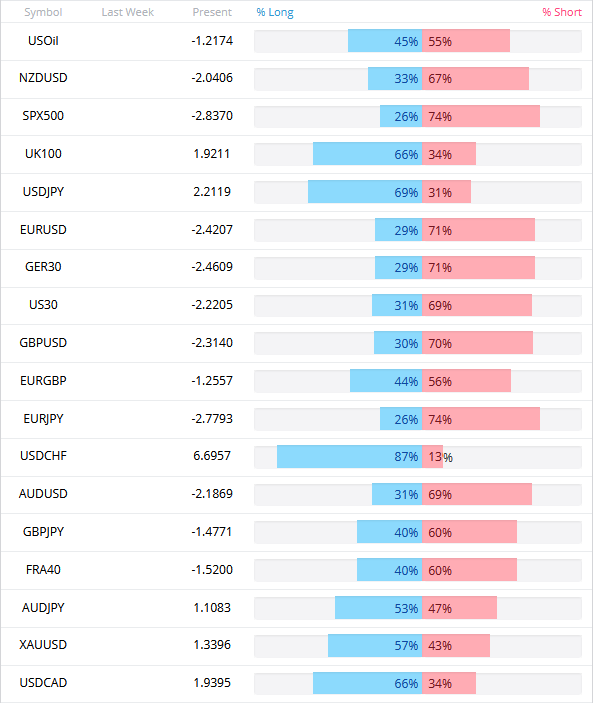
The sentiment indicator (called SSI) incorporates data on 18 trading instruments:
- 11 currency pairs: AUD/JPY, AUD/USD, EUR/GBP, EUR/JPY, EUR/USD, GBP/JPY, GBP/USD, NZD/USD, USD/CAD, USD/CHF, USD/JPY.
- 5 indices: SPX500, UK100, GER30, US30, and FRA40.
- 2 commodities: USOil and XAU/USD
Percentage values of long and short positions are listed for each instrument:
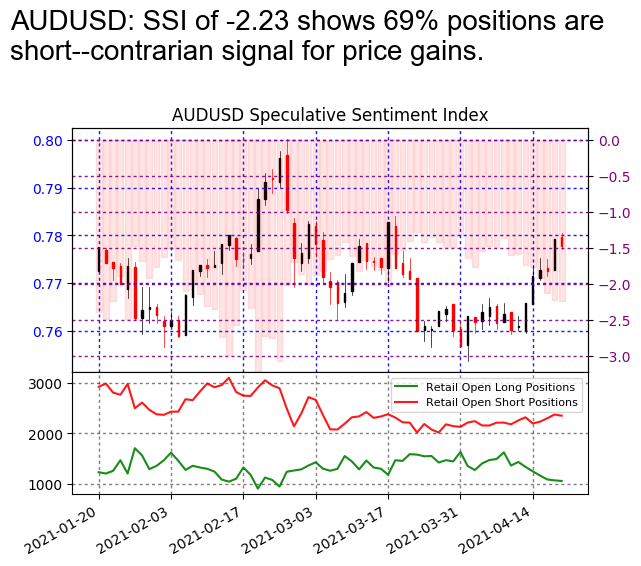
Additionally, each trading instrument gets updated with a detailed report featuring a chart of historical sentiment for the last 3 months:
Myfxbook
Myfxbook is a Forex social network that lets traders connect their trading accounts to receive advanced performance analysis as well as to showcase their strategies and expert advisors to potential followers. This lets sentiment indicators to be calculated over the data they possess about all participating traders.
In addition to the basic long/short ratios, the retail sentiment page on Myfxbook also shows the symbol popularity which holds information both about the number of positions and about the total volume of those positions. Moreover, you can see the average distance of the short trades from their opening price (how deep in loss/profit they are on average) and the same information for the long trades too. Registered and logged in users can also subscribe to email notifications for sentiment indicators changing for specific trading instruments.
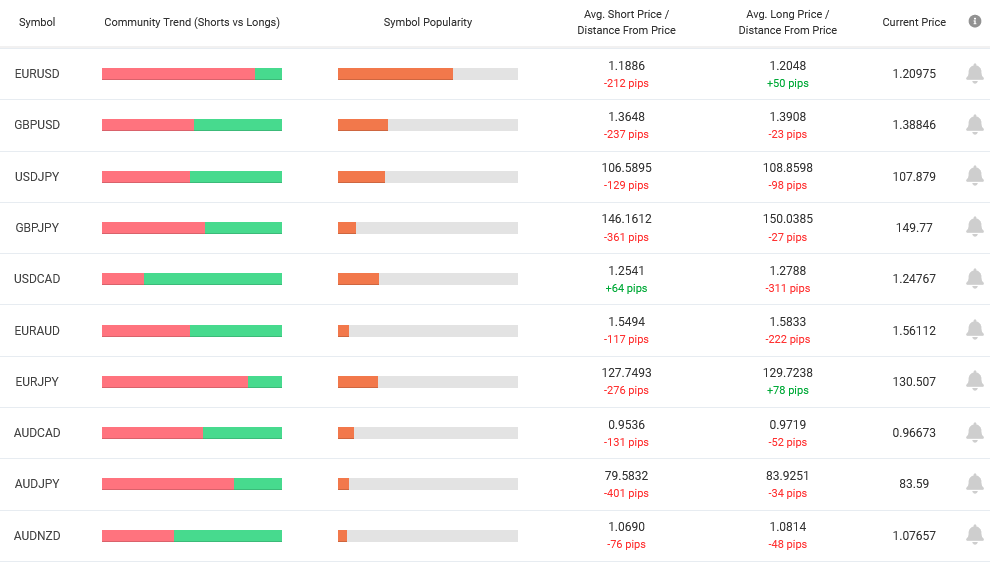
The list of the supported trading instruments is very extensive and currently includes 74 symbols: AUDCAD, AUDCHF, AUDJPY, AUDNZD, AUDSGD, AUDUSD, CADCHF, CADJPY, CHFJPY, CHFSGD, EURAUD, EURCAD, EURCHF, EURCZK, EURGBP, EURHUF, EURJPY, EURMXN, EURNOK, EURNZD, EURPLN, EURSEK, EURSGD, EURTRY, EURUSD, EURZAR, GBPAUD, GBPCAD, GBPCHF, GBPJPY, GBPMXN, GBPNOK, GBPNZD, GBPSEK, GBPSGD, GBPTRY, GBPUSD, NOKJPY, NOKSEK, NZDCAD, NZDCHF, NZDJPY, NZDUSD, SEKJPY, SGDJPY, USDCAD, USDCHF, USDCNH, USDCZK, USDHUF, USDJPY, USDMXN, USDNOK, USDPLN, USDRUB, USDSEK, USDSGD, USDTHB, USDTRY, USDZAR, XAGAUD, XAGEUR, XAGUSD, XAUAUD, XAUCHF, XAUEUR, XAUGBP, XAUJPY, XAUUSD, XBRUSD, XPDUSD, XPTUSD, XTIUSD, ZARJPY.
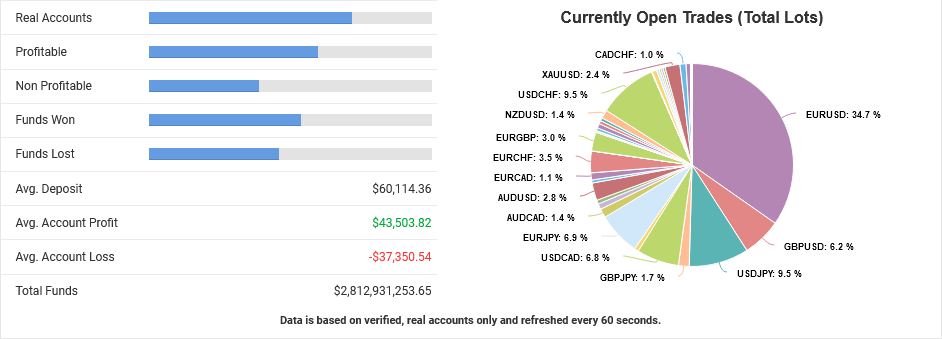
At the bottom of the trading instruments list, you can see the pie chart of open interest for all currency pairs (with evident EUR/USD domination) and you can also check total numbers for total profitable and unprofitable trades, average deposit size, average account profit/loss, as well as some other statistics:
But there is more! You can click on any of the trading instruments listed and go to the instrument's dedicated sentiment analysis page, which, among other things, features a historical sentiment chart:
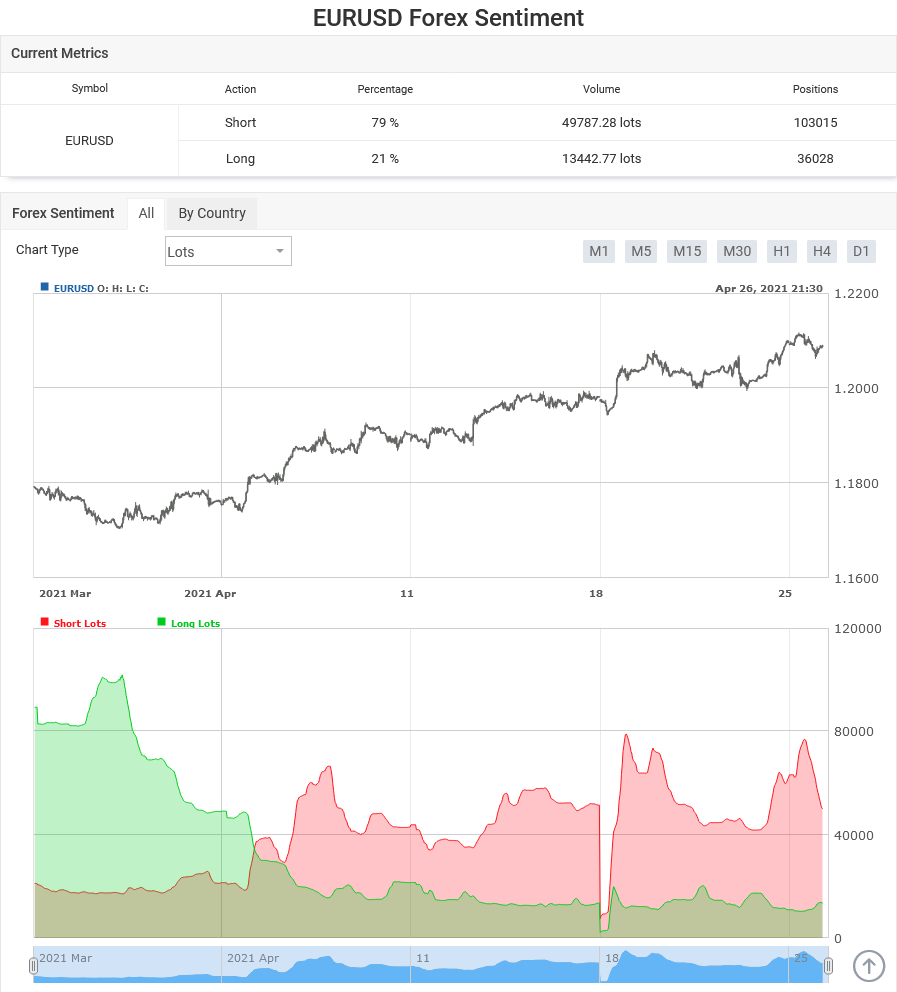
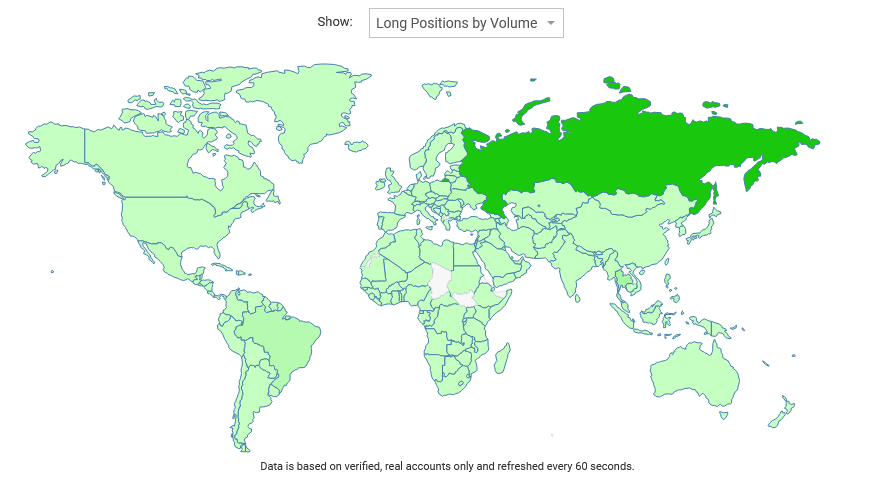
The chart is scalable and you can change timeframes. You can also switch it from Lots to Positions. Additionally, a Forex sentiment by country can be viewed on a world map. However, this information is of dubious value.
The detailedness of the sentiment data provided by Myfxbook is astounding. The only problem is that it comes from traders who voluntarily connected their account to the service, which might result in a rather biased sample of the retail FX trading population.
Conclusion
The choice of retail Forex sentiment is quite large nowadays. If you are interested in using it in your trading decisions, you can test the suitability of each of the presented sources or you could combine them all (by calculating average values for example).
From the point of view of the number of features, Myfxbook seems to be the leader here. However, their sentiment indicators could be poisoned by Potemkin village accounts created fraudulent signal sellers in a collusion with unscrupulous brokers.
If you need representativeness of a wider population of traders, then information from such huge brokers as Oanda and IG (DailyFX) should be your priority.
If you would like to share your own methods of gauging the current sentiment of the currency traders or discuss any of the tools mentioned above, please feel free to use our Forex forum for this.