Pivot Points
Pivot points can be controversial because there are so many competing versions. The core concept is to use a summary of the current period’s High, Low, and Close to project support or resistance for the upcoming period. Pivot points are a rough-and-ready forecast that some analysts name a “leading indicator,” although they do not actually “indicate” anything except a set of arbitrary projections. Moreover, pivot points lack the nuance of indicators that measure the close against the high or the close against the high-low range. However, as in all things technical in Forex, if a high proportion of traders use pivot points and if they are all deriving the same or similar projections, pivot points have the capacity to become a self-fulfilling prophecy.
A virtue of pivot points is that once they are charted based on past numbers, they do not change, and so you can watch the price action develop compared to the pivot point projections, which are drawn as horizontal lines off the last close. In equities, it is common to use the H-L-C of the previous week to create pivot points for the upcoming week, but in faster-moving Forex, traders may use yesterday’s H-L-C for the current period or the H-L-C of the first four-hour period for trading on a one-hour basis. You can imagine endless combinations.
The arithmetic for the standard pivot point is straightforward, but at least five versions of pivot points can be found, each tweaking the arithmetic a little. The classic formula starts with the Primary Pivot Point, or P, which is High + Low + Close divided by 3.

The Fibonacci version of pivots points uses Fibonacci numbers to project support and resistance:


DeMark Pivot Points were devised by Tom DeMark, who has invented many other indicators, many of them embraced by hedge fund leaders. The DeMark version makes the important point that it really does matter if the close is over the open or below it when calculating pivots. DeMark inserts a new factor named X:


At least three other versions of pivot points can be found, and beware — many of the websites that offer to calculate pivot points for you do not disclose their exact formula. You can probably safely assume that these sites are using the classic version. An exception is our pivot points calculator, which allows you to enter price data and derive pivot points using four different methods, including DeMark, complete with the formulas.
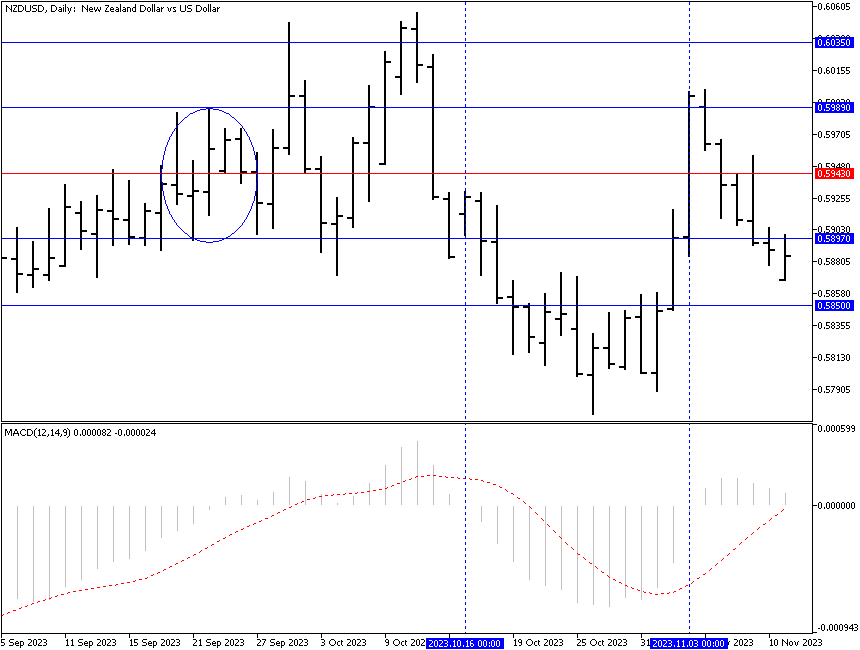
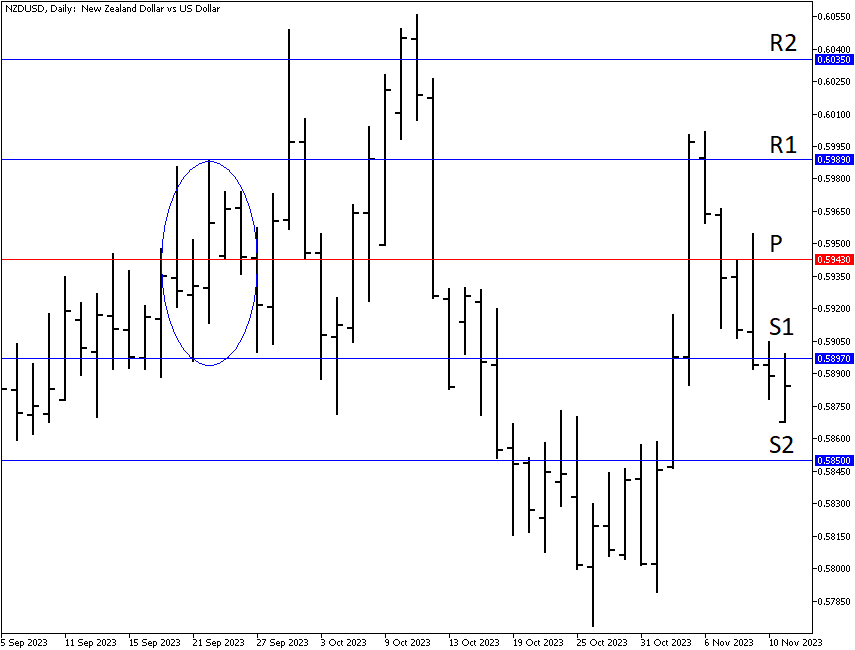
See the chart below, which shows the DeMark support and resistance levels for the 5-period prices in the circle projected out into the future. The first price high manages to break R1 resistance, but not the close. This is an important point — some analysts say that breaking support or resistance by any part of the bar is enough to call it a breakout, but Sperandeo is among the experts who say you must insist on the close breaking the line to call it a “breakout.” But in this instance, even after the price tested the resistance level the second time and managed to stay above it for a couple of days, it crashed afterward. Notice that the price wavered and hesitated for three days before the breakout. This suggests that more than one trader was looking at the exact DeMark level. The same happened after the price bounced and then fell again - it hesitated for three days before decisively moving below the support level.
In this instance, the data used is five periods of data (in EUR/USD), and it took over twenty periods for the final true breakout to occur. This is the final virtue of pivot points — they can serve as an anchor to prevent impulsive, gut-feel trades until the evidence is really in.
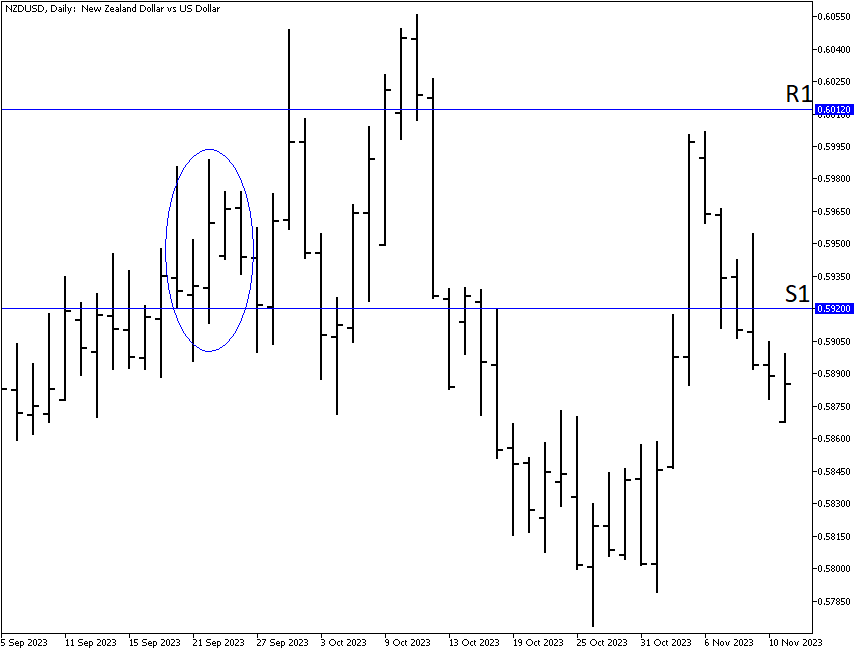
Now see the next chart, the classic pivot point calculation (named the “floor pivot points”). The same data is used as in the DeMark example. Notice that the somewhat lower R1 is broken during the first move up, but the price manages to stay above it only for one day. During the second rally, the price breaks above the second resistance level (R2) but stays above it again only for one day. And yet again, the same thing happens during the bounce - the price rises above the first resistance level but stays above it only for a single day. As for support levels, the price fails to break the first level (S1) during the initial correction and hangs near it after the crash for a few days before moving to the second support level (S2) and stalling there for a time.
And therein lies a problem. If you were to put all the various pivot point calculations on a single chart, you would be paralyzed by indecision. Which one is “correct”? Well, all of them and none of them. There is no single right answer — there is just the calculation methodology that syncs with your risk appetite and degree of discipline. For example, the DeMark version would have you going short at a higher level (1.37418) than the classic “floor” version (1.36857 for S1).
How do you choose? Pivot points should be used in conjunction with other indicators that suit your trading style. If we add MACD to the classic pivot point chart, for example, we get a sell signal two days after the price breaks the pivot point itself. See the next figure below. You could use that breakout for an initial entry and the breakout of S1 and S2 to scale into a bigger position. After the price reverses its movement, the MACD sends a buy signal on exactly the same day as the price breakes above the pivot point itself.