One way you can visualize volatility for a currency pair in Forex is to plot the Standard Deviation indicator on your chart.
In this guide, we will explain exactly what the Standard Deviation indicator is, how to calculate it, what it shows you, and how you can use it while you are trading.
What is the Standard Deviation indicator?
The Standard Deviation indicator is exactly what it sounds like. It is an indicator that uses the standard deviation to tell you how far prices are deviating from the mean.
You probably are already at least somewhat familiar with standard deviations. If you ever took a statistics class, you likely had a unit that explored them.
Standard deviations can be low or high:
- If a standard deviation is low, that means that the data points have a narrow range and are generally close to the mean.
- If a standard deviation is high, that means that the data points have a wide range and at least some data points may be farther from the mean.
Another term for the mean is "expected value."
A familiar image may be springing to mind of what is called a "bell curve." This is a kind of probability distribution that assumes most values will be close to the average, with fewer values being outliers. The bands are each 1 standard deviation. It is also called a "normal distribution."
When you plot the Standard Deviation on your chart, you will not be looking at a bell curve. You will simply see a line that shows Standard Deviation rising and falling based on what is happening with price.
Key point:
The Standard Deviation indicator tells you how close or far prices are ranging from the average price of an asset.
How is the Standard Deviation indicator calculated?
Here is the formula that you can use to calculate the Standard Deviation:
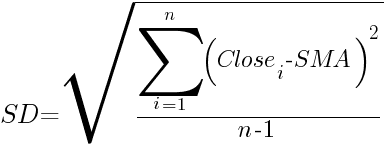
You do not have to do this math yourself. Your platform will take care of it.
Key point:
A Simple Moving Average is used in computing the Standard Deviation.
What does the Standard Deviation indicator show?
What you are seeing when you look at the Standard Deviation indicator is the market's volatility. This will be intuitive to many traders given that they may already be familiar with the math involved in calculating standard deviations. Here is how to interpret the indicator:
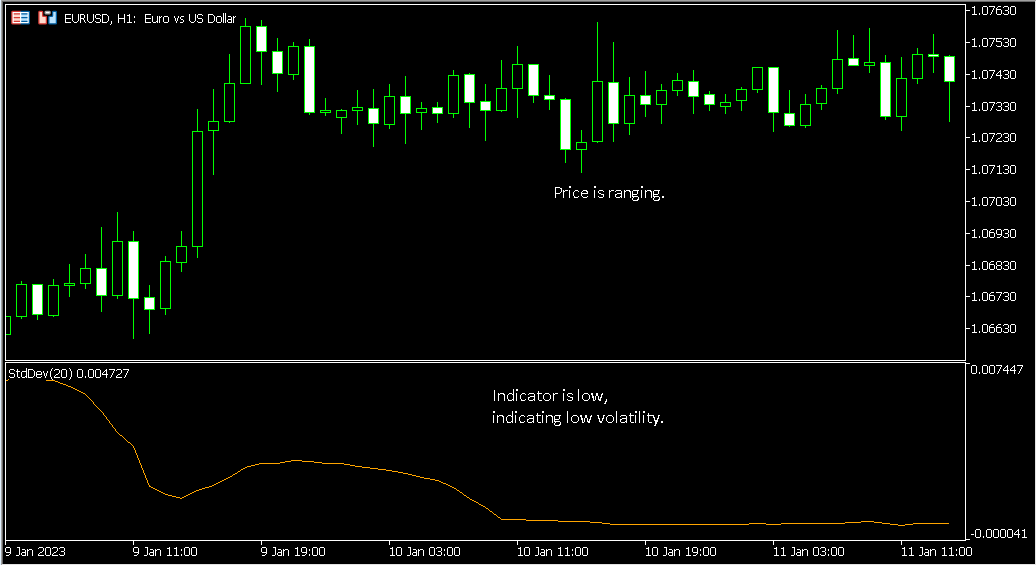
- When the indicator value is low, that means that volatility is low.
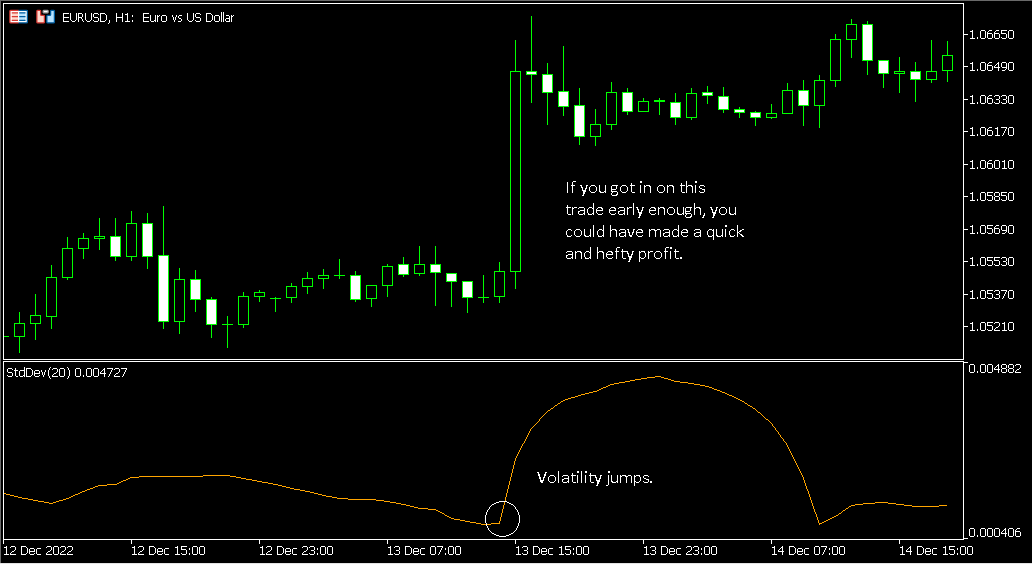
- When the indicator value is high, that means that volatility is high.
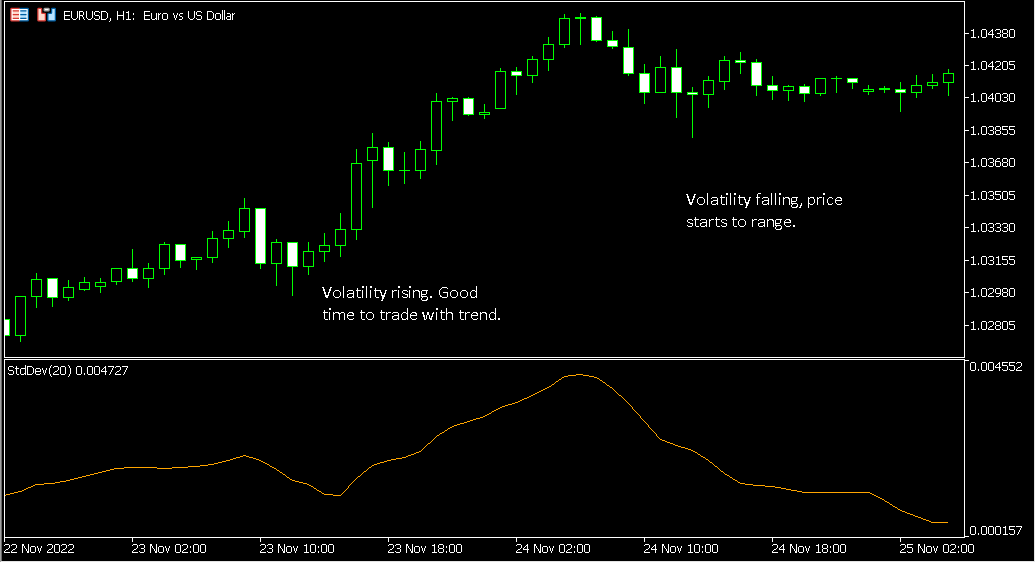
- When the indicator is somewhere in between, that means volatility is as well.
When looking at market tops and bottoms, the Standard Deviation helps you get insights into the mindsets of traders.
If volatility is increasing at a market top or bottom, you are seeing excitement among traders. But if you see volatility decreasing at a market top or bottom, that means the bull or bear market is maturing, respectively.
Key point:
By looking at the Standard Deviation, you can visualize the volatility of the markets and the mindsets of traders.
How to plot the Standard Deviation indicator on your charts
In just a few quick clicks, you can add the Standard Deviation to your charts. Here is how to do this in MT4:
- In the top menu, click on Insert->Indicators->Trend->Standard Deviation.
- You can now set your parameters. By default, the period is 20, the moving average used is Simple, and it is applied to the close. Use the defaults or make any changes you want, and then click on OK.
The indicator will now be plotted on your chart.
Key point:
MT4 makes it fast and easy to plot the Standard Deviation indicator.
How to use the Standard Deviation indicator while you trade
Since the Standard Deviation indicator helps you visualize volatility, it can aid you in figuring out what types of strategies are applicable to the market conditions you are looking at.
- When Standard Deviation is low, you will notice that prices are typically ranging. You could consider a reversion-to-mean strategy in a situation like this.
- When Standard Deviation is high, it may be time to try some trend trading strategies. Just watch out, because high volatility can sometimes involve dangerous whipsaws.
Key point:
Use the Standard Deviation indicator to assess the current state of the market. Different trading strategies may be appropriate depending on whether volatility is high or low.
General tips for using the Standard Deviation indicator
- The Standard Deviation indicator can provide valuable context, but you will need to incorporate other indicators or price action to make it part of a trading method. It does not generate trade ideas on its own.
- Traders sometimes like to plot the Standard Deviation indicator along with the volatility indicator Bollinger Bands. Moving averages can also be handy in conjunction with either or both of these indicators.
- Be sure to test whatever strategies you develop that use the Standard Deviation indicator in demo mode before you go live with real money.
Key point:
The Standard Deviation indicator can offer context on your charts, but it is just one possible ingredient in a successful trading method.
Conclusion
The Standard Deviation can help you visualize volatility. If you have been looking for a simple, clear, and intuitive way to visualize volatility in the foreign exchange market, the Standard Deviation indicator will help you out. The context it provides can assist you to make your trading methods more effective.