There are lots of free spreadsheet journals already available online and there are quite a few professional stand-alone or web-based logging solutions. However, there are lots of reasons to prefer the simplicity and versatility of an Excel spreadsheet. Meanwhile, its customizability means that the journal only calculates and shows the stuff that you need the most.
The resulting trading journal unites approaches to logging three different macro-strategies — chart pattern trading, news trading, and fundamental analysis trading. It allows easy customization (most non-essential columns can be hidden if they aren't needed) while also providing an in-depth analysis of the trades. The only serious disadvantage such a journal has is slow performance because Excel, albeit a great software, does lots of unnecessary calculations each time you change something in a spreadsheet.
Features
Here are some of the features of the trading journal that you can download further below:
- A Welcome sheet with some basic information (you can safely delete it after reading).
- A Currency Pairs sheet that serves to put in your currency pair settings for quick referencing and for decimal place counts. You can ignore it, but then you won't be able to benefit from decimal places formatting; also you won't be able to just enter a small number instead of typing in the entire currency pair name each time.
- The number of pips for profit and loss is calculated automatically.
- A Commission column that can also be used to record rebates if you receive them from your broker.
- A Swap column to record the swaps you pay or get from the broker.
- An Analysis sheet to provide detailed analysis of your trading performance.
- Scalpers and intraday traders wouldn't probably need some of the columns (Close date or Swaps for example) but they would maybe want to track the trade length.
- You can hide Entry, SL, TP, Exit Price fields completely and just enter pip and $ gains/losses manually if they are more relevant to your strategy than exact price levels.
- Only first 1,000 rows are filled with formulas. If you hit the limit, just copy and paste formulas from the final row as far down as you need. However, the more filled rows you have, the slower the journal will work. It is recommended to create a new trading journal file for each new year (or for each new month if you are scalping).
Explaining the columns
Let's look at the example journal that has been filled with some random trades.
The first columns include: a trade number (clear it when logging non-trading transactions), open date (you can change it to time if it is more relevant to your trading strategy), strategy (the reason for entry), number of the currency pair (you define it via the Currency Pairs spreadsheet), currency pair name (you can enter it manually or have it filled automatically after you fill the currency pair number), trade direction (the choice of Long/Short).
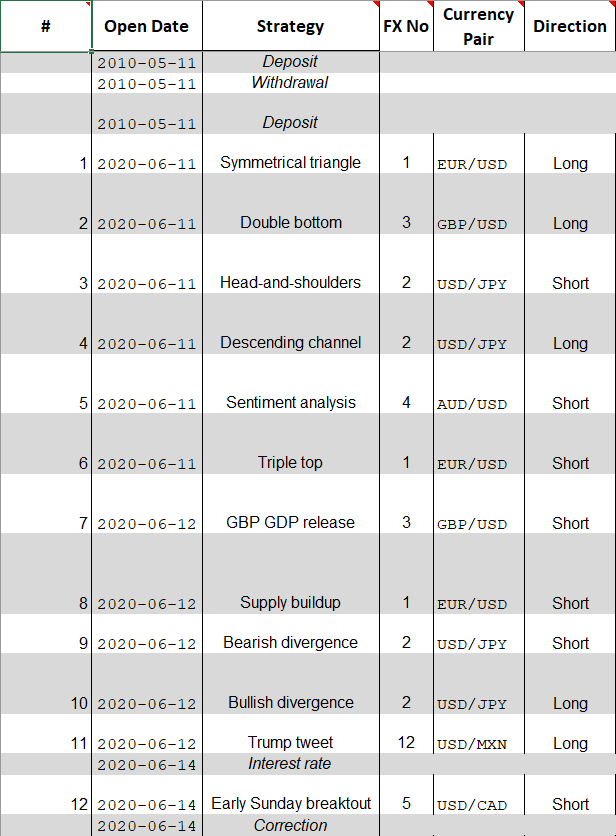
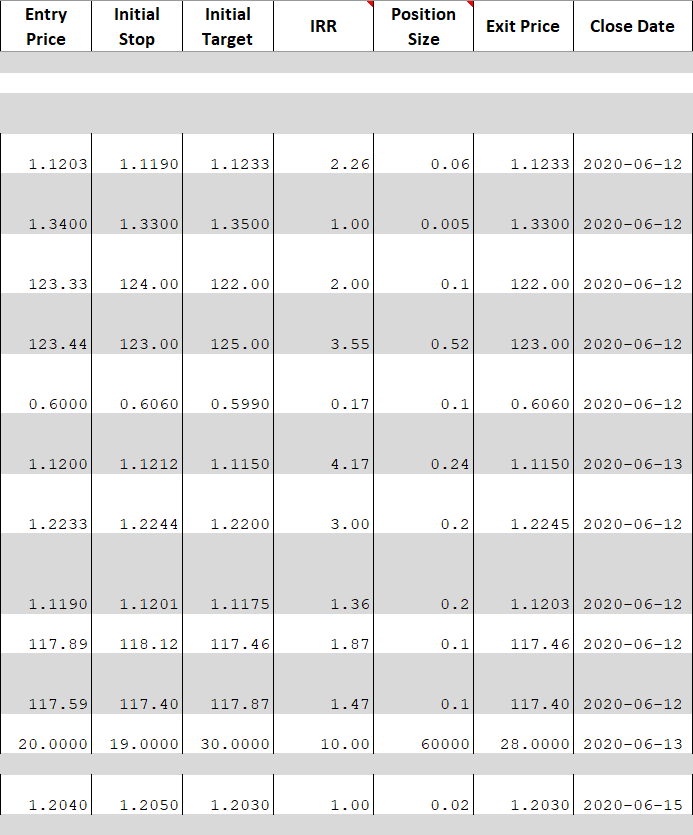
Then follow the price-related parameters of the trade: entry price, initial stop-loss, initial take-profit, IRR (initial risk-to-reward ratio), position size (you can enter it in lots or in units, or you can just hide the column if you don't want to recored this parameter), exit price, close date.
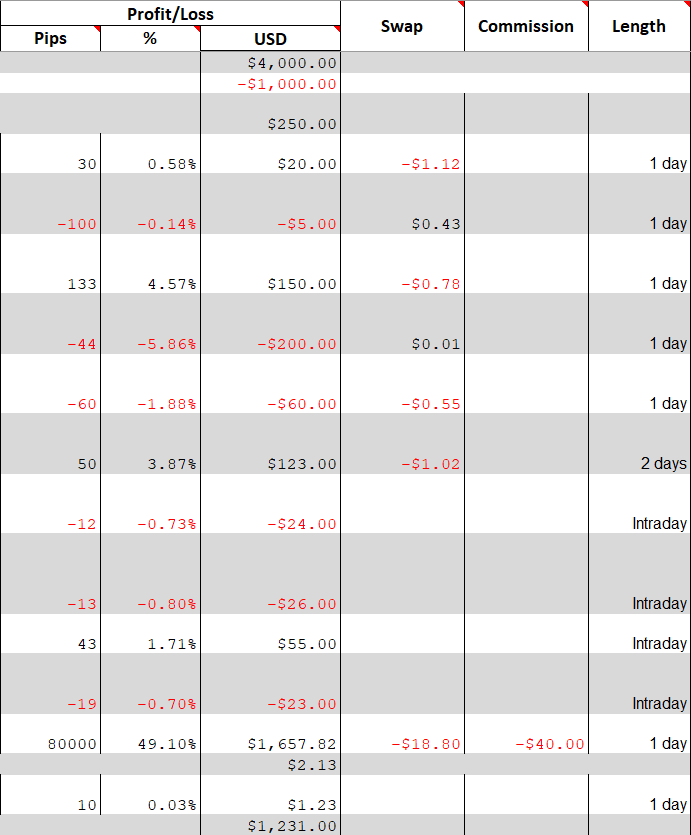
After that, you notice the columns that mostly involve the post-trade stuff: profit/loss in pips (calculated automatically based on the difference between the entry and exit price, and the decimal places defined in the Currency Pairs sheet), profit/loss in % (calculated automatically using the currency profit you enter and your previous account balance), profit/loss in USD (you can change the currency name to whatever you use), swap, commission, trade length (it can be either Intraday or the number of days between the entry and the exit).
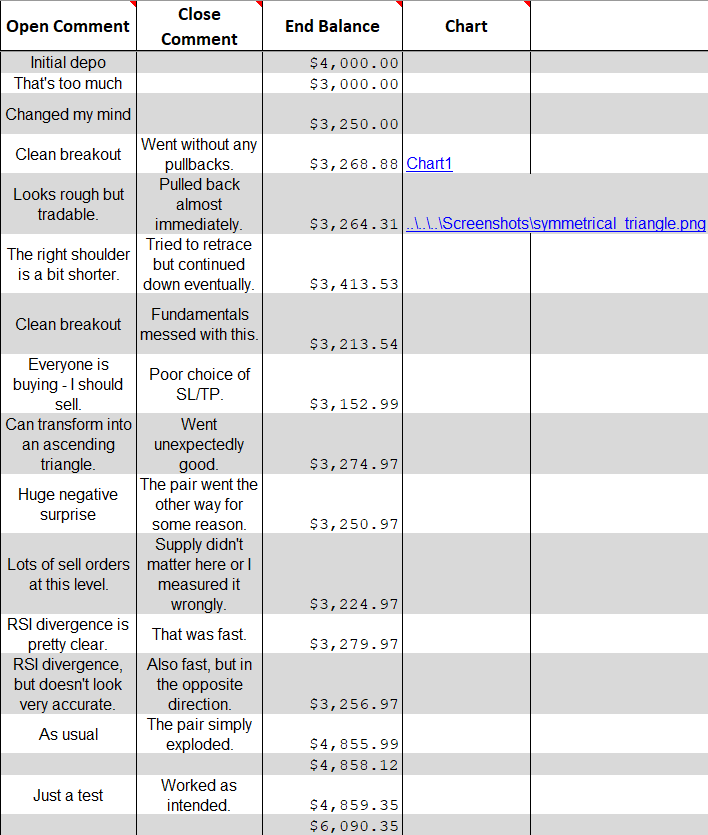
The final columns of the trading journal include: open comment (what you had thought about the trade when you just opened it), close comment (what you think about the trade after closing it), end balance (calculated automatically), chart link (you can insert a link to a local file on your computer, or a URL to some website where you store your trading screenshots, or you can hide this column entirely).
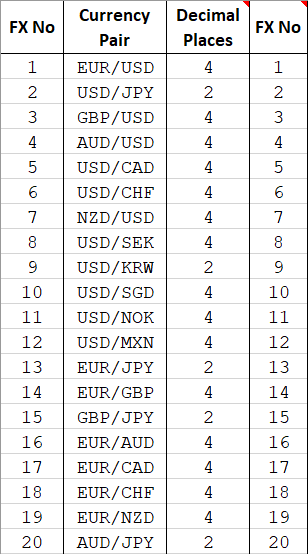
Currency Pairs sheet
This is where you define your currency pairs with a quick reference number and a number of decimal places. There are two number fields but the second one is filled automatically when you enter something in the first one. The second column is required for technical reasons:
Analysis
The Analysis sheet becomes the most interesting one after you log some trades. It lets you analyze your performance using a number of metrics and charts.
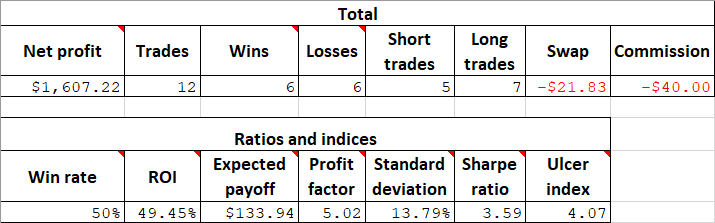
Metrics
First, come the various basic metrics (totals) and the ratios/indices: net profit (shows your total net profit, which is probably the most important result to look at), trades (for a total number of trades), wins, losses, short trades, long trades, swap (total swap for all trades), commission (total commission paid for all trades), win rate (number wins divided by the total number of trades), ROI (return on investment — how much you would increase/decrease a starting balance in percentage term), expected payoff (how much you can expect to earn/lose from one trade on average), profit factor (how much your winning trades are bigger than your losing trades), standard deviation (the volatility of your returns), Sharpe ratio (how your ROI compares to the volatility of your returns), Ulcer index (how much negative volatility is in your returns).
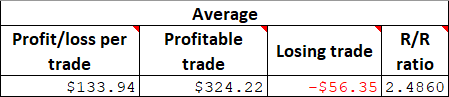
Then follow the metrics of averages: profit/loss per trade, profitable trade, losing trade, R/R ratio (average risk-to-reward ratio):
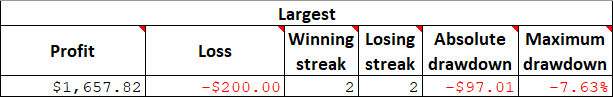
The table ends with the columns that show the metrics of the "maximum" parameters of your strategy: profit, loss, winning streak (longest sequence of uninterrupted profitable trades), losing streak (longest sequence of uninterrupted losing trades), absolute drawdown (how much your balance declined below its starting point), maximum drawdown (largest peak-to-through percentage decline).
Charts
The Analysis sheet also features two charts:
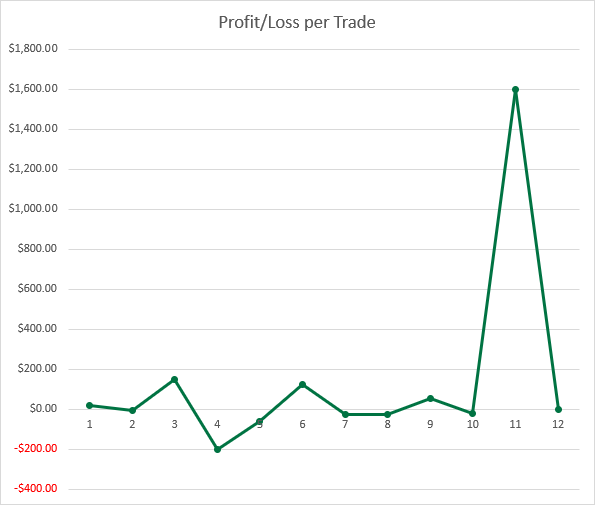
Profit/loss per Trade
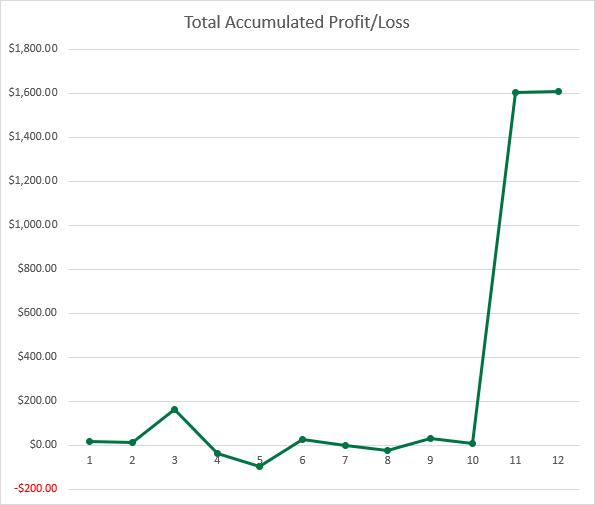
Total Accumulated Profit/Loss
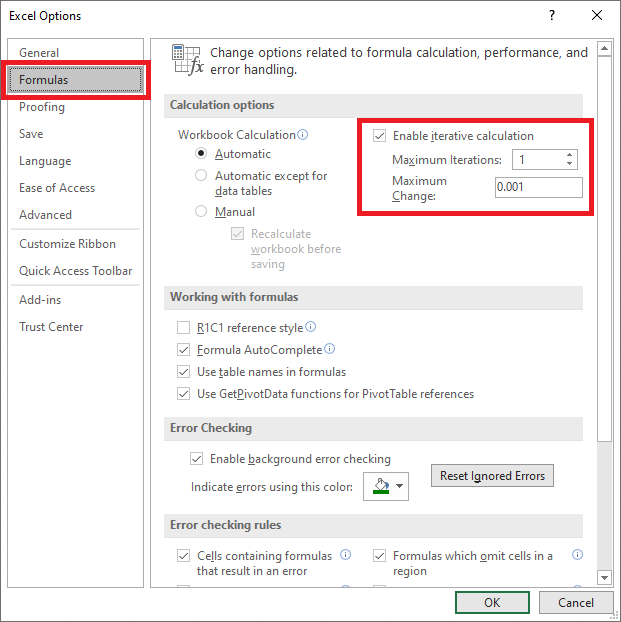
Important note: Enable iterative calculations via File->Options->Formulas. Otherwise, you won't able to reference currency pairs both by their name and number. You can set the maximum iterations value to 1:
If you have any suggestions or if you find any bugs in this Forex trading journal spreadsheet, please report them on our forum.
Changelog
3.2 — 2023-06-25
- Fixed Long/Short trades headings in the Analysis sheet.
- Fixed an error in currency pair formulas on lines 15-18.
3.1 — 2023-06-15
- Fixed an error in ROI formula.
- Fixed some errors in descriptions.