RSI Multi-Timeframe (MTF) Indicator for MT4/MT5
Relative Strength Index (RSI) oscillator is a very popular indicator among traders. Here you will find a free download of MT4/MT5 RSI Multi-Timeframe (MTF) indicator and a detailed explanation on how to use it in MetaTrader 4 and MetaTrader 5 to make it help your trading.
What is RSI oscillator?
RSI oscillator is a momentum indicator. Traders have been using the RSI for a very long time and even so, it is still very popular.
Being a momentum indicator, the RSI is useful to understand if a trend is getting exhausted.
The RSI is the result of the comparison of the price over a specific period of time.
The value of the indicator fluctuates between 0 and 100.
How to use RSI oscillator?
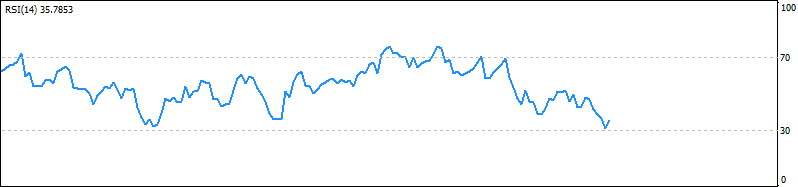
As was mentioned before, the values of RSI are ranging between 0 and 100. When studying this indicator you usually consider the following:
- RSI above 70 means that the trading instrument is overbought, so it will probably retrace or consolidate.
- RSI below 30 means that the trading instrument is oversold, so it will probably rise or consolidate.
While these are common behaviors for the oscillator, there can also be exceptions. In fact, in case of a strong trend, the RSI can remain in the overbought or oversold area for an extended period of time.
RSI oscillator indicator for MetaTrader
MetaTrader includes the RSI oscillator indicator by default. The indicator is available in the Oscillators section.
Since there is no alert options, we created RSI with Alert for MT4 and MT5 — an enhanced version of the indicator so that you could receive notifications when the price is oversold or overbought.
RSI Multi-Timeframe indicator for MetaTrader
When you do technical analysis, it is sometimes easy to forget to check the big picture.
Often, we focus on a specific chart and timeframe and we do not consider what is happening on a larger scale.
This can also happen when working with the relative strength index indicator.
We might be checking the value on an M30 chart and it looks oversold. However, checking the same on an H4 chart, it is perhaps in an overbought area.
To help with such situations, you can use RSI Multi-Timeframe (MTF) indicator for MetaTrader.
This indicator makes it easy to view the RSI oscillator in all selected timeframes.
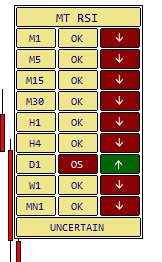
A small table shows the value of the indicator and its recent trend for each timeframe in the same chart.
How to use RSI Multi-Timeframe for MetaTrader?
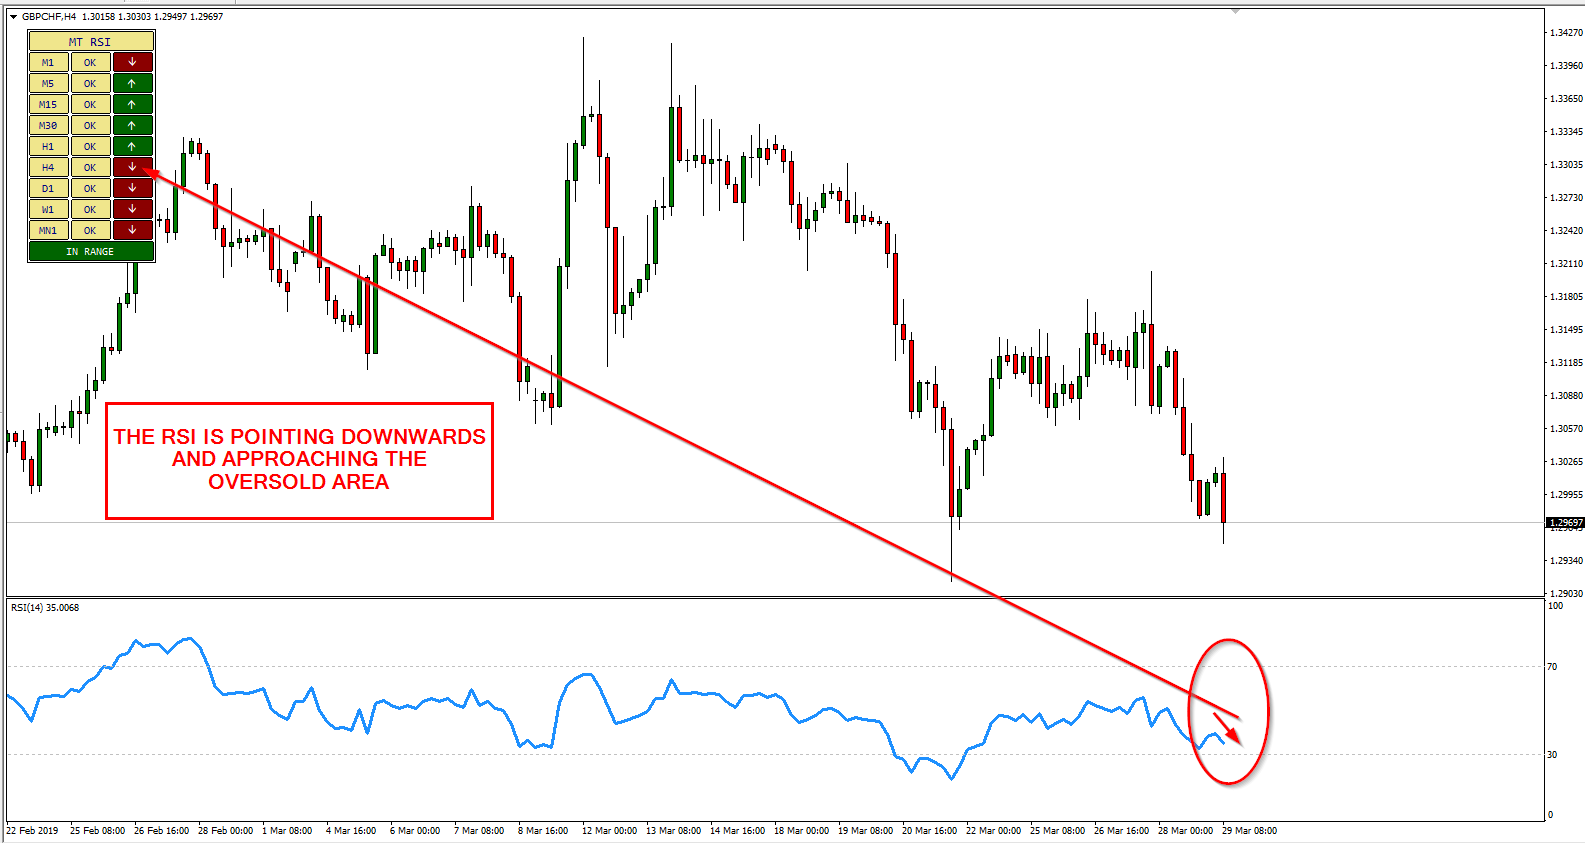
RSI Multi-Timeframe indicator for MetaTrader 4 and MetaTrader 5 can show you whether the relative strength index is currently in an overbought or oversold area in all of the chosen timeframes.
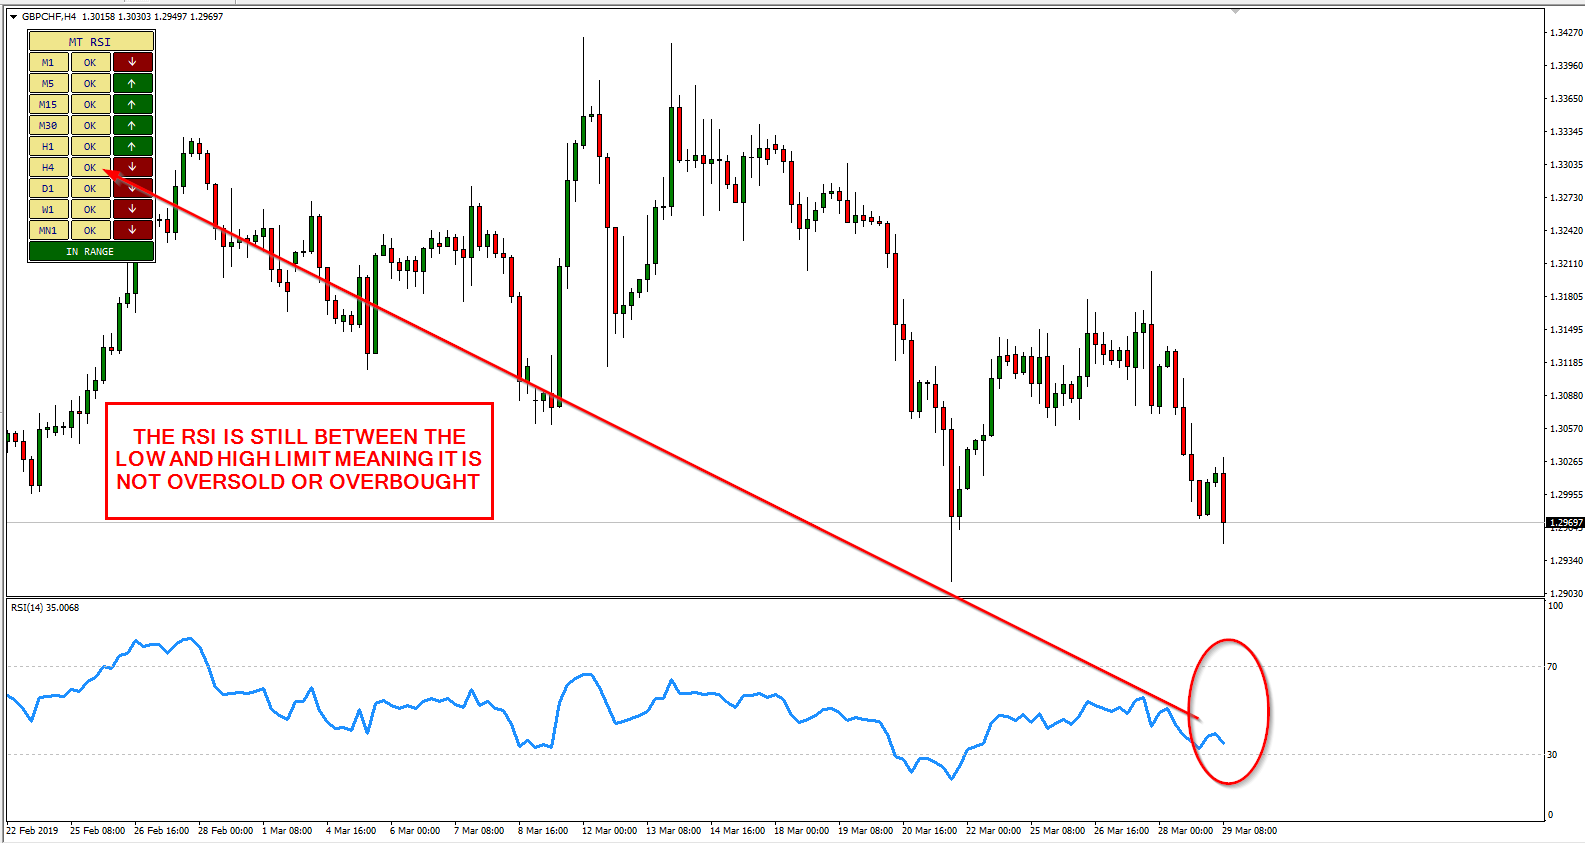
At the same time, the indicator can show you the line's trend if it is higher or lower than its value on the previous bar.
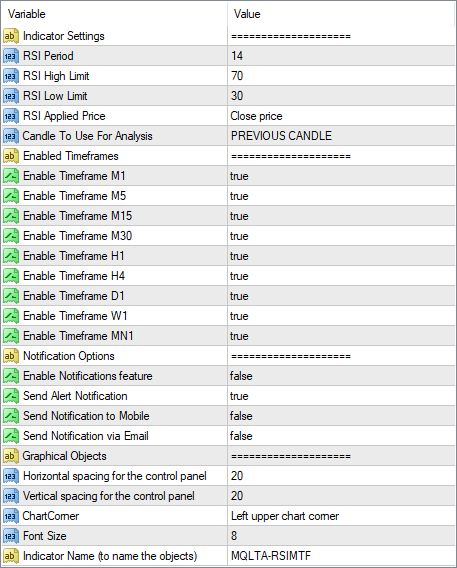
The indicator includes the following features:
- Alert when all the timeframes are in the same area.
- Notification if there is a change in the status, going overbought, oversold, or back to the range.
- Selection of the timeframes — you can decide to include or ignore specific timeframes.
- Notifications to mobile, email, and on screen.
Download (ver. 1.04, 2024-08-16)
You can download for free MT4/MT5 RSI Multi-Timeframe indicator with the link below and install it by following the provided instructions.
The installation is very easy to perform and it is a very simple indicator use.
Once you run the indicator, you can set RSI parameters, select timeframes, and configure alerts via its input parameters.
MT4 RSI MTF indicator installation
To install the MT4 RSI Multi-Timeframe indicator, please follow the instructions below:
- Download the indicator archive file.
- Open the MetaTrader 4 data folder (via File→Open Data Folder).
- Open the MQL4 Folder.
- Copy all the folders from the archive directly to the MQL4 folder.
- Restart MetaTrader 4 or refresh the indicators list by right-clicking the Navigator subwindow of the platform and choosing Refresh.
For a more detailed instruction on how to perform the installation and a tutorial video please visit this page.
MT5 RSI MTF indicator installation
To install the MT5 RSI Multi-Timeframe indicator, please follow the instructions below:
- Download the indicator archive file.
- Open the MetaTrader 5 data folder (via File→Open Data Folder).
- Open the MQL5 Folder.
- Copy all the folders from the archive directly to the MQL5 folder.
- Restart MetaTrader 5 or refresh the indicators list by right-clicking the Navigator subwindow of the platform and choosing Refresh.
Conclusion
Even if the RSI oscillator is an old indicator, it is still quite popular today.
It is a momentum indicator that can help traders spot overbought and oversold situations and act accordingly.
RSI Multi-Timeframe indicator for MetaTrader allows you to see the status of the oscillator in all of the timeframes in your MT4 or MT5 platform. This way, you can have a better understanding of the overall technical situation in the market that you analyze.
You can open a trading account with any of the MT4 Forex brokers to freely use the presented here indicator for MetaTrader 4. If you want to use an MT5 version of the indicator presented here, you would need to open an account with a broker that offers MetaTrader 5.
If you would like to see other multi-timeframe indicators, you can read our guide on MTF indicators.
Discussion
Do you have any suggestions or questions regarding this indicator? You can always discuss RSI Multi-Timeframe with the other FX traders and MQL programmers on the indicators forums.
Changelog
1.04 — 2024-08-16
- Added the MT5 version of the indicator.
- Added panel scaling on hi-DPI screens.
- Added an option to select the chart corner for the panel.
1.03 — 2021-08-26
- Revised the alert system to make more concise and timely.
- Removed unnecessary input parameters to reduce confusion.
- Reduced object processing overhead, which could cause excessive consumption of computer resources.
- Pruned the source code to make the indicator lighter and future development easier.
- Fixed a bug that caused weird symbols to appear in the panel in place of the up and down arrows.