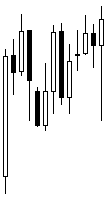
Almost all Forex analysts, mentors, and common traders speak in terms of the Japanese candlestick charts. When they present an example chart, it usually comprises small candles with weird lines and colors. A person not acquainted with the Japanese candlestick bars can be easily confused with such charts. That is why it is important to understand this most popular chart data representation. You have probably already seen something like this:

In the image, you can see a Japanese candlestick chart fragment consisting of 13 bars, of which 6 are bearish and 7 are bullish.
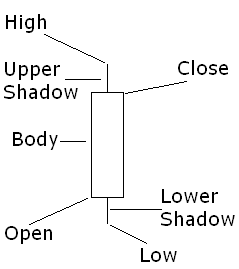
Each Japanese candlestick bar has a set of parameters that characterize the price in a given time period. Let's have a look at a bullish candlestick bar:

As you see, there are following parameters:
- High — the highest price during the period, which this bar is representing.
- Low — the lowest price during the period.
- Open — the price at the beginning of the period.
- Close — the price at the end of the period.
- Body — the part of the candle that stretches from Open to Close price levels. The length of the body is calculated as
Close − Open . - Upper Shadow — the part of the candle that stretches from Close to High. The length of the upper shadow is calculated as
High − Close . - Lower Shadow — the part of the candle that stretches from Open to Low. The length of the lower shadow is calculated as
Low − Open .
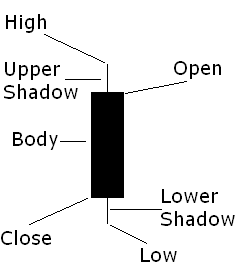
A bearish candlestick bar is similar to its bullish counterpart but has some differences:

As you can see, it is of an opposite color and the Open/Close levels are inverted compared to a bullish candlestick bar. The parameters of the bearish candle are the same but are calculated differently:
- High — the highest price during the period, which this bar is representing.
- Low — the lowest price during the period.
- Open — the price at the beginning of the period.
- Close — the price at the end of the period.
- Body — the part of the candle that stretches from Open to Close price levels. The length of the body is calculated as
Open − Close . - Upper Shadow — the part of the candle that stretches from Open to High. The length of the upper shadow is calculated as
High − Open . - Lower Shadow — the part of the candle that stretches from Close to Low. The length of the lower shadow is calculated as
Low − Close .
Now you know the basics of the Japanese candlestick charting and you can easily interpret the charts that are represented by candlestick bars. Japanese candlesticks are a great tool to use in trading, and the charts that are built on them are very easy to read. Additionally, many Forex traders find it easier to build strategies using such charts.