Elliott Wave Analysis by EWF

Newmont Mining (NEM), the world’s largest gold producer, remains a pivotal asset in the resource sector and a key proxy for broader precious metals trends. Its price action has consistently reflected both macroeconomic cycles and investor sentiment toward gold, while its Elliott Wave structure highlights the potential for sustained bullish momentum.

Newmont Monthly Elliott Wave Chart​

NEM-Monthly20260427082708.jpg


Newmont Mining (NEM) continues to demonstrate a robust bullish trajectory, underscored by its monthly Elliott Wave structure. The chart signals an impending breakout that could propel the stock toward fresh record highs. Historically, NEM completed wave ((II)) of the Grand Super Cycle in September 2000 at $12.75. From that base, wave (I) advanced to $62.72 before wave (II) corrected sharply to $15.39. The ongoing wave (III) is unfolding as a nested impulse, with wave I reaching $86.37 and wave II retracing to $29.42. As long as the price action remains above the critical $15.39 level, the broader bullish structure stays intact, reinforcing expectations of sustained upside momentum in the periods ahead.

Newmont Daily Elliott Wave Chart​

NEM-Daily20260427082857.jpg


The daily Elliott Wave analysis of Newmont Mining (NEM) underscores a well‑defined impulsive structure. Following the completion of the wave II correction at $29.03, the stock transitioned into wave III,. From that low, wave (1) advanced to $58.72 before wave (2) retraced to $36.86. Subsequently, wave (3) extended sharply to $134.88, while the corrective wave (4) concluded at $94.34. Although a break below $94.34 could imply a double correction, this scenario appears less probable given the impulsive nature of the rally from wave (4). As long as the critical $29.03 support level holds, NEM maintains strong potential to continue its advance within the broader wave III structure.

Source: https://elliottwave-forecast.com/vi...iott-wave-structure-signals-extension-higher/
 
Hello traders and welcome to a new blue box article where we discuss recent trade setups. In this one, the spotlight will be on USDCHF.

USDCHF has been a traditionally bearish market since the turn of the millennium. It has exhibited a series of lower lows and larger highs within larger bearish cycles and smaller bearish sub-cycles. From the pre-2022 highs, the pair plunged to its low in August 2011. From that low, it recovered in the next 5 years to complete a corrective cycle in December 2016. Meanwhile, from the peak of 2016, it plunged again and has remained in a bearish cycle. On our weekly chart shared with members, we expect the bearish cycle from the December 2016 high to continue below the August 2011 low. Amid this massively bearish market, we continue to sell the bounces from the blue box on all timeframes, especially on the daily, H4, and H1 charts.

We recorded the most recent trade in late March. Following the pair's breach of the September 2025 low, we alerted members through live analysis sessions, the live trading room, and our weekend and daily videos. We clearly communicated our intention to sell bounces from the blue box, which our members easily followed. They understood the pair's direction and how to profit from it. Recognizing our preference for selling, they patiently awaited the blue box, which indicates entry and stop-loss placement.

USDCHF Elliott Wave Analysis: 3.25.2026 Trade Setup

usdchf


On March 25, 2026, after a failed 7-swing bounce, we alerted members with a chart showing a 15-swing corrective bounce emerging higher. The chart also showed the blue box, where members were encouraged to short. We also listed this as a priority trade in the live trading room, including entry, exit, and target prices for shorts. Members set up their pending orders to trade.

USDCHF Elliott Wave Analysis: 4.23.2026 Trade Update

usdchf


As the chart above shows, the pair triggered the blue box, and the price fell sharply. We shared the charts with members on April 23, 2026. The sharp fall hit our first target, allowing members to book partial profit and lock the rest of the trade at the break-even price. It was a clean setup. Going forward, the decline from the late March high should develop into a 5-wave structure. We may see a correction this week before more downside follows.

Source: https://elliottwave-forecast.com/forex/usdchf-plunges-beneath-blue-box/
 
The whole market is on edge. Over the past year, we have seen tariffs, geopolitical conflict, and oil prices skyrocket. All of this has created a high level of uncertainty and fear across global markets.

At ElliottWave-Forecast, we do not focus heavily on fundamentals or news-driven events. Instead, we believe markets are primarily driven by large institutional participants—market makers with sufficient capital to move price. While news is often used to justify moves after the fact, price action itself tends to follow a structured path.

Over the years, we have been able to anticipate major turning points across multiple markets, including the current environment. We have consistently communicated to our members that a correction across risk assets was likely, even though it is impossible to predict which specific global event would be used to explain the move. As expected, the correction unfolded, allowing our members to reposition and buy risk again at favorable levels.

Here is our text about $YM_F explaing what to expect in 2026 :

Dow Futures (YM) weekly Elliott Wave chart suggests the advance from the April 7, 2025 low is completing a 5-wave impulse. The cycle should likely finish in the first quarter of 2026, leading to a significant corrective pullback in 3, 7, or 11 swings. Provided the 36,634 pivot remains intact, the correction should hold support and pave the way for further gains.

Dow Futures (YM) Weekly Elliott Wave Chart​

INDU-WEEKLY20260114201851-1024x525.jpg


Our methodology is unique. We combine Elliott Wave Theory, pivot systems, correlations, sequences, and extensions to build high-probability forecasts. The “Blue Box” (High-Frequency areas) has consistently identified buying opportunities in instruments such as the S&P 500 (SPX), Gold, and the NASDAQ—levels we shared in advance with our members.

Gold (XAUUSD) Daily Elliott Wave Chart​

2XAU-DAILY20260328152706-1024x508.jpg


Nasdaq (NQ) Daily Elliott Wave Chart​

NQ-F-Daily20260329061348-1024x512.jpg


SPX Daily Elliott Wave Chart​

SPX-DAILY20260328125258-1024x508.jpg


Today, we will focus on Copper (HG_F), which is showing particularly important price action at the Grand Super Cycle degree. This structure suggests the potential for one of the strongest accelerations in risk assets we have seen in years.

Many traders and analysts may disagree with this view, which is expected. Different methodologies lead to different conclusions. While Elliott Wave analysis can be subjective in interpretation, its core rules are not. The three fundamental rules have zero tolerance for violation:

1) Wave 2 cannot retrace beyond the start of Wave 1
2) Wave 3 cannot be the shortest wave
3) Wave 4 cannot overlap Wave 1

These rules provide a strict framework that, when applied correctly, removes ambiguity from the broader structure. (For reference: https://elliottwave-forecast.com/elliott-wave-theory/)

Looking at Copper on the monthly timeframe, we identify a completed cycle in 2011, labeled as wave (I), followed by a corrective wave (II) ending in 2016. From the 2016 lows, the market produced a clear five-wave advance into March 7, 2022, which we label as wave I, followed by a correction into the 2022 lows as wave II.

Copper (HG) Monthly Elliott Wave Chart​

2HG-WEEKLY20260425220259-1024x508.jpg

Since then, price action has developed into a highly overlapping structure. By nature, this could initially be interpreted as either a wave ((V)) or the beginning of a new impulsive sequence. However, applying Elliott Wave rules more strictly provides clarity.

One key observation is that the cycle from 2016 is the shortest among the three primary cycles. As a result, the current structure—being longer and more complex than the 2016 cycle—cannot be labeled as a wave ((V)). Instead, it strongly suggests a nesting structure (a series of first and second waves), which typically precedes powerful impulsive moves.

This has important implications. Nesting structures at higher degrees often lead to explosive market behavior as multiple wave degrees align. In this context, Copper is signaling that the broader risk market may be preparing for a significant advance in the months and years ahead.

While some instruments may appear confusing or contradictory in the short term, Elliott Wave Theory—when applied through its core rules—provides a consistent directional bias. From this perspective, Copper (“Dr. Copper”) is pointing toward higher prices and, by extension, continued strength in risk assets.

The conclusion is straightforward: the right side remains to the upside. Rather than reacting to headlines or short-term noise, we focus on structure, rules, and price behavior. We trade what the market is doing—not the story built around it.

Copper is showing the path, and risk assets are likely to follow.

Source: https://elliottwave-forecast.com/stock-market/hg_f-cooper-dr-cooper-is-calling-risk-on/
 
Shopify's (SHOP) stock has been experiencing a bit of a downturn recently, and investors are eager to see what the second and third quarters of the year will hold. Analysts expect that the company will focus on refining its e-commerce tools and expanding its merchant solutions. Consequently, there’s a sense of cautious optimism that these efforts might help stabilize the stock's performance.

In addition, as we move further into the year, investors are keeping an eye on how macroeconomic trends will impact the broader e-commerce sector. Therefore, Shopify is likely to adapt its strategies to maintain a competitive edge. Altogether, these elements could influence the stock's trajectory and shape how it performs in the upcoming months.

Elliott Wave Outlook: SHOP Daily Chart December 2025

Elliott Wave Outlook: SHOP Daily Chart December 2025


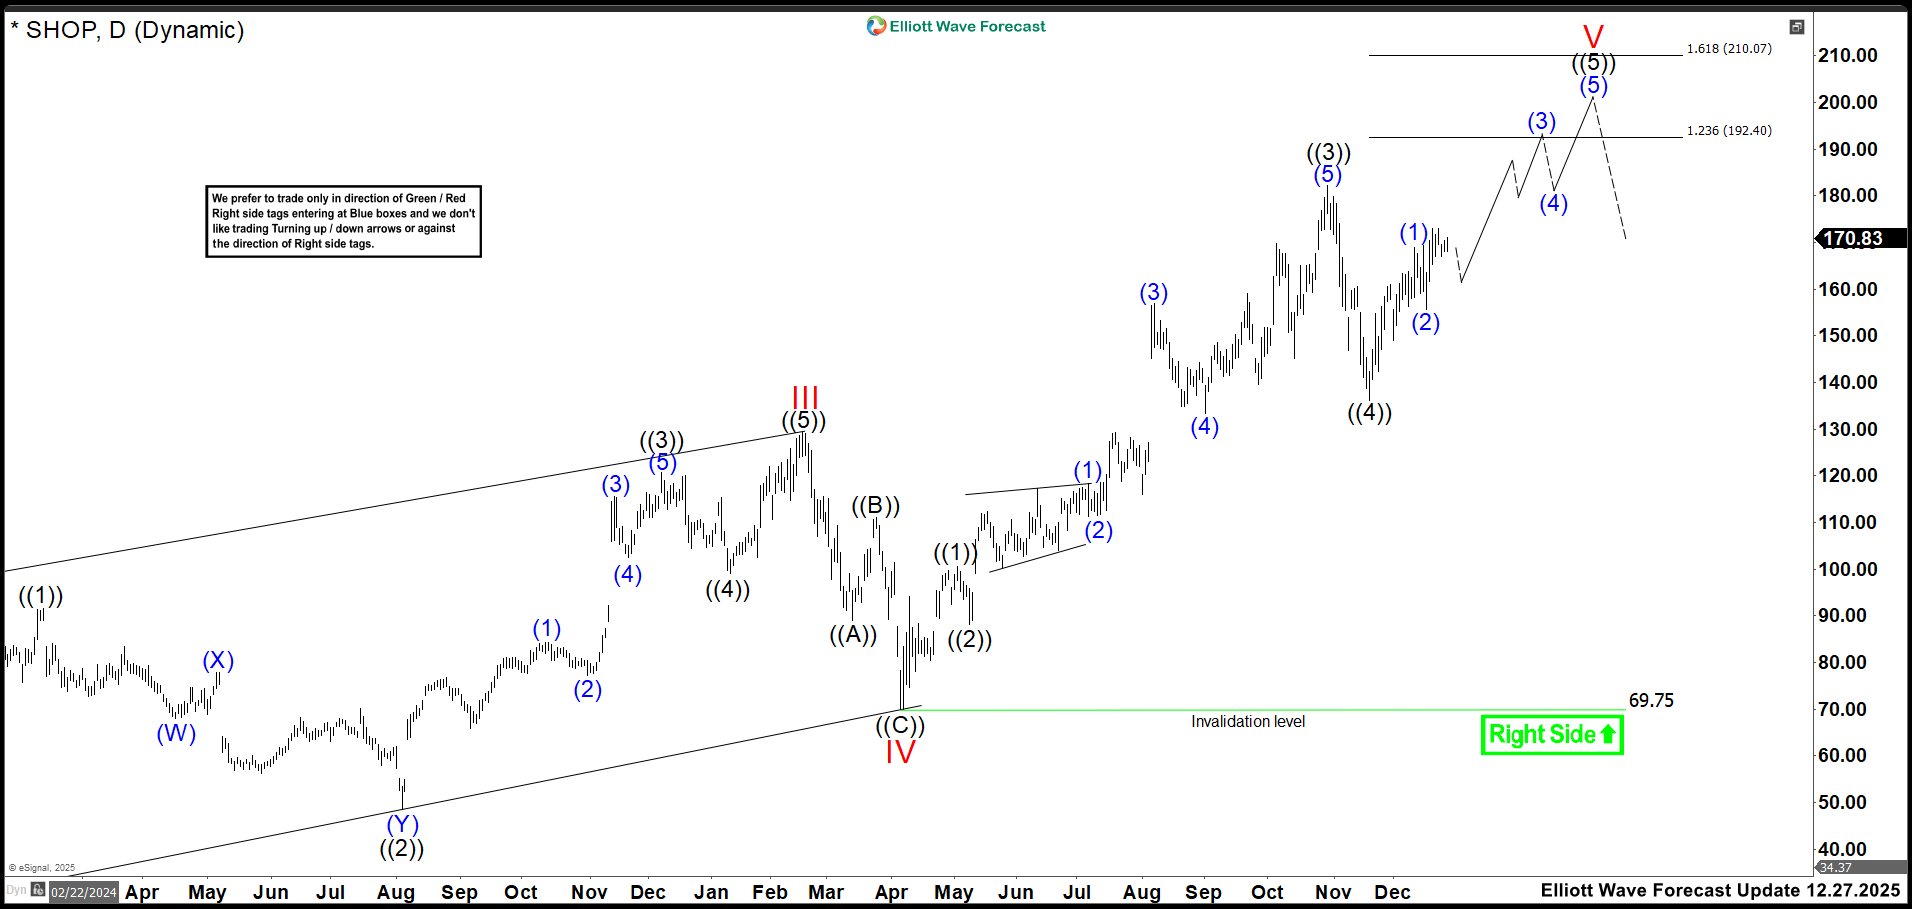
Last update, we showed that price resumed its advance in wave (5) of ((3)) after completing wave (4). Then, it hit a high of 182.19 in October and corrected sharply, dropping 25% to 136.18. Afterward, we expected the market to build an impulse as wave ((5)) of V to complete the cycle from November. This move could reach the 192.40–210.07 zone, where strong selling pressure may appear.

Therefore, the strategy remained simple and consistent: buy the dips until price reached the next zone. Additionally, we planned to evaluate the reaction once price touched that area. The outlook stayed valid as long as the market held above the wave (4) low.

Elliott Wave Principle Behind the Market Structure​

Impulse

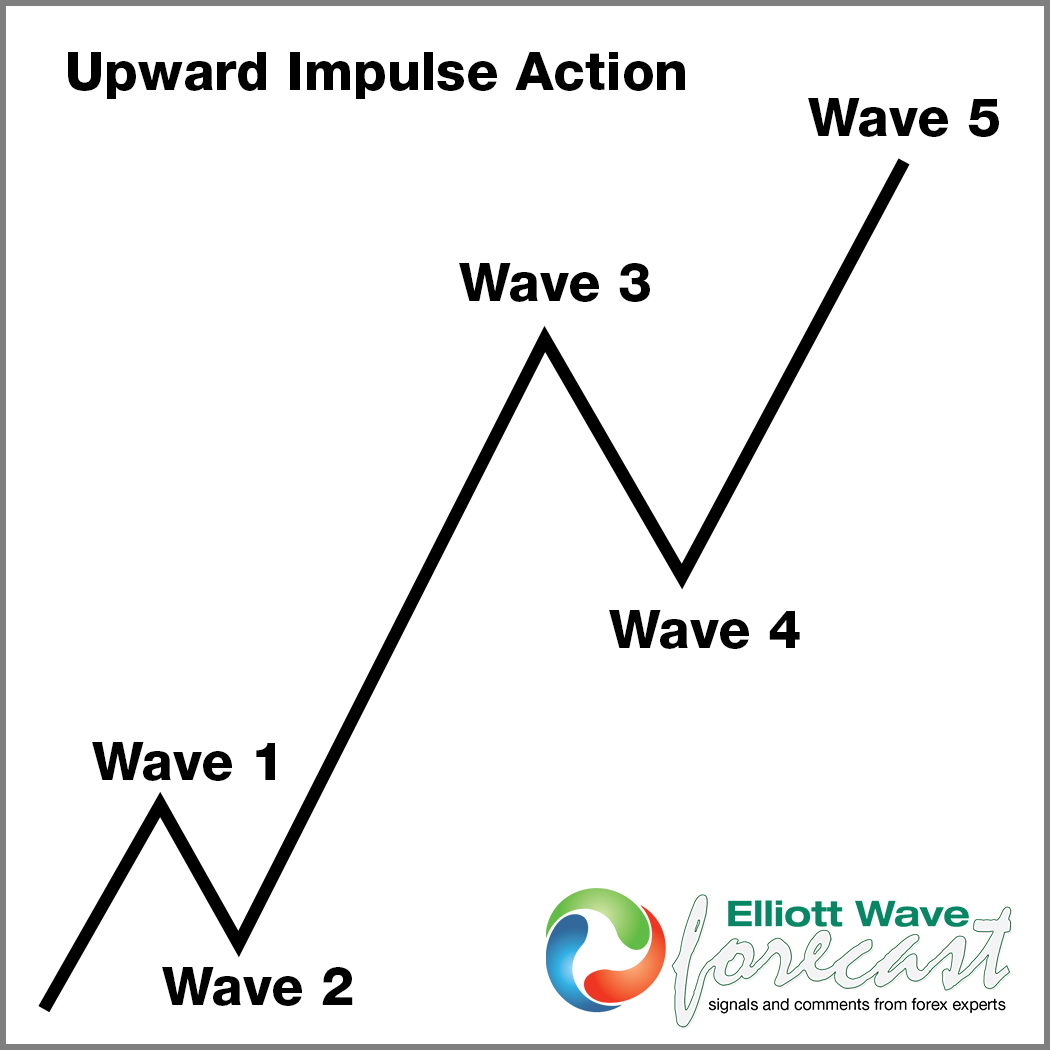
An impulse is a clean 5‑wave pattern that drives the trend forward.

  • Waves 1‑3‑5 are strong and directional.
  • No overlap between waves 1 and 4.
  • Wave 3 is usually the strongest.
  • Structure is clear, with increasing momentum.
Elliott Wave Principle Behind the Market Structure


Elliott Wave Outlook: SHOP Daily Chart April 2026

Elliott Wave Outlook: SHOP Daily Chart April 2026
In this new update, the market continues lower and breaks the possible wave ((4)), suggesting the end of the cycle in SHOP. Therefore, we adjust the impulse as shown in the chart. Wave ((3)) ended at 169.69, and wave ((4)) ended at 151.30 before the final rally toward 182.69 to complete wave (I). Moreover, price action has already finished three waves lower as wave w and attempted a bullish reaction. However, the rebound shows weak traction, so the market may form a double correction as wave (II).

To confirm this view, price must break the February low and hold below it. Such action would confirm the double correction toward 60.44–42.20. Conversely, if the market breaks below 104.92 but price remains lagging, the correction may become truncated, and SHOP shares may continue the rally from the 90.00–70.00 zone. Consequently, price action after a break of the 104.92 low becomes extremely important.

Source: https://elliottwave-forecast.com/st...i-scenario-gains-strength-after-weak-rebound/
 
Bloom Energy Corporation., (BE) designs, manufactures, sells & install solid-oxide fuel cell systems for on-site power generation in the United States & globally. It offers Bloom Energy Server, a power generation platform to convert different fuels through electrochemical process. It comes under Industrials sector & trades at “BE” ticker at NYSE.

The BE favors rally in (1) of ((3)) after breaking the price channel from December-2025 low. It expects short term rally above $247.86 - $286.49 area to extend March-2026 rally. Buyers should wait for (2) pullback to get in as next opportunity. It rallied already more than 110% since March-2026 low.

In weekly, it made all time low of $2.44 in October-2019. It placed (I) at $44.95 high of February-2021 & (II) at $8.41 low of February-2024. Above there, it ended I of (III) at $147.86 high on 11.10.2025 high & II at $75.70 low on 12.17.2025. It placed ((1)) of I at $29.82 high, ((2)) at $15.15 low, ((3)) at $125.75 high, ((4)) at $88.23 low & ((5)) at $147.86 high. It ended (1) of ((3)) at $29.44 high, (2) at $24.04 low, (3) at $86.89 high, (4) at $61.37 low & (5) at $125.75 high. Below I high, it placed ((W)) at $76 low, ((X)) at $119.90 high & ((Y)) at $75.70 low as truncated move to end II correction.

BE - Elliott Wave Latest Daily View:​

BE-D4.jpg

Above II low, it ended ((1)) of III at $180.90 high & ((2)) at $116.51 low. Within ((1)), it ended (1) at $96.49 high, (2) at $84.14 low, (3) at $176.49 high, (4) at $131 low & (5) at $180.90 high. In ((2)), it placed (W) at $132.50 low, (X) at $169.09 high & (Y) at $116.51 low. It already broke to new high, favoring (1) of ((3)). It ended 1 of (1) at $141.56 high, 2 at $123.16 low, 3 at $229.55 high, 4 at $200.23 low & favors 5 to end (1). Above $200.23 low, it can extend into $247.86 – $286.49 area to finish (1). Buyers should wait for (2) pullback in 3, 7 or 11 swings against 3.30.2026 low for next long opportunity.

Source: https://elliottwave-forecast.com/stock-market/bloom-energy-be-favors-rally-in-to-247-8-286-5-zone/
 
Citigroup (NYSE: C) resumed its bullish trend despite an early correction this year. The stock broke again to new all-time highs. Today, we dive into its daily technical chart. Our analysis explores the Elliott Wave structure currently supporting the rally.
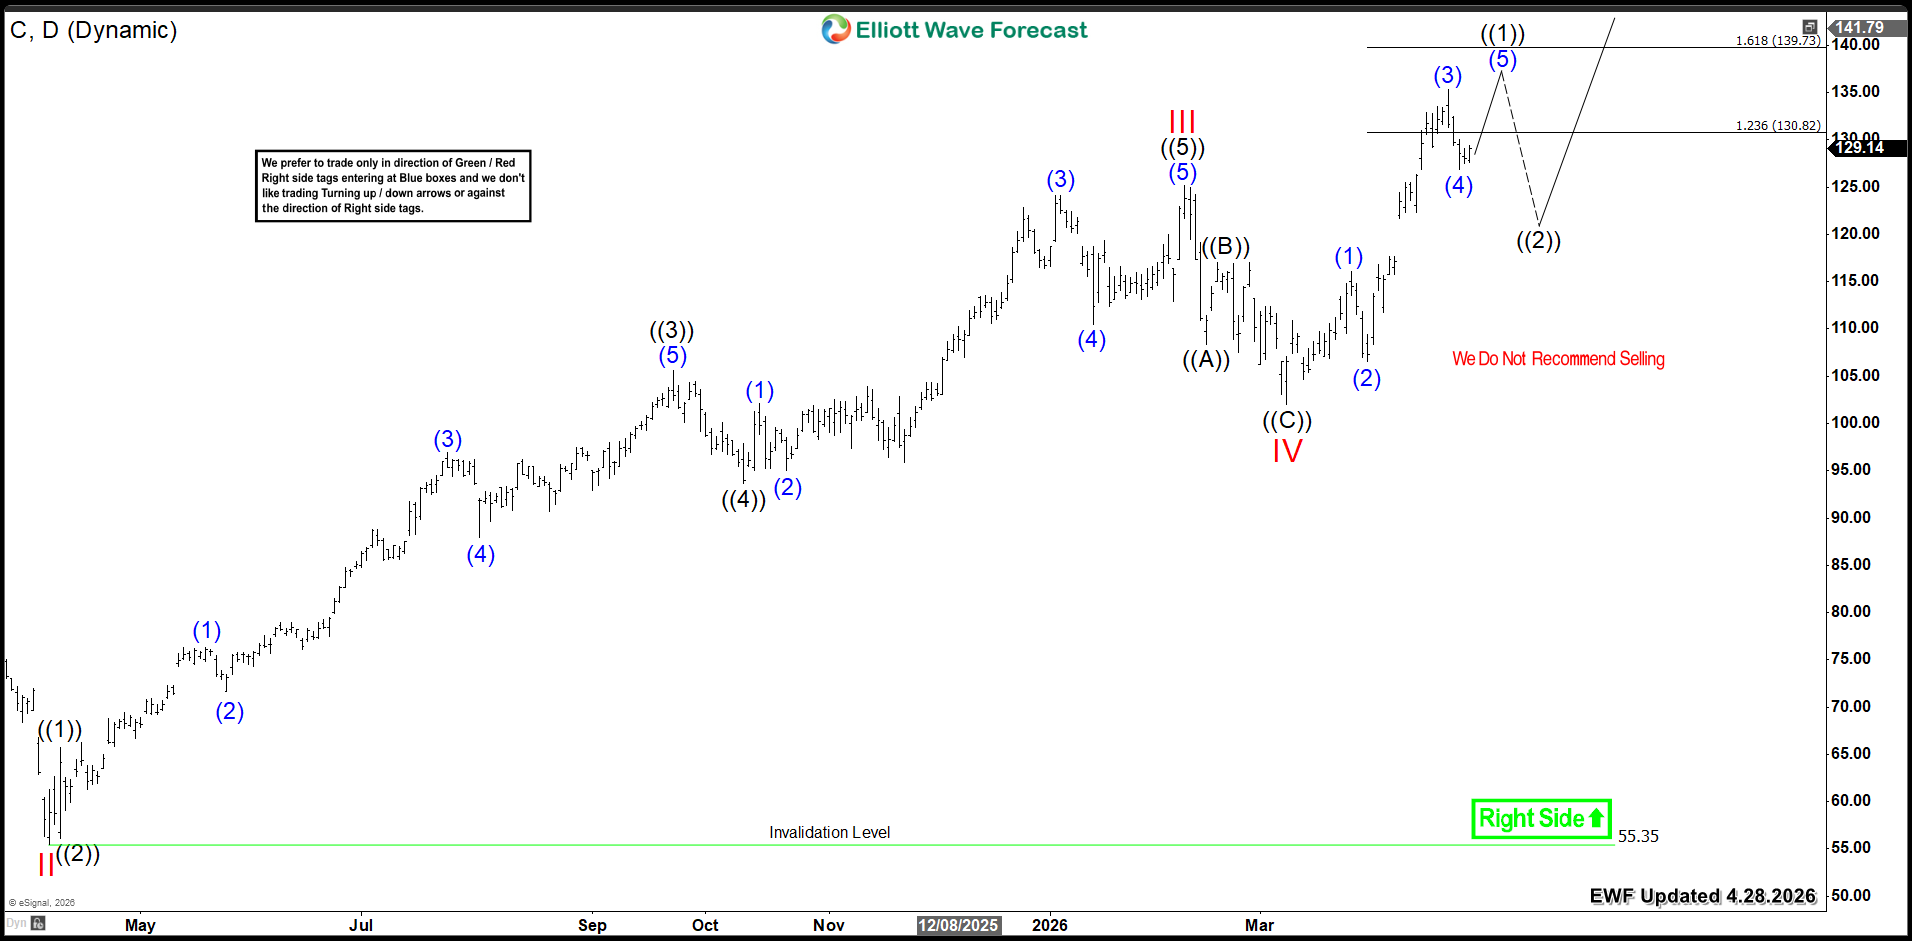
Looking at Citigroup's daily chart, the cycle from the 2025 low has ended. A five-wave advance marked wave III at $125. After that peak, the stock corrected lower in a zigzag structure. This wave IV pullback reached $102. From there, C resumed its rally to new all-time highs. Currently, it shows three swings higher from the March 2026 low. This suggests another move up before completing a five-wave advance.

The stock is trading within the $130−$139 inverted Fibonacci extension zone. C should end wave ((1)) at this target area. Then, a wave ((2)) pullback will occur. Price must remain supported above $102. Any pullback should attract buyers. This will allow the cycle to extend higher above $150.

Citigroup C Daily Chart 4.28.2026​

Citigroup C Daily Chart 4.28.2026

Conclusion​

Citigroup's (C) bullish cycle remains in progress as the stock is looking for further upside extension. Therefore, investors should target buying opportunities within daily pullbacks.

Source: https://elliottwave-forecast.com/stock-market/citigroup-c-bullish-path-above-150/
 
In this technical blog, we will look at the past performance of the 4-hour Elliott Wave Charts of NZDJPY. In which, the rally from 09 April 2025 low is unfolding as an impulse sequence. Therefore, called for more upside to take place. We knew that the structure in the pair should remains incomplete & should see more upside. So, we advised members not to sell the pair & buy the dips in 3, 7, or 11 swings at the blue box areas. We will explain the structure & forecast below:

NZDJPY 4-Hour Elliott Wave Chart From 3.18.2026​

Elliott Wave in Action: NZDJPY Pushes Higher from Blue Box Area


Here’s the 4-hour Elliott wave Chart from 3.18.2026 update. In which, the rally to 94.96 high completed the cycle from October 2025 low & made a pullback lower. The internals of that pullback unfolded as Elliott wave double correction where wave (W) ended at 91.93 low. Then a bounce to 94.18 high-ended wave (X) & started the (Y) leg lower towards 91.11- 89.21 blue box area. From there, buyers were expected to appear looking for new highs ideally or for a 3-wave bounce minimum.

NZDJPY Latest 4-Hour Elliott Wave Chart From 4.27.2026​

Elliott Wave in Action: NZDJPY Pushes Higher from Blue Box Area


This is the latest 4-hour Elliott wave Chart from the 4.27.2026 update. In which the pair is showing a strong reaction higher taking place, right after ending the double correction within the blue box area. Allowed members to create a risk-free position shortly after taking the long position at the blue box area. However, a break above 94.96 high is needed to confirm the next leg higher targeting 95.97- 97.62 area higher minimum before profit taking & next pullback happens.

Source: https://elliottwave-forecast.com/bluebox-wins/elliott-wave-nzdjpy-pushes-higher/
 
In trading, there are moments that validate not just a strategy—but an entire framework of understanding market behavior. The recent movement in the S&P 500 is one of those moments.

Weeks ago, we outlined a projection that the market would decline into a predefined Blue Box area 6470.3514 – 6236.7915 a high‑probability support area identified through measured extensions and corrective structures during our live session. This was not a random forecast, but the result of a disciplined application of Elliott Wave analysis, specifically the unfolding WXY structure since January 28, 2026, combined with Fibonacci relationships and historical price behavior

The forecast

Our outlook anticipated a corrective move unfolding after the completion of a larger impulsive sequence. As price action developed, the structure pointed clearly toward a downside continuation into a key support region—the Blue Box.

This zone represented:

  • A confluence of Fibonacci extension levels
  • The completion area of a corrective wave sequence (W–X–Y structure)
  • A region where selling pressure was expected to exhaust
Rather than chasing price or reacting emotionally to volatility, the strategy was simple: wait for the market to come to us.

SPX-daily-21-march-weekend-after.png


What Is The W-X-Y Structure ?

The W‑X‑Y structure is a sideways corrective pattern formed by combining two distinct corrections. Most traders are familiar with individual corrective patterns such as Zigzags, Flat corrections, and Triangles. When two of these patterns are linked together, the result is a double three—commonly labeled W‑X‑Y. Example below image

WXY.jpg


The Reaction

The market reacted exactly as projected. Price declined into the Blue Box with precision, touching the predefined support zone. As anticipated, buyers emerged, selling pressure eased, and a reversal began to take shape

This is where preparation meets opportunity.

Instead of uncertainty, there was clarity:

  • The zone had been defined in advance
  • Risk could be managed effectively
  • The reaction confirmed the underlying bullish structure
SPX-daily-18-april-weekend-after.png


Following the test of the Blue Box, the market wasted no time—it rallied decisively. This move underscores a key principle: markets follow structure, not chaos. By aligning with patterns, traders shift from reacting to anticipating. The rally indicates that the correction has likely run its course, with the broader trend still intact. While short‑term fluctuations remain possible, the larger outlook now leans bullish after this successful support reaction. As long as price holds above the March 2026 corrective lows, failure should occur in either 3 or 7 swings, and focus will turn toward identifying the next buying opportunities

What This Means for Traders

This example highlights a few critical lessons:

  1. Patience Pays
    Waiting for price to reach high-probability zones reduces guesswork and improves consistency.
  2. Structure Over Emotion
    Forecasting based on structure allows traders to stay objective—even during volatile moves.
  3. Precision Matters
    The accuracy of the Blue Box reaction shows the importance of defining clear entry zones rather than chasing the market.
Final Thoughts

The market respected the forecast—trading into the Blue Box, finding support, and delivering the expected reaction. This isn’t about predicting every tick; it’s about identifying high‑probability scenarios and executing with discipline. The focus remains on following structure, managing risk, and letting price confirm the next move. The question now isn’t whether the Blue Box worked—it’s how you position yourself for the next opportunity.

At Elliottwave Forecast (EWF), we deliver consistent market updates through regular charts update. Our analysts update 1‑hour charts four times daily and 4‑hour charts once per day across all 78 instruments. In addition, we host five live sessions each day and maintain a 24‑hour chatroom, providing clients with real‑time market guidance and answers to any questions they may have.

Source: https://elliottwave-forecast.com/st...500-delivering-the-anticipated-move-amid-war/
 
Ventas (VTR) continues to display a strong bullish structure based on Elliott Wave analysis. The stock has developed a clear impulsive sequence from its major low, forming higher highs and higher lows across multiple time frames. This price action reflects steady demand and supports a continuation of the upward trend.

From the chart, VTR completed a major corrective phase in wave (II) near the 2020 lows and has since entered a strong impulsive cycle. The rally from that low shows a well-defined five-wave structure, confirming that the trend has shifted firmly to the upside. Within this advance, the stock is currently progressing through wave ((3)), which typically represents the strongest and most extended phase of an Elliott Wave cycle.

Price has already delivered a sharp move higher, supported by smaller degree impulsive waves. The structure remains clean and suggests that buyers continue to control the market. As long as the sequence holds, further upside remains the preferred direction.

VTR_2026-04-29_07-35-48-scaled.png

VTR Upside Targets and Pullback Strategy​

In the near term, VTR may continue to push higher as wave ((3)) extends. The next key upside target stands near the 1.618 Fibonacci extension, which comes around the 104 level. This area aligns with projected resistance and could mark the completion of the current impulsive leg.

However, before reaching higher levels, the market may produce a corrective pullback in wave ((4)). This pullback should unfold in at least three swings and may take the form of a 3, 7, or 11 swing structure. Such corrections are typical within trending markets and often provide opportunities to enter in the direction of the trend.

Traders should view dips as buying opportunities rather than signs of weakness. The broader structure remains bullish as long as price stays above the invalidation level near 10.52. Holding above this level keeps the long-term trend intact and supports further upside potential.

Summary​

Ventas maintains a strong bullish Elliott Wave structure, with wave ((3)) driving the current advance. The stock targets the 104 region in the near term, while any pullback in wave ((4)) should offer a buying opportunity. As long as price remains above 10.52, the bullish outlook stays valid and favors continued upside.

Source: https://elliottwave-forecast.com/st...liott-wave-analysis-target-104-bullish-trend/
 
Berkshire Hathaway (BRK.B) continues to trade within a strong bullish Elliott Wave structure, supported by a clear sequence of higher highs and higher lows. The long-term trend remains firmly to the upside, and the stock has developed a well-defined impulsive cycle over recent years.

From the chart, BRK.B completed a strong advance into wave ((3)), which marked a significant high before entering a corrective phase. This impulsive move reflects sustained buying pressure and aligns with the broader bullish structure. After completing wave ((3)), the stock has transitioned into a corrective phase labeled as wave ((4)).

The current price action suggests that wave ((4)) is unfolding as a complex correction. The structure appears to be developing through a W-X-Y pattern, which typically signals a sideways to downward consolidation before the trend resumes. This type of correction often takes time and can include multiple swings before completion.

BRK.B_2026-04-29_09-00-34-scaled.png

Wave ((4)) Pullback and Next Upside Potential​

Wave ((4)) is expected to continue lower in the near term, with a projected support zone between 433 and 388. This area aligns with key Fibonacci retracement levels, including the 1.0 and 1.618 extensions of the prior corrective swings. The blue box region on the chart highlights this high-probability area where the correction may find support.

Once the stock completes wave ((4)), the next bullish leg higher in wave ((5)) should begin. This move would aim to break above the previous wave ((3)) high and continue the long-term uptrend. The overall structure supports further upside once the correction finishes.

In the short term, traders should avoid selling into the decline and instead prepare for potential buying opportunities at extreme levels. The best setups typically appear once the correction completes a clear 3, 7, or 11 swing structure within the highlighted support zone.

Summary​

Berkshire Hathaway remains in a long-term bullish trend, despite the ongoing wave ((4)) correction. The stock may continue to pull back toward the 433–388 region before finding support. This zone should offer a buying opportunity for the next move higher in wave ((5)), which is expected to extend the bullish cycle further.

Source: https://elliottwave-forecast.com/st...-brk-b-elliott-wave-analysis-wave-4-pullback/
 
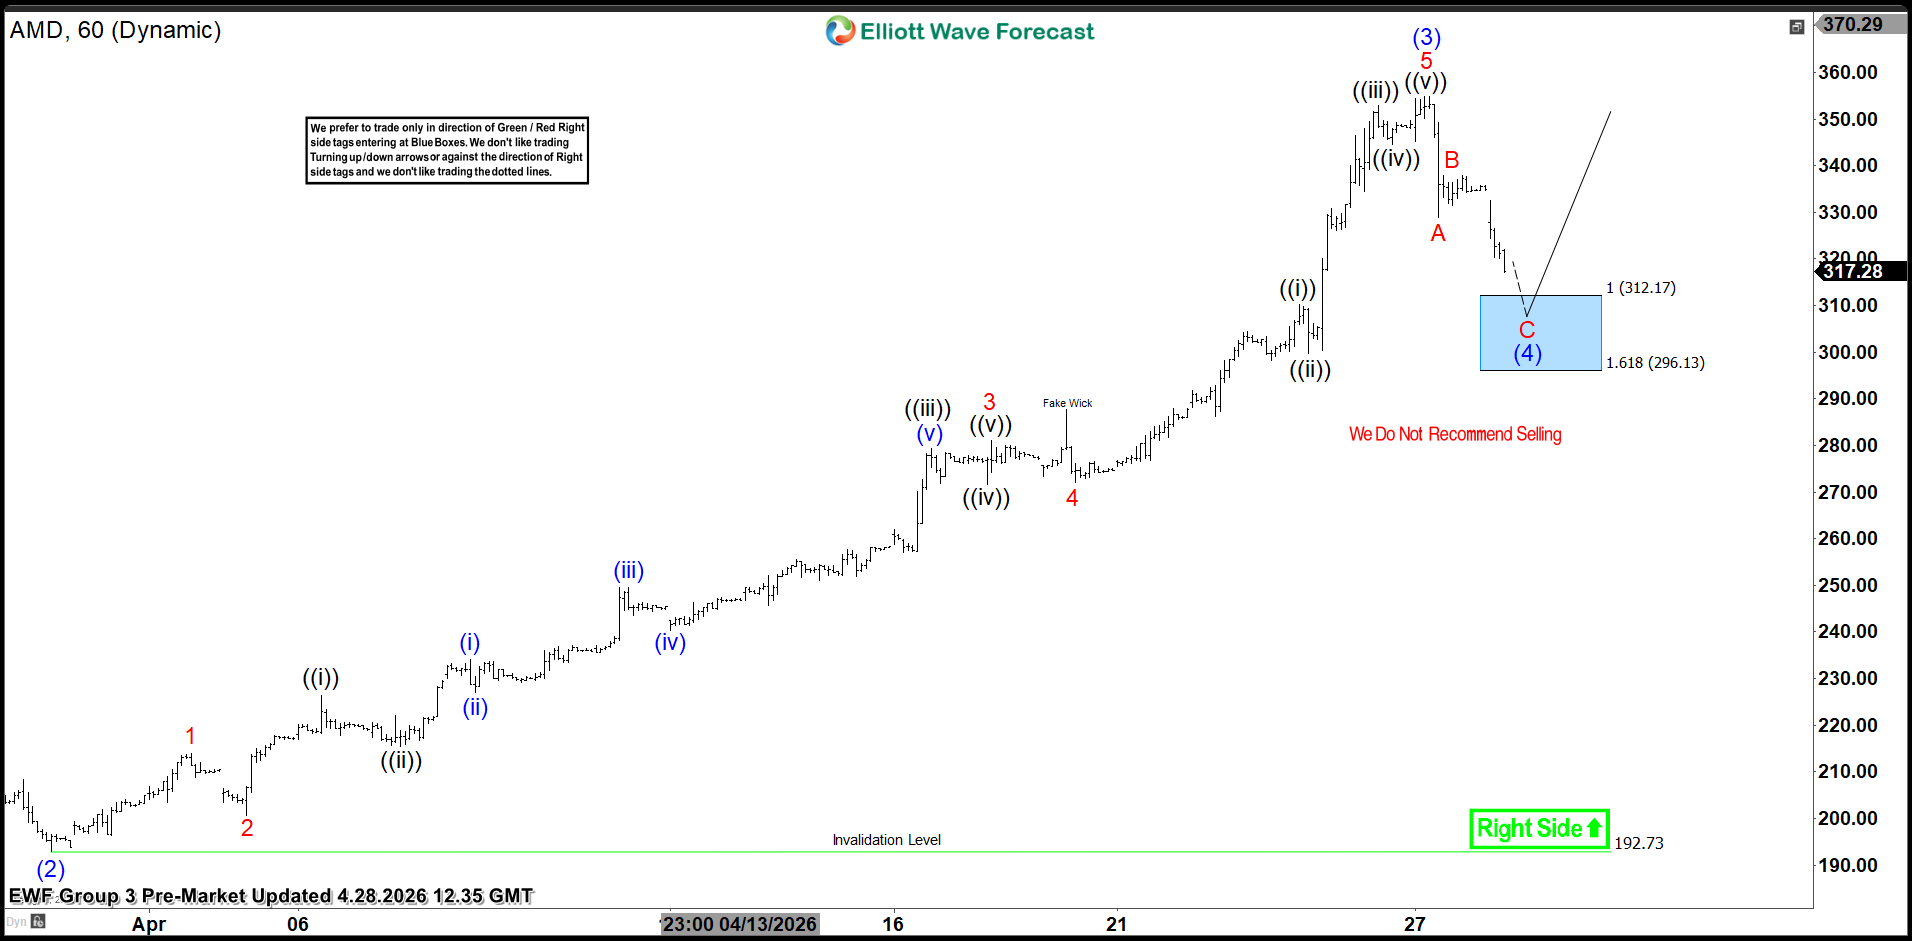
In this Elliott Wave update, we look at the latest price action in Advanced Micro Devices Inc. ($AMD). The stock extended lower into the short-term blue box area at 312.17–296.13 and ended the cycle from the 4/27 peak. As expected, buyers appeared in that zone and triggered a reaction higher. Therefore, longs from the blue box can now look to get risk free.

5 Wave Impulse + ABC correction​

$AMD

$AMD 1H Elliott Wave View April 28, 2026​

$AMD

$AMD turned lower in a corrective sequence and reached the blue box at 312.17–296.13, where sellers were expected to lose control. Once price entered that area, buyers stepped in and delivered the expected bounce. This reaction confirms the blue box once again worked as an important support zone.

As the market has already reacted higher, traders who bought the blue box can now manage the position by getting risk free. In other words, they can reduce exposure or move stops to breakeven while allowing the trade room to develop further.

To sum up, $AMD ended the cycle from the 4/27 peak, reached the 312.17–296.13 blue box, and buyers entered as expected. As a result, the reaction higher is in place, and longs can now look to get risk free while the bounce continues.

Source: https://elliottwave-forecast.com/st...recast-reaction-higher-from-blue-box-support/
 
QuantumScape (QS) trades lower as investors wait for clearer revenue progress. Analysts expect another loss this quarter, with EPS near –0.18, matching recent trends. However, the company continues improving efficiency, and recent results beat expectations. Therefore, experts see gradual progress but no major financial shift yet.

Next quarter should show a similar pattern, with EPS near –0.17 according to analyst estimates. The company still focuses on scaling solid‑state battery technology, which delays meaningful revenue. Even so, analysts highlight improving cash discipline and steady technical milestones. Consequently, expectations remain cautious but slightly more optimistic.

Elliott Wave Outlook: QuantumScape (QS) Weekly Chart December 2025

Elliott Wave Outlook: QuantumScape (QS) Weekly Chart December 2025


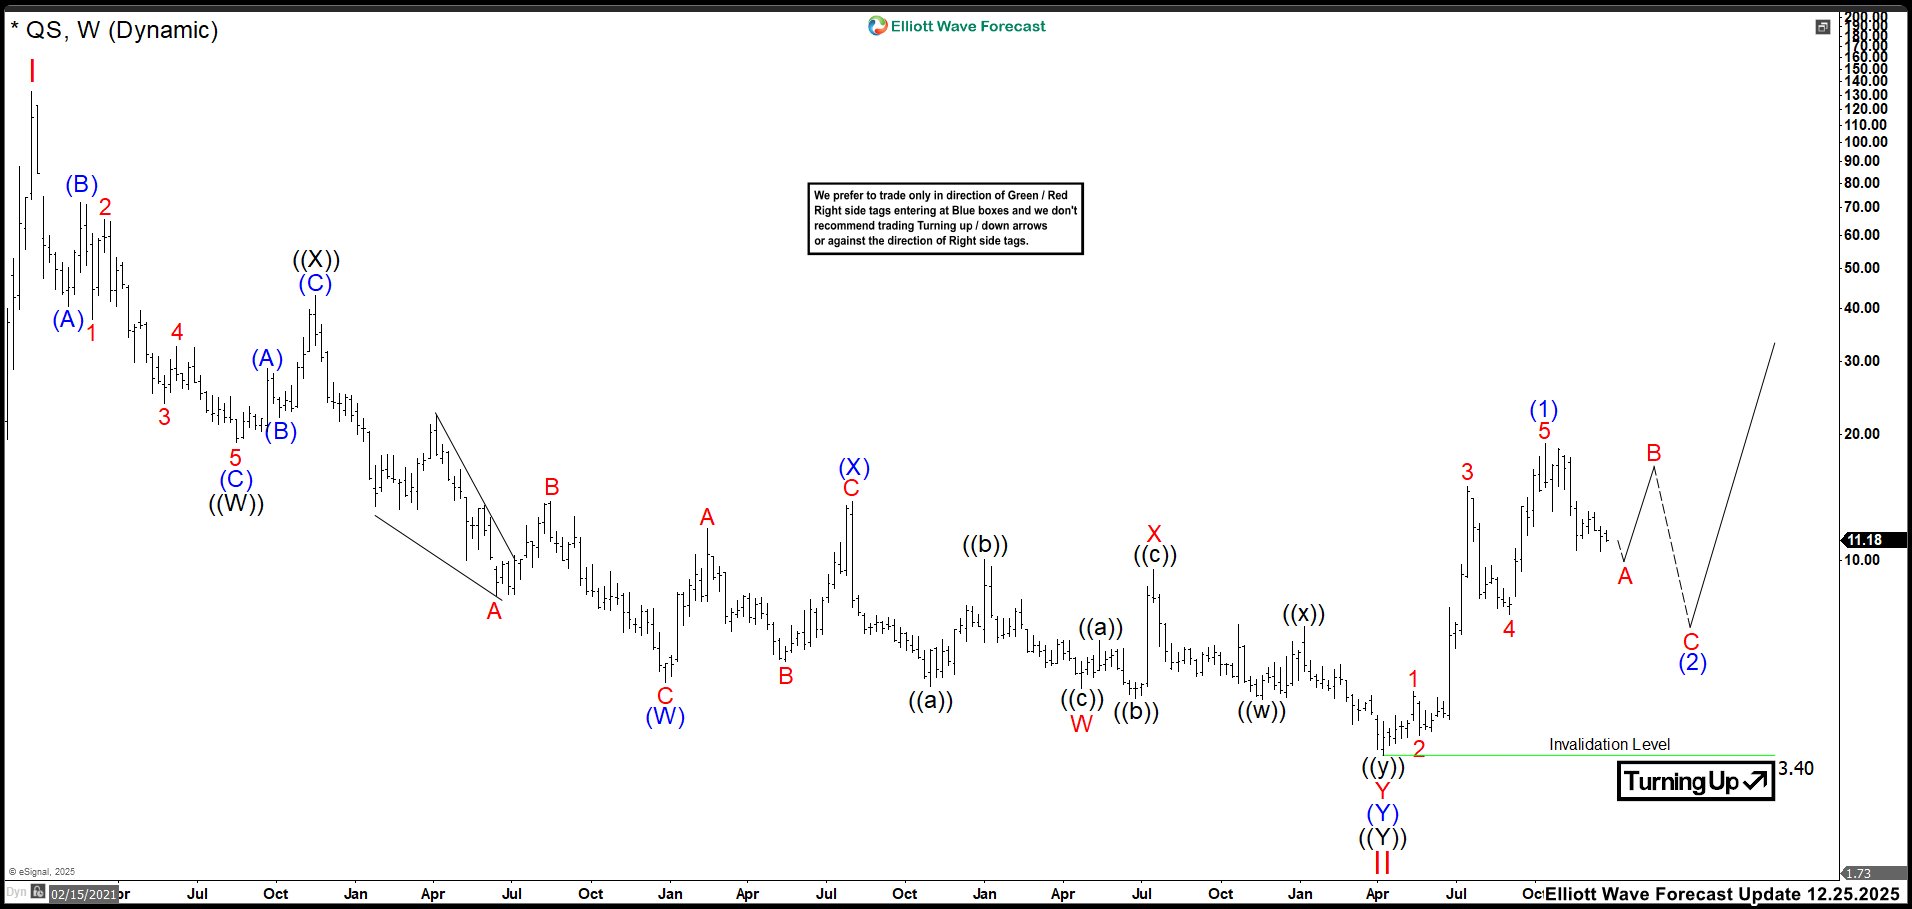
Last year, wave (1) finished at the 19.07 high in October. From there, we anticipated the chart would shift into a corrective phase as Wave (2) began. Our view suggested Wave (2) could drop into the 6–7 dollars zone before the rally continued above 19.07. At that time, we also noted that price might still make one more low to complete Wave A of (2). Regardless of that final dip, we expected a rebound as Wave B. That bounce was projected to reach the 15–17 area before the chart resumed its decline into Wave C of (2). We stated that only a break above the Wave (1) high would confirm that Wave (2) had already finished and that QS had started a new bullish cycle. (If you want to learn more about Elliott Wave Principle, please follow these links: Elliott Wave Education and Elliott Wave Theory.)

Elliott Wave Principle Behind the Market Structure​

Impulse

An impulse is a clean 5‑wave pattern that drives the trend forward.

  • Waves 1‑3‑5 are strong and directional.
  • No overlap between waves 1 and 4.
  • Wave 3 is usually the strongest.
  • Structure is clear, with increasing momentum.
Elliott Wave Principle Behind the Market Structure


Elliott Wave Outlook: QuantumScape (QS) Weekly Chart May 2026

Elliott Wave Outlook: QuantumScape (QS) Weekly Chart May 2026


Wave A dropped more than expected and reached the 6‑dollar area, where QS bounced to 9.66 and completed Wave B. After that bounce, we still expect more downside to complete three waves and finish the Wave (2) correction before looking for buying opportunities to trade in wave (3) of an impulse.

For now, the ideal zone to complete the correction sits at 5.03–3.60. In that region, the market must show a clear bullish reaction to confirm the pullback has ended and the next upward cycle can continue.

Source: https://elliottwave-forecast.com/stock-market/quantumscape-qs-targets-zone/
 
Johnson Controls International plc, (JCI) engages in engineering, manufacturing, commissioning & retrofitting building products & systems in United States & globally. It operates in four segments like Building Solutions in North America, Building Solutions EMEA/LA, Building Solutions Asia-Pacific & Global products. It comes under Industrials sector & trades as “JCI” ticker at NYSE.

JCI favors impulse rally in weekly against in III of (III) against October-2023 low. It favors upside in (5) targeting $151.45 - $159.38 area to end ((3)), while high comes with momentum divergence. We like to buy the pullback in 3, 7 or 11 swings in ((4)) later at extremes.

It ended (I) at $81.77 high in December-2021 & (II) at $45.52 low in July-2022. Above there, it placed I of (III) at $69.60 in January-2023, II at $47.90 low in October-2023 & favors rally in III. Within III, it ended ((1)) at $91.14 high, ((2)) at $68.03 low & favors upside in ((3)). Within ((1)) of III, it ended (1) at $74.23 high, (2) at $64.31 low, (3) at $87.16 high, (4) at $75.32 low & (5) at $91.14 high. Every time correction hits the blue box area, it reacted higher to extend bull run.

JCI - Elliott Wave Latest Weekly View:​

JCI-W22.jpg

It ended (1) of ((3)) at $123.78 high, (2) at $108.41 low, (3) at $146.49 high, (4) at $125.91 low & favors upside in 1 of (5). It already broke to new high in (5) above $146.49 high of (3) & expect rally into $151.45 - $159.38 area to finish ((3)). The rally in ((3)) already crossed above 1.618 extension of ((1)) as $138.36 & expect to finish around $154.98 as 2.0. The high within ((3)) came with momentum divergence, indicates the trend may mature & pullback possible. So, chasing at current level cane be risky & buyers should wait for ((4)) pullback. The break below trendline will confirm the pullback. If it managed to erase the momentum divergence, then it can extend ((3)) in alternate scenario.

Source: https://elliottwave-forecast.com/st...s-jci-rally-targeting-151-45-159-38-pullback/
 
Goldman Sachs (NYSE: GS) displays a strong weekly bullish sequence. Today, we explore the Elliott Wave pattern behind this move. Our analysis highlights potential paths and targets for continued momentum.

Elliott Wave Analysis

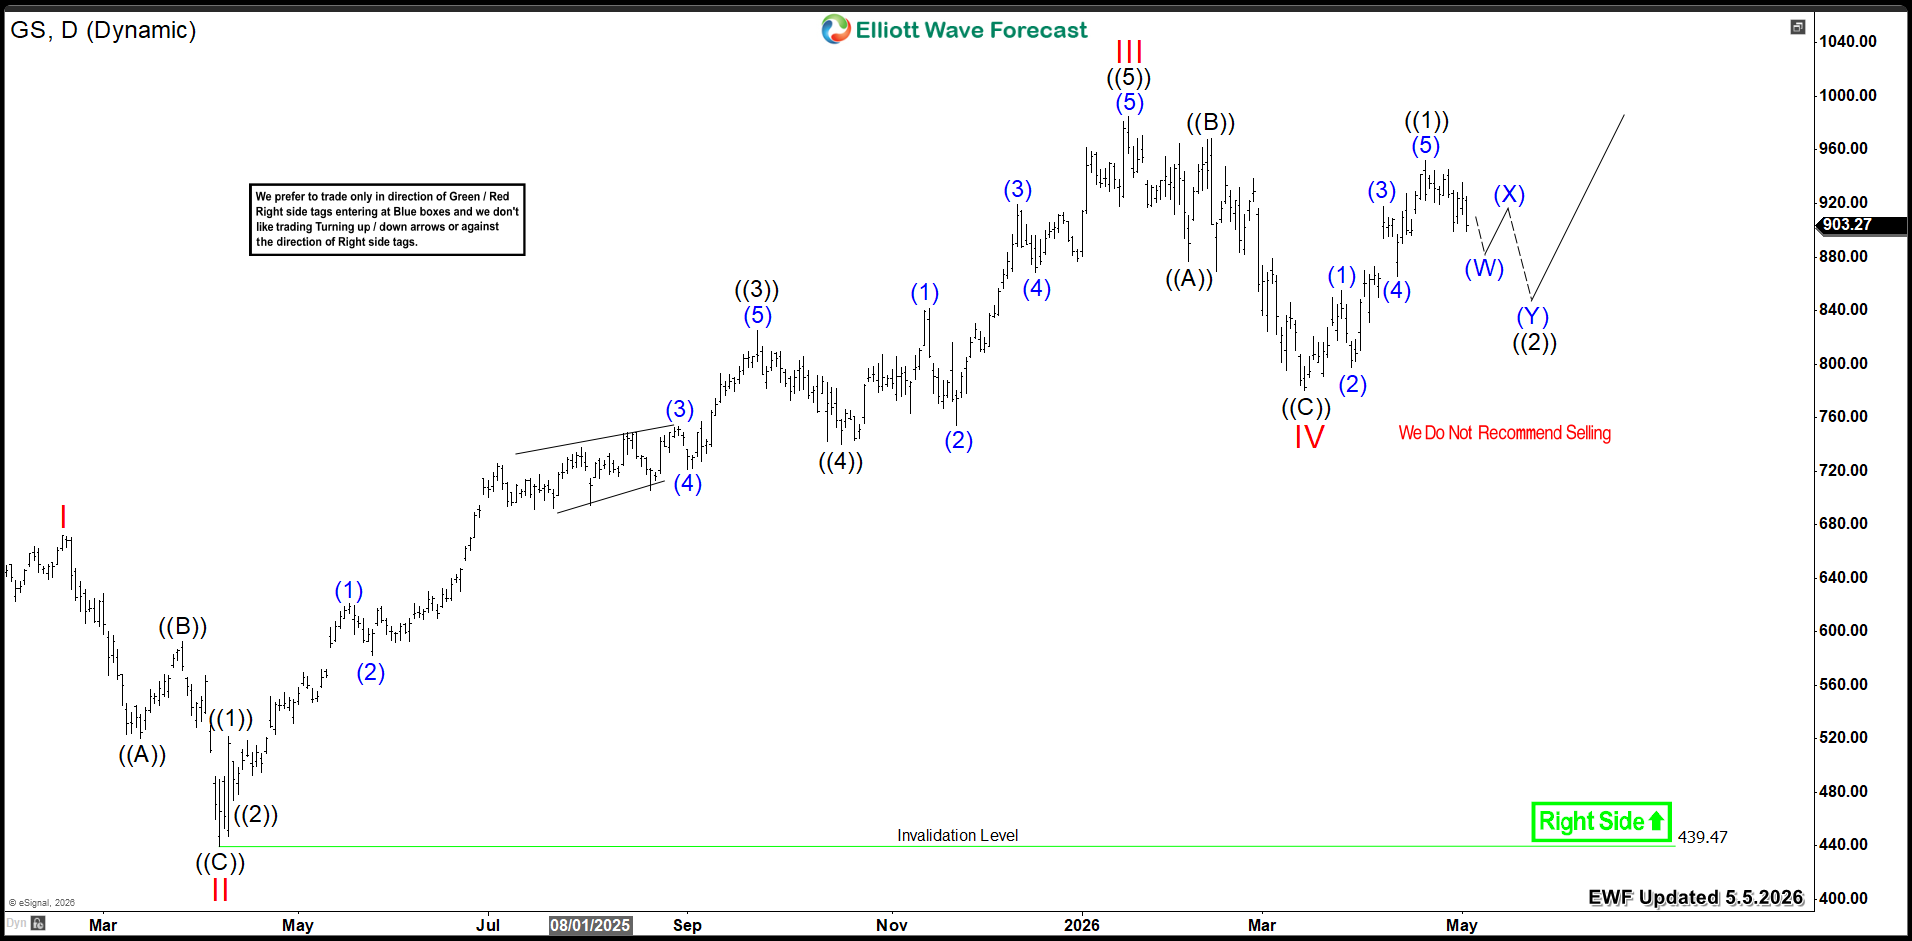
Goldman Sachs completed a five-wave advance from its April 2025 low. This wave III peaked at 984. Then, the stock formed a three wave pullback in wave IV. This correction ended in March 2026 at 984. From that low, GS established an initial five-wave advance in wave ((1)).

However, it did not break the previous peak. Therefore, the stock must hold above the March low during the wave ((2)) pullback. This will allow it to resume the rally in wave V and break into new all-time highs. The next upside move should extend GS toward the $1035−$1114 target zone. Then, a larger degree correction will follow.

Goldman Sachs Daily Chart 5.5.2026

Goldman Sachs GS Daily

Source: https://elliottwave-forecast.com/st...s-jci-rally-targeting-151-45-159-38-pullback/
 
The Walt Disney Company (DIS), when viewed through the disciplined framework of Elliott Wave Theory, appears to be approaching a critical inflection point. The charts both the monthly (macro) and weekly (intermediate) timeframes—suggest that Disney is transitioning out of a prolonged corrective phase and preparing for a new impulsive advance. If this interpretation holds, the stock is not merely stabilizing—it is structurally setting up for a powerful move higher.

Following Wave (I) peak, the stock entered a deep and complex Wave (II) correction, unfolding as a classic abc structure:

  • Wave a: The initial sharp decline from the highs
  • Wave b: A temporary recovery that failed to make new highs
  • Wave c: A prolonged and grinding selloff, marked by declining momentum and sentiment
This corrective phase aligns with fundamental headwinds: streaming profitability concerns, restructuring costs, and macro pressure on discretionary spending. However, from an Elliott Wave standpoint, these factors are not random—they are consistent with the psychology of a Wave (II) correction, which often retraces deeply and shakes out long-term participants.

Importantly, the structure now appears mature, with Wave c nearing completion inside a defined Fibonacci support zone (approximately $40–$85) as indicated by the Blue Box.

Monthly Disney (DIS) Elliott Wave Chart​

DIS-Monthly20260504195036.jpg


Weekly Chart: Base Formation and Early Reversal​

The weekly chart provides a more granular view of the transition.

DIS-Weekly20260504195221.jpg


Key structural elements:

The decline into the lows forms a completed abc correction, labeled as Wave (II)
Price action near the bottom shows loss of downside momentum, a typical characteristic of terminal corrective waves
A developing structure labeled I-II suggests that a new impulsive sequence may already be underway

The presence of higher lows and the stabilization above the invalidation level (~$78.85) is particularly important. In Elliott Wave terms, this level acts as a line in the sand:

Holding above it supports the bullish count. Breaking below it would invalidate the immediate impulsive interpretation and suggest further downside.

The phrase “getting ready to rally” is appropriate—but it’s important to interpret it correctly within Elliott Wave logic.

This is not about a sudden, random spike. Instead, it reflects:

  • A completed multi-year correction or Wave (II)
  • A base-building phase that resets sentiment and valuation
  • The early stages of a new impulsive trend
If the structure plays out as expected, the upside path could involve:

  • A break above intermediate resistance (~$110–$120 zone)
  • Acceleration into Wave (III), potentially targeting significantly higher levels over time
  • A longer-term retest—and possible breakout —of prior all-time highs

Conclusion​

Disney’s current price structure suggests a market at the end of correction and the beginning of expansion. The multi-year decline appears to have fulfilled the requirements of a Wave (II) retracement, while recent price action hints at the birth of a new impulsive cycle.

In this context, Disney is not simply “recovering”—it is repositioning for a potential Wave (III) advance, the most powerful phase in Elliott Wave theory.

If confirmed, this would mark the transition from skepticism to momentum—from a market defined by doubt to one driven by renewed conviction.

And that’s exactly the kind of environment where stocks don’t just rise—they shoot higher.

Source: https://elliottwave-forecast.com/video-blog/disney-dis-disney-getting-ready-to-rally/
 
  • Royal Caribbean (RCL) presents a compelling case study through the lens of Elliott Wave Theory, particularly when analyzed across both long-term (monthly) and intermediate-term (weekly) structures. The charts outline a classic impulsive advance nested within a larger-degree cycle, with the current price action suggesting that the market is transitioning through a corrective phase rather than resuming its broader bullish trend.

The Grand Super Cycle Context​

On the monthly chart, RCL appears to be progressing through a Grand Super Cycle impulse, with the COVID-era collapse marking the termination of a large degree Wave II. The subsequent recovery unfolds as a powerful Wave III, which is typically the strongest and most extended wave in Elliott Wave structure.

RCL-Monlty20260504190910.jpg


This Wave III itself subdivides cleanly into five waves:

  • Wave ((1)): Initial recovery off the lows
  • Wave ((2)): Deep corrective retracement
  • Wave ((3)): Explosive upside move, consistent with post-pandemic demand and pricing power
  • Wave ((4)): Sharp but controlled correction
  • Wave ((5)): Climactic advance toward recent highs
The labeling suggests that RCL has likely completed or is very near completing Wave III of the higher degree, which aligns with the visible exhaustion characteristics near the highs (volatility, overlapping structures, and rejection wicks).

Weekly Structure: Entering Wave IV​

RCL-Daily20260504190831.jpg

The weekly chart refines this view. The completed five-wave sequence into the highs is followed by what appears to be an ((A))-((B))-((C)) corrective structure. This marks the beginning of Wave IV.

Key observations:

  • The decline from the highs is not impulsive. It is corrective and overlapping, consistent with a Wave IV rather than a trend reversal
  • The projected blue box (roughly $157–$233) represents a high-probability retracement zone based on Fibonacci relationships (notably the 1.0–1.618 extension of prior corrective legs)
  • This aligns with typical Wave IV behavior: sideways-to-down consolidation that resets sentiment without breaking the broader trend
This is critical: Wave IV corrections often feel like trend changes but are structurally pauses before continuation.

If price stabilizes and forms a base around this region, it strengthens the case that the market is preparing for Wave V.

The Next Move: Wave V Upside Potential​

Once Wave IV completes, Elliott Wave theory anticipates a final Wave V advance, which could:

  • Retest or exceed prior highs
  • Potentially extend toward the $300+ region, as sketched in your projection
  • Be driven by renewed momentum, improved balance sheet optics, and continued demand strength

Conclusion​

The thesis that “a $200 move is coming” fits well within the Elliott Wave framework. It nis ot as a final destination, but as a necessary corrective phase within a larger bullish cycle.

Source: https://elliottwave-forecast.com/video-blog/royal-caribbean-rcl-a-200-rally-is-coming/
 
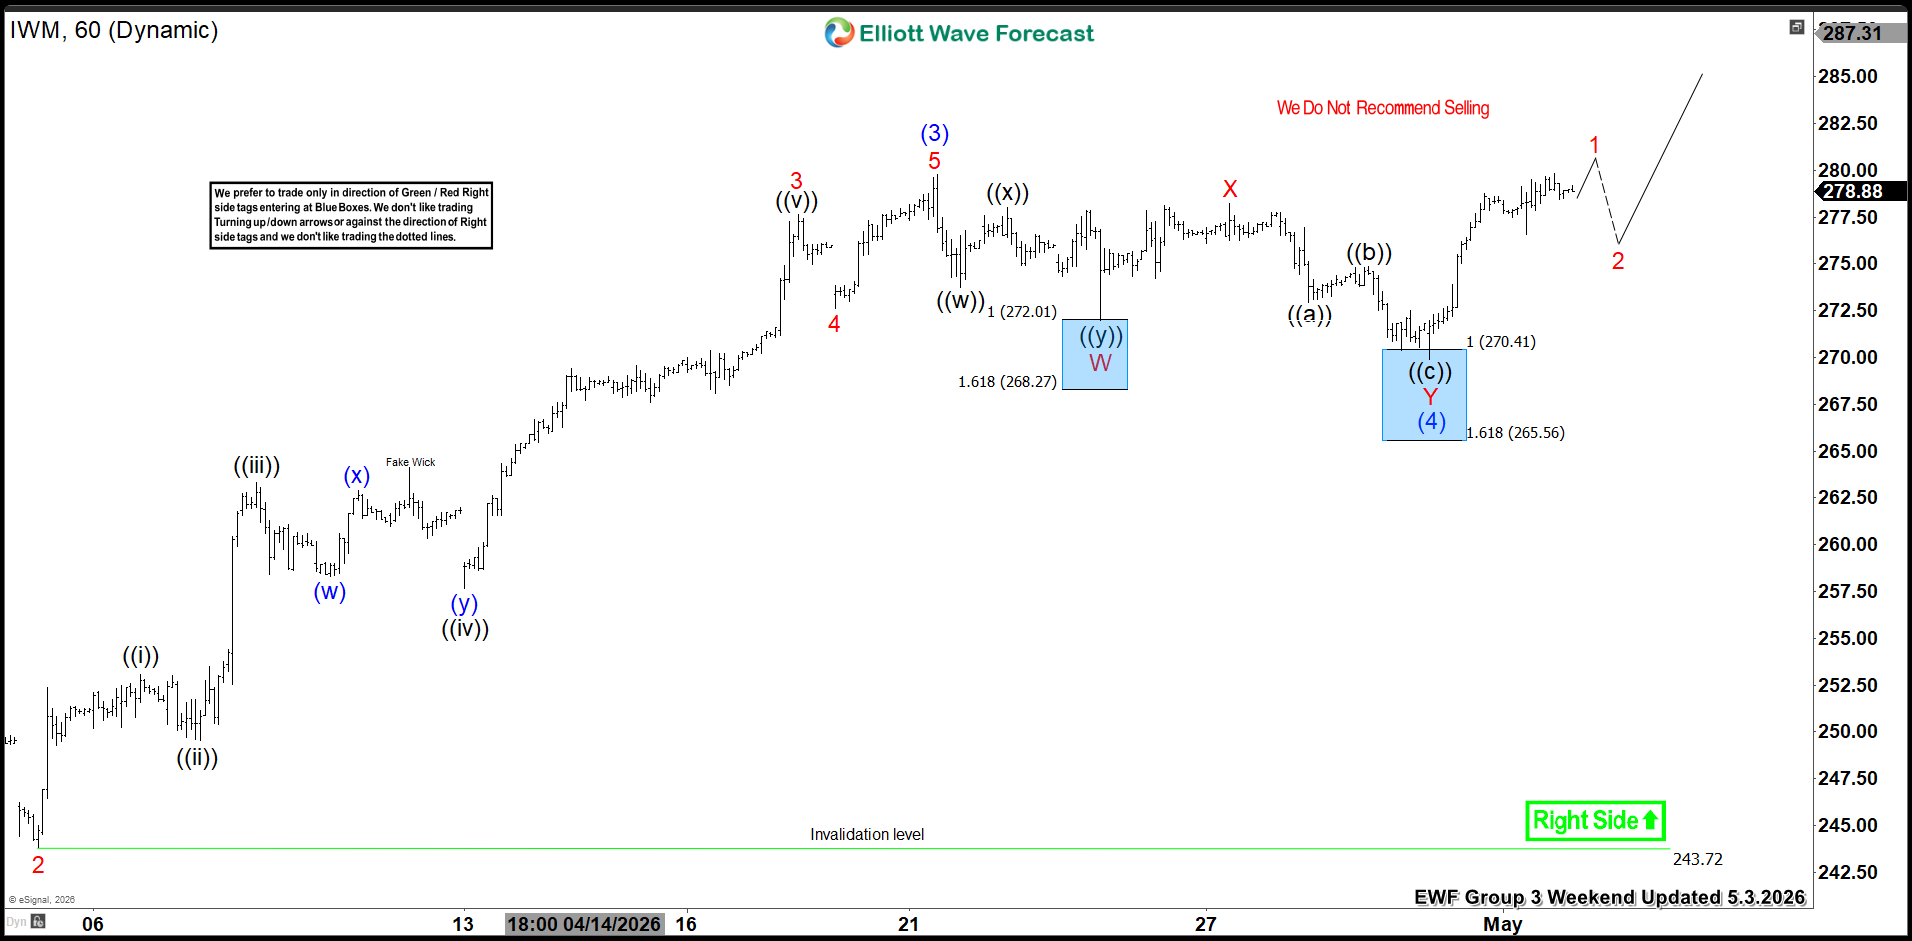
In this Elliott Wave update, we look at the latest structure in the iShares Russell 2000 ETF ($IWM). The ETF pulled back in a 7-swing corrective structure and reached short-term blue box areas, where buyers were expected to appear. As anticipated, the market reacted higher from those support zones. Therefore, buyers who entered in the blue boxes can now look to stay risk free as the rally continues to develop.

5 Wave Impulse + 7 Swing WXY correction​

$NVDA

$IWM 1H Elliott Wave View May 3, 2026​

$IWM

The first blue box came at 272.01–268.27, where buyers entered and produced a bounce. After that, $IWM extended lower once more into the second blue box at 270.41–265.56. From there, buyers stepped in again and pushed the ETF higher. This confirmed that the pullback remained corrective and that the broader bullish sequence stayed intact.

Because the market already reacted higher from the blue box areas, long positions from those levels can now look to get risk free by moving stops to breakeven. This is the preferred approach once the expected reaction takes place.

In the short term, $IWM can continue to extend higher while the bullish sequence remains valid. As long as the ETF stays above the 243.72 invalidation level, the right side remains higher and dips should continue to find support.

To sum up, $IWM pulled back in 7 swings, reached the blue box areas at 272.01–268.27 and 270.41–265.56, and buyers entered as expected. As a result, the ETF has reacted higher, and longs can now stay risk free while the recovery continues.

Source: https://elliottwave-forecast.com/st...-higher-from-blue-box-after-7-swing-pullback/
 
Hello traders, in today’s article we’ll be focusing on $AMD. The stock has surged over 38% from the projected Blue Box area ahead of its earnings report. We’ll examine how the technical structure aligns with the fundamentals, highlighting the relationship between market structure and Fundamentals in this case the Earning Report that was release on 05.05.2026

Who is AMD?

AMD (Advanced Micro Devices, Inc.) is a leading American semiconductor company headquartered in Santa Clara, California, best known for designing CPUs, GPUs, and high‑performance computing solutions. It is a major rival to Intel and NVIDIA, with products powering PCs, servers, gaming consoles, and AI data centers, with a Market cap at $579 Billion as of May 2026.

AMD Pullback Reaches the Blue Box Area

AMD has delivered another textbook Elliott Wave reaction after completing a strong impulsive rally into the late-April highs. In our latest forecast, we warned members not to chase the upside and instead expected a corrective pullback toward the Blue Box area before buyers re-emerged.

The Forecast: Identifying the Corrective Pullback

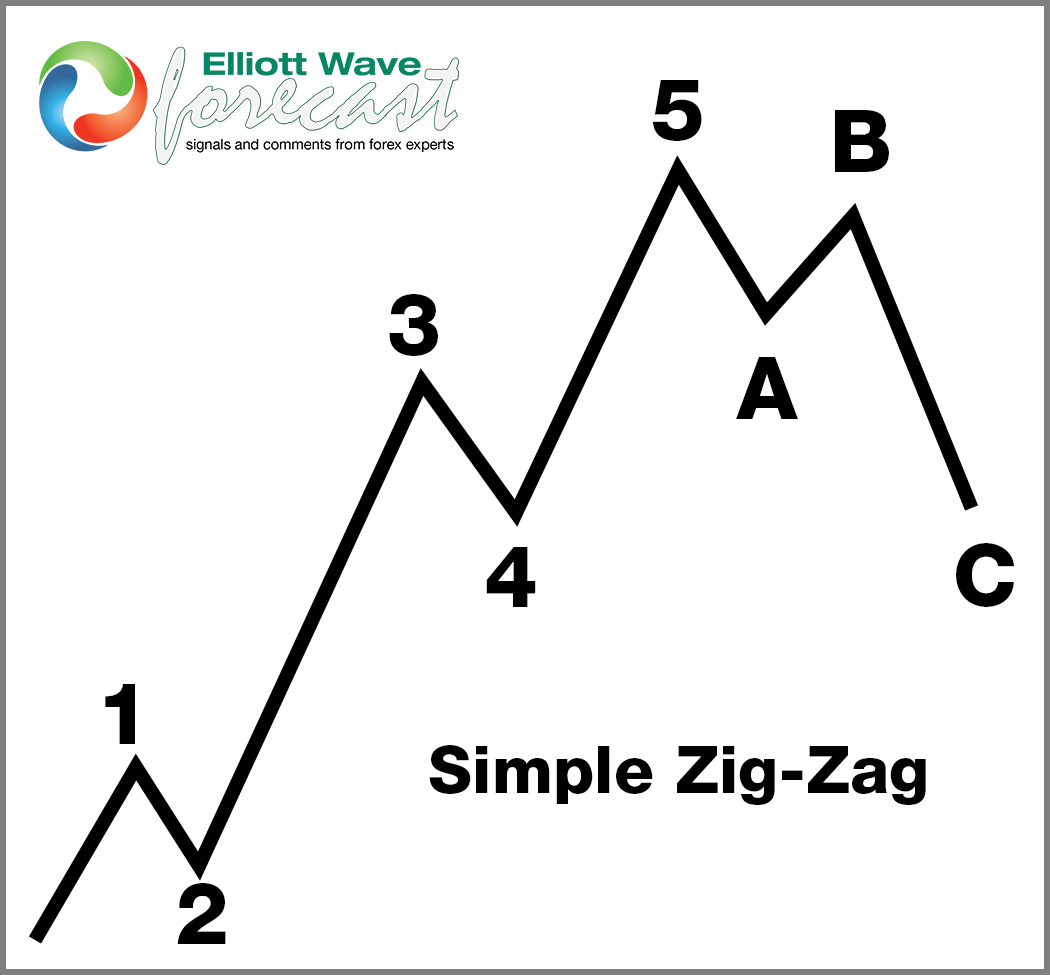
On April 28, 2026, our analysis identified that AMD had completed a clean five-wave impulsive move to the upside, peaking at Red Wave 5. Following the basic principles of Elliott Wave, an impulsive move is always followed by a three-wave corrective sequence.

We labelled the subsequent move lower as an ABC zigzag correction. Based on Fibonacci extension and retracement levels, we projected a "Blue Box" area between 312.17 (100% extension) and 296.13 (161.8% extension). This zone represented a high-frequency area where Wave C was likely to terminate, and the primary bullish trend would resume.
AMD-1-hr-28-april-before.png


Why the Blue Box Matters?

At EWF, the Blue Box is one of our highest probability trading areas. It identifies regions where the market is statistically likely to complete a correction and resume the dominant trend.

In AMD’s case:

  • The larger trend remained bullish
  • The right side continued pointing higher
  • The decline was expected to remain corrective rather than impulsive
The Execution: Entering the Blue Box

As the above chart illustrates, we remained patient as AMD traded lower toward our target. The key was the "Right Side" tag, which remained green, indicating that the larger-degree trend was still bullish. Our strategy was clear: we do not recommend selling, but rather waiting for the correction to find its floor within the identified support zone.

On April 29, price action entered the top of the Blue Box, bottoming out perfectly around the 309.47 level. This move completed Wave (4) and set the stage for the next impulsive cycle as seen below.

AMD.jpg


The Result: A Massive Impulsive Rally

The above chart from May 6, 2026, shows the remarkable accuracy of this technical setup. Once the (4) wave terminated in the Blue Box, buyers took complete control and ignited a massive, multi‑wave impulsive rally that cleared previous high level in its path. AMD broke out of the zone with a clean five‑wave sequence at a smaller degree, confirming that the trend had officially shifted upward. The rally reached its most aggressive phase during the mid‑cycle Wave 3, where vertical price expansion unfolded, and momentum entered the profit taking zone. After a brief volatility event near the $430 level the stock completed Wave 3 and is now consolidating in what appears to be a Wave ((ii)) pullback.

Conclusion

The results speak for themselves: AMD entered around the $312 Blue Box support and quickly surged past $430, delivering over 38% gains in roughly a week of trading. Staying on the Right Side remains the guiding principle, and as the chart clearly states, selling is not recommended. Current price action suggests AMD is simply pausing before the next leg higher, and with the Right Side still pointing up, every corrective dip continues to present opportunity for traders following the sequence.

This brings us to the conclusion that fundamentals often serve as the final piece in completing the structure. As the correction unfolded into the Blue Box area just days before AMD’s earnings release, the technical setup was already in place. When the earnings report came out, it perfectly complemented the forecast, fuelling the surge to the upside and validating the alignment between structure and fundamentals.

At Elliottwave Forecast (EWF), we deliver consistent market updates through regular charts update. Our analysts update 1‑hour charts four times daily and 4‑hour charts once per day across all 78 instruments. In addition, we host five live sessions each day and maintain a 24‑hour chatroom, providing clients with real‑time market guidance and answers to any questions they may have.

Source: https://elliottwave-forecast.com/st...cent-from-the-blue-box-after-earnings-report/
 

Advanced Micro Devices (AMD) Evolution and Market Position​

Advanced Micro Devices, Inc. ($AMD) has grown from a secondary semiconductor maker into one of the world’s most influential technology firms. Founded in 1969 by Jerry Sanders and former Fairchild Semiconductor executives, AMD first produced logic chips and processors during the personal computing revolution. Over five decades, it transformed into a leader in high‑performance computing, AI acceleration, gaming hardware, and data center infrastructure.

For years, AMD competed directly with Intel in CPUs and NVIDIA in GPUs. The company faced financial stress and market share losses in the 2000s and early 2010s. Its turnaround began in the late 2010s with the launch of Ryzen CPUs in 2017 and EPYC server processors. These products reshaped the semiconductor landscape, restoring AMD’s leadership in several performance categories and boosting market share across desktop, laptop, gaming, and enterprise markets.

Under CEO Dr. Lisa Su, AMD became one of the strongest growth stories in technology. Revenue and profitability surged as cloud providers, enterprises, and consumers adopted AMD solutions. The acquisition of Xilinx expanded its reach into adaptive computing, embedded systems, and AI infrastructure.

AMD products now power gaming consoles such as Sony’s PlayStation and Microsoft’s Xbox, high‑performance data centers, AI workloads, and cloud systems. Rising AI demand and next‑generation computing needs have positioned AMD as a major player in the global semiconductor cycle.

From a market perspective, AMD is closely tied to the broader technology sector and global equity indices. Investor sentiment around AMD often reflects expectations for AI growth, enterprise spending, and cloud expansion. The stock has become a key component in indices such as the Nasdaq and the S&P 500.

Elliott Wave Analysis​

The company’s long-term chart structure reflects not only fundamental growth but also strong cyclical and impulsive market behavior consistent with large technological innovation waves. This combination of historical transformation, expanding institutional relevance, and powerful market momentum makes AMD one of the most technically and fundamentally important symbols to analyze through the lens of Elliott Wave Theory.

From the all-time lows, $AMD shows a clear five-wave advance that ended in March 2024. After that peak, the symbol developed a corrective structure in three waves, which appears to have ended on 04.07.2025. Since then, AMD has started an impressive rally that has become very interesting from an Elliott Wave perspective.

The current rally is impulsive in nature and should continue extending higher. The first target area comes in the $500–$600 zone to complete wave (III). After that, the larger all-time cycle can still extend even higher into the $850–$900 area.

AMD Monthly Elliott Wave Chart​

AMD-Weekly20260511204012-1024x508.jpg

The idea and the nest taking place within the powerful wave (III). A nest is a series of wave (I)(II), followed by another smaller degree I-II structure. Most of the time, this type of formation happens inside a strong wave (III), where acceleration begins to take place.

Elliott Wave Theory has three basic rules:

  • Wave (II) cannot trade below the beginning of wave (I)
  • Wave (III) cannot be the shortest wave
  • Wave (IV) cannot overlap or penetrate the peak of wave (I)
Everything about the theory can be found on this page:
https://elliottwave-forecast.com/elliott-wave-theory/

Looking at the price action in detail since the all-time lows in AMD, it is clear that the third swing from 04.07.2025 into the peak at 10.27.2025 was the shortest. This means the five-swing structure remains incomplete, supporting the idea of a nest and the higher target areas mentioned above.

AMD Monthly Elliott Wave Chart​

AMD-Weekly20260511204813-1024x508.jpg


AMD also appears to be correcting in a higher-degree relationship with world indices. Consequently, the symbol may be leading the next acceleration phase across the broader market. The following chart compares $AMD with $NQ_F, which provides a major clue in today’s market and helps traders remain on the right side of the trend.

AMD-Weekly20260511205138-1024x508.jpg


In conclusion, once again, the basic rules of Elliott Wave Theory are allowing us to anticipate future price action. AMD is suggesting that strong support across world indices is coming, and with it, potentially very positive news for the broader market.

Source: https://elliottwave-forecast.com/stock-market/amd-shows-the-path-into-900-supporting-world-indices/
 
IREN Limited operates in integrated data center business in Australia & Canada. It owns & operates computing hardware as well as electrical infrastructure & data centers. It also mines Bitcoin. It comes under Financial Services sector & trades as “IREN” at Nasdaq.

IREN favors upside against December-2022 low & expect higher against 3.30.2026 low. It favors ((2)) correction in 3, 7 or 11 swings against March-2026 low before continue higher, while above $30.76 low.

In weekly, it made all time low at $1.02 on 12.28.2022. Above there, it ended (I) impulse at $76.87 high in November-2025 & (II) at $30.76 low. Within (I), it placed I at $15.92 high, II at $5.13 low, III at $74.15 high, IV at $48.20 low & finally V at $76.87 high. It ended the (II) in double three pullback. It placed w of (II) at $33.34 low, x at $63.59 high & y at $30.76 low on 3.30.2026 low. It favors rally in I of (III) against March-2026 low & confirms bullish view, once break above $76.87 high. It placed ((1)) of I at $65.61 high & now correcting in ((2)). The ((2)) may pullback towards $52.37 - $44.16 area as 0.382 - 0.618 Fibonacci retracement before higher

IREN - Elliott Wave Latest Daily View:​

It placed (1) of ((1)) at $54.14 high, (2) at $42.21 low, (3) at $62.43 high, (4) at $55.41 low & (5) at $65.61 high. It favors corrective pullback in (A) of ((2)) & expect another push lower before it may bounce in (B). The ((2)) can unfold in 3, 7 or 11 swings against 3.30.2026 low before resume higher. It expects to find support in extreme areas in pullback against March low. Few alternates possible. Like, it may be the (4) pullback and still can go for new high to end the ((1)) before correcting next. But as long as the pullback holds above March-2026 low, it favors higher in I of (III).

Source: https://elliottwave-forecast.com/stock-market/iren-signals-pullback-before-major-rally/