Elliott Wave Analysis by EWF

Travelers (TRV) enters the next quarter with solid momentum after beating Q1 earnings. Analysts expect EPS near 4.84 and revenue around $10.97B, showing stable demand despite mild growth pressure. Moreover, recent product expansions and AI‑driven claims tools suggest stronger operational efficiency. These improvements could support underwriting margins in the short term.
However, expectations remain cautious because EPS will likely drop from last year’s unusually strong quarter. Still, analysts project steady full‑year earnings near $28.14 per share, which signals confidence in TRV’s core business. As the July 17 earnings date approaches, investors will watch loss trends, pricing strength, and catastrophe exposure. These factors will shape the stock’s direction in the coming months.

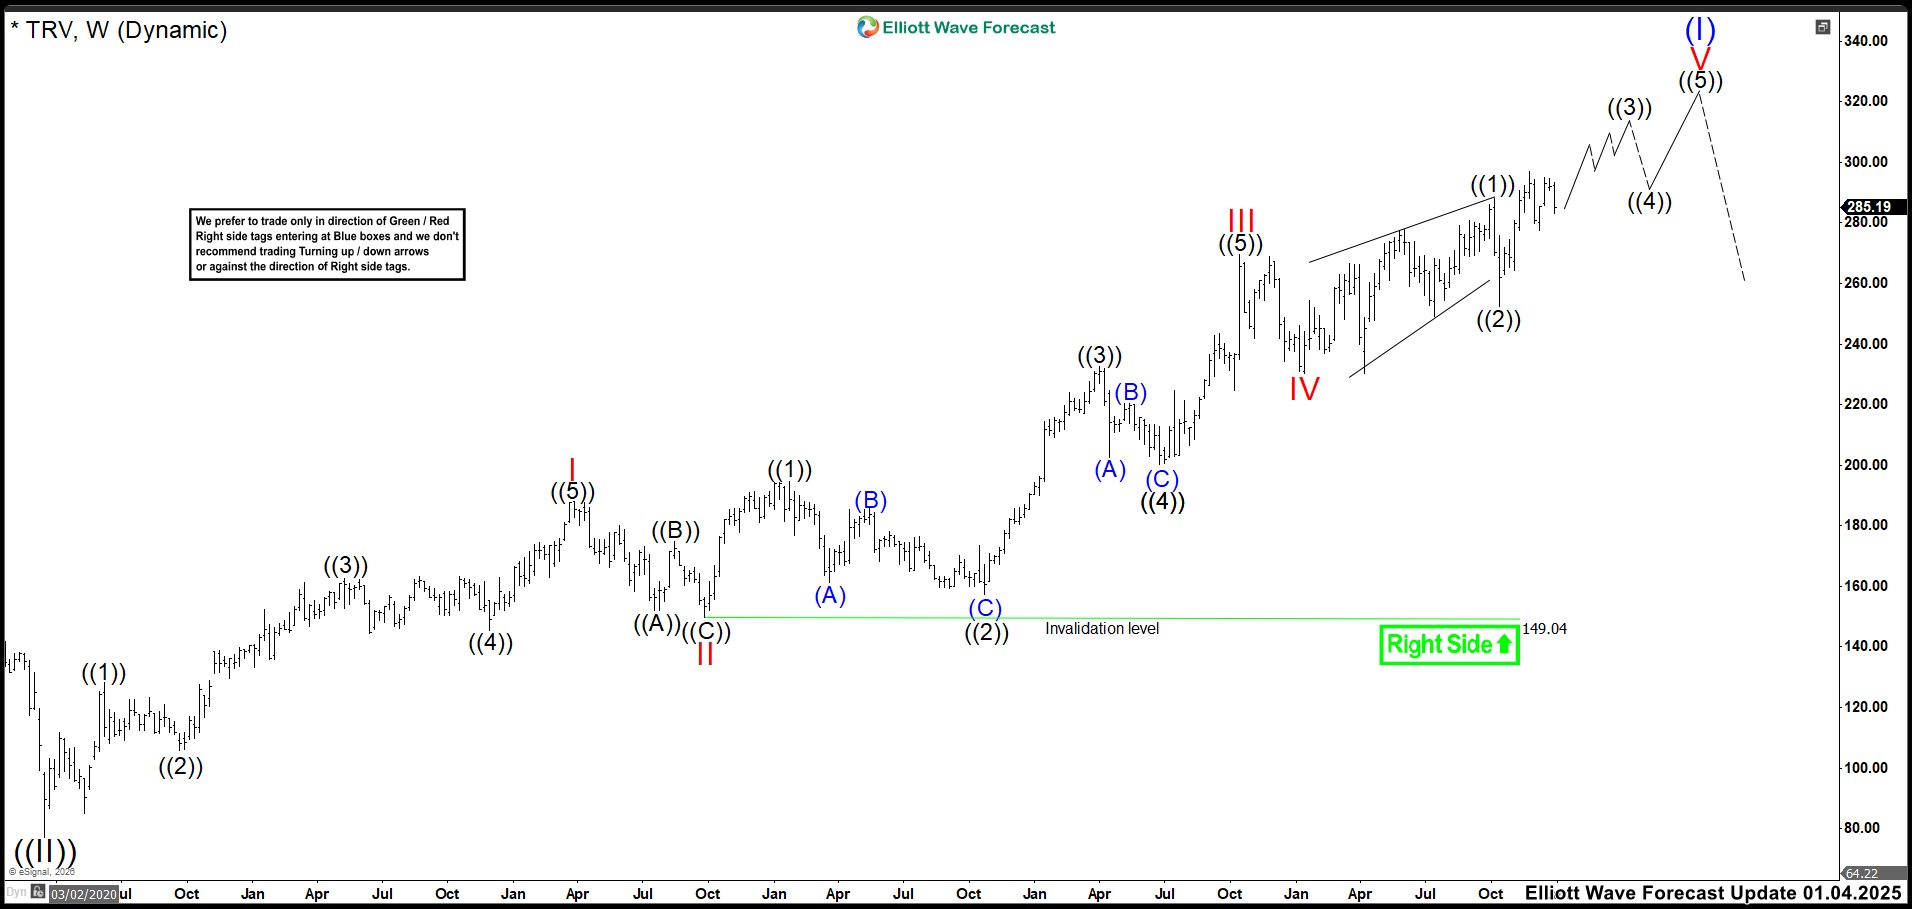
Elliott Wave Outlook: TRV Weekly Chart January 2026

Elliott Wave Outlook: TRV Weekly Chart January 2026

In the last TRV update, the market completed the diagonal and reacted lower as expected. However, that decline turned out to be only a correction because the market quickly broke to new highs. This shift meant the move from the wave IV low formed a leading diagonal, which we labeled as wave ((1)). The October decline corresponded to wave ((2)), and price was trading in wave ((3)) of V.
Therefore, we expected more upside to complete wave ((3)) and eventually finish the impulse of wave V. Even so, there was still a chance that wave V was unfolding as an ending diagonal. This depended on how high wave ((3)) could reach and how deep the pullback in wave ((4)) would become. If wave ((3)) failed to create enough upward separation and wave ((4)) produced a deep correction without breaking below the wave ((2)) low, then the structure remained an ending diagonal. This scenario still supported more upside, although with a less aggressive path.
(If you want to learn more about Elliott Wave Principle, please follow these links: Elliott Wave Education and Elliott Wave Theory.)

Elliott Wave Principle Behind the Market Structure​

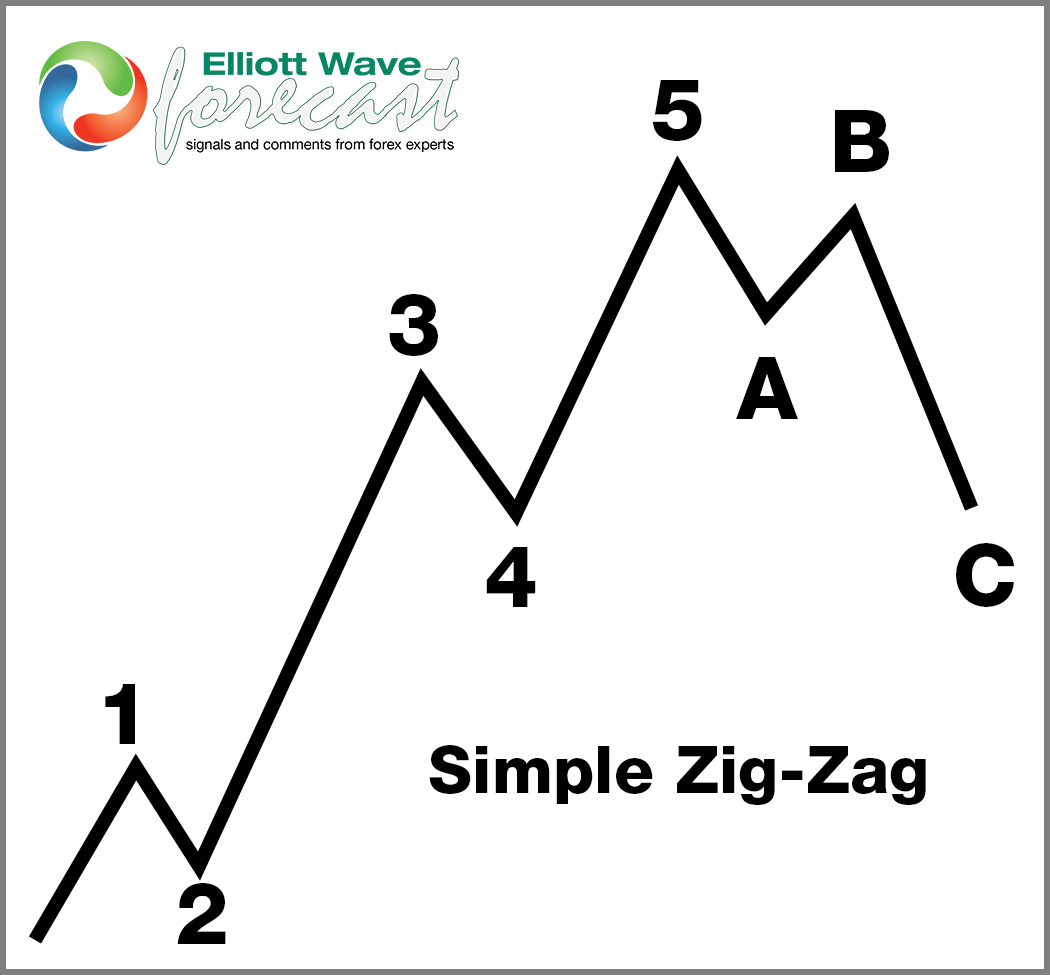
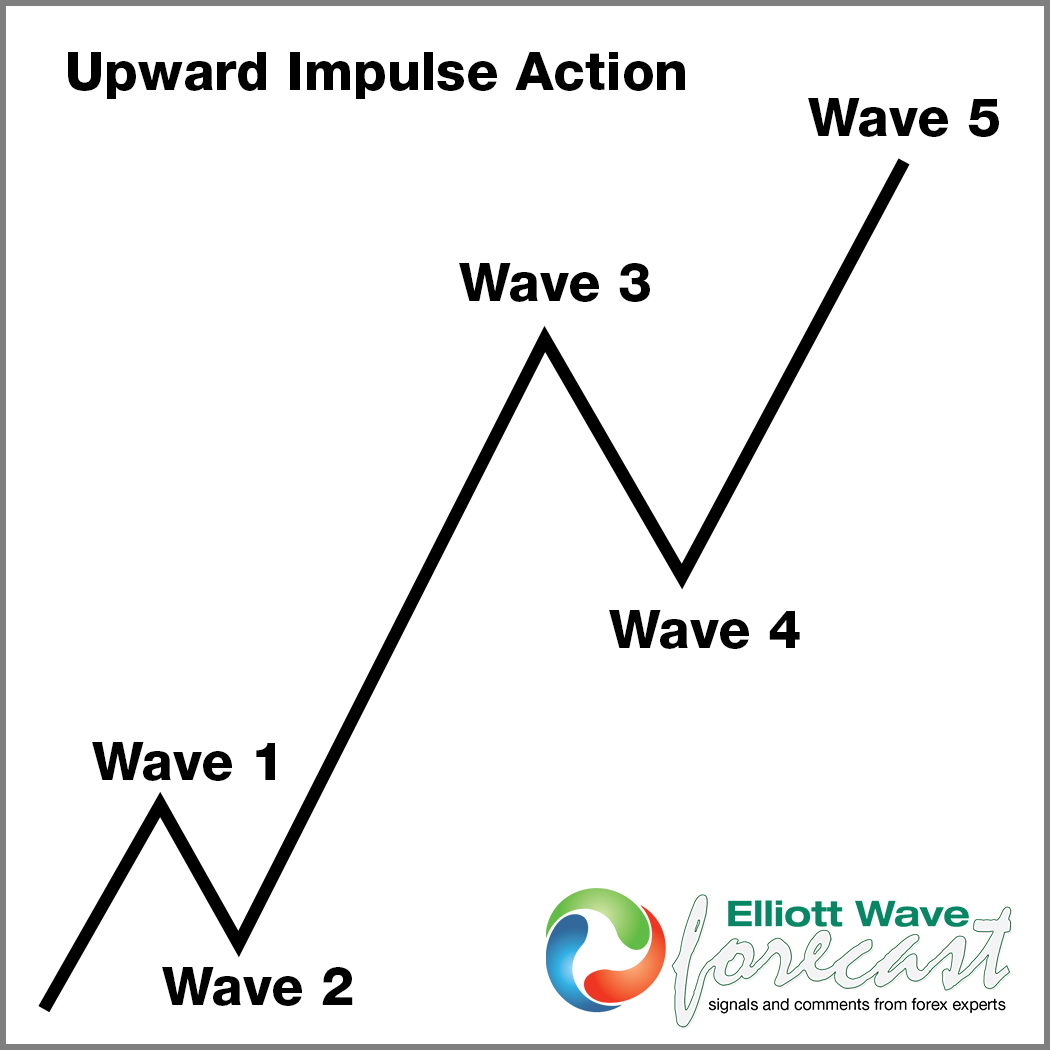
Impulse

An impulse is a clean 5‑wave pattern that drives the trend forward.
  • Waves 1‑3‑5 are strong and directional.
  • No overlap between waves 1 and 4.
  • Wave 3 is usually the strongest.
  • Structure is clear, with increasing momentum.
Elliott Wave Principle Behind the Market Structure

Elliott Wave Outlook: TRV Weekly Chart May 2026

Elliott Wave Outlook: TRV Weekly Chart May 2026

In this new update, we see the market holding higher but without enough separation to confirm wave ((3)). Instead, TRV still appears inside an ending diagonal for wave V. Until price breaks strongly higher, the market keeps rising but loses momentum, suggesting a possible correction soon.
For now, the ideal structure calls for one more high to complete the ending diagonal and start a deeper correction. However, this idea changes if the market delivers a strong bullish move. That surge would revive the cycle and extend prices higher without a near‑term correction.
Source: https://elliottwave-forecast.com/stock-market/trv-setting-pullback/
 
In this technical blog, we will look at the past performance of the 1-hour Elliott Wave Charts of Bitcoin ticker symbol: BTCUSD. In which, the rally from the 29 April 2026 low unfolded as an impulse structure. Showing a higher high sequence in larger time frame charts favored more upside extension to take place. Therefore, we advised members not to sell the pair & buy the dips in 3, 7, or 11 swings at the blue box areas. We will explain the structure & forecast below:

Bitcoin 1-Hour Elliott Wave Chart From 5.07.2026​

Bitcoin Smoothly Reacts Higher from Blue Box Zone


Here’s the 1-hour Elliott wave chart from the 5.07.2026 New York update. In which, the cycle from the 4.29.2026 low ended in wave 1 at $82833 high. Down from there, the BTCUSD made a pullback in wave 2 to correct that cycle. The internals of that pullback unfolded as Elliott wave zigzag structure where wave ((a)) ended at $80728 low. Wave ((b)) bounce ended at $81706 high and wave ((c)) managed to reach the blue box area at $79625- $78331. From there, buyers were expected to appear looking for the next leg higher or for a 3 wave bounce minimum.

Bitcoin Latest 1-Hour Elliott Wave Chart From 5.12.2026​

Bitcoin Smoothly Reacts Higher from Blue Box Zone


This is the latest 1-hour Elliott wave Chart from the 5.12.2026 Asia update. In which the Bitcoin is showing a reaction higher taking place, right after ending the zigzag correction within the blue box area. Allowed members to create a risk-free position shortly after taking the long position at the blue box area. However, a break above $82833 high is needed to confirm the next leg higher towards $87072- $91961 target area.

Source: https://elliottwave-forecast.com/bluebox-wins/bitcoin-smoothly-reacts-higher-from-blue-box-zone/
 
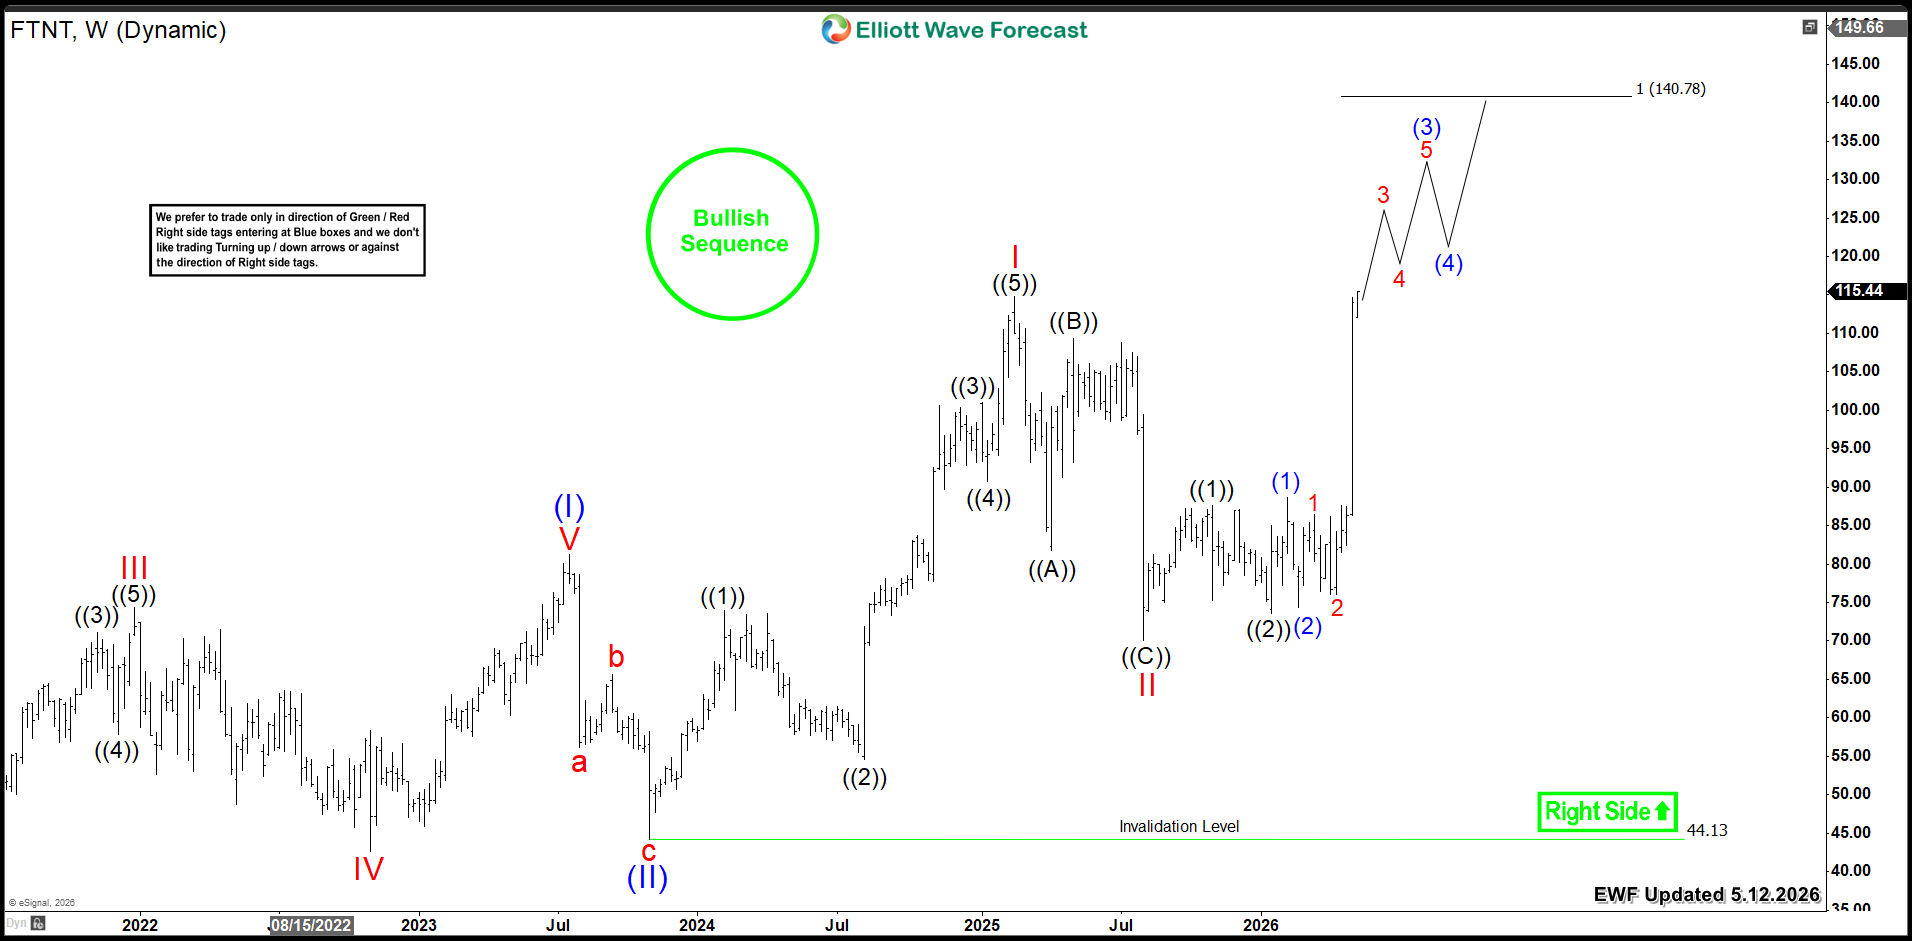
Fortinet (NASDAQ: FTNT) resumed its bullish trend and broke to new all-time highs. Today, we dive into its weekly technical chart. Our analysis explores the Elliott Wave structure and projected target for the current cycle.

Looking at Fortinet's weekly chart, the stock ended a major three-wave correction in wave (II). This bottom occurred in 2023 at $44. Then, a new bullish cycle began.

FTNT rallied within wave I, peaking at 114. Subsequently, wave II corrected lower to 70. From there, the stock resumed its rally within wave III. This established a nesting structure from the lows. The strong third wave is currently unfolding as the stock is accelerating to the upside after breaking above its 2025 peak. It should extend higher through a series of third and fourth waves.

Fortinet holds a bullish sequence from its 2023 low. The minimum target is within the equal legs area $140. However, wave III could extend further toward the golden ratio at $180.

Fortinet FTNT Weekly Chart 5.12.2026​

Fortinet FTNT Weekly 5.12.2026

Conclusion​

Fortinet's (FTNT) bullish cycle remains in progress. The stock is looking for further upside extension. Therefore, investors should target buying opportunities within daily pullbacks.

Source: https://elliottwave-forecast.com/stock-market/fortinet-ftnt-bullish-breakout-toward-140/
 
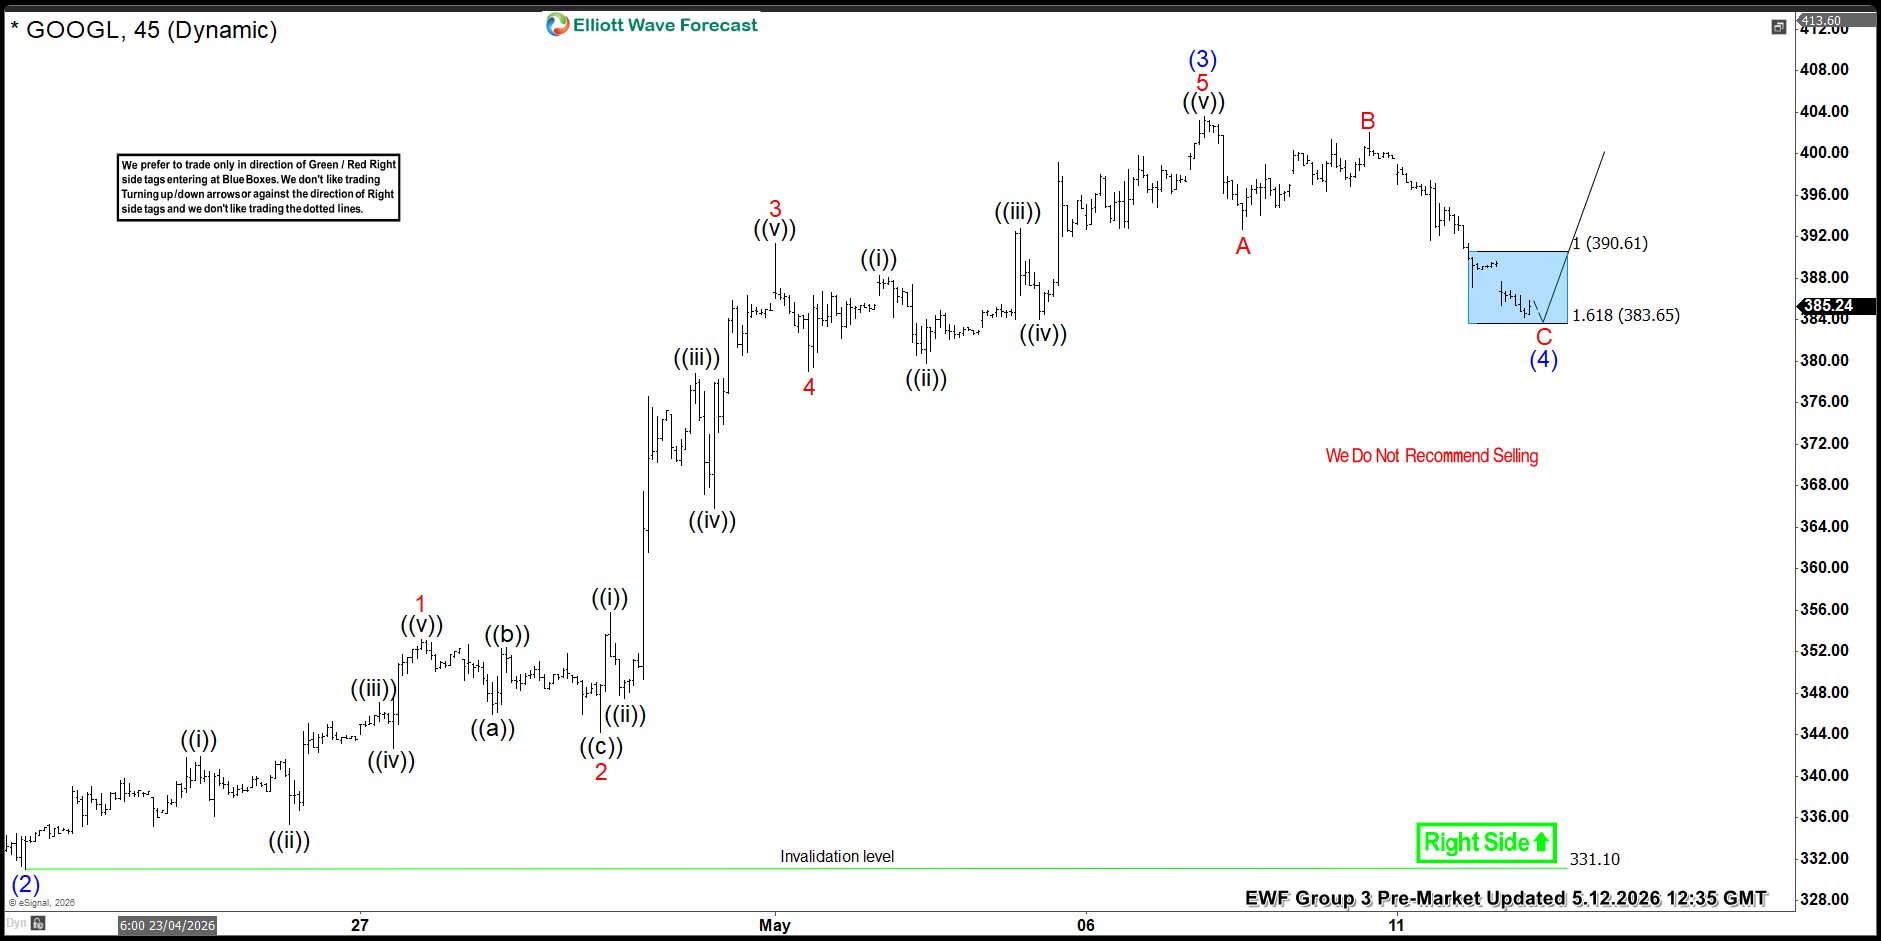
In this Elliott Wave update, we look at the latest structure in Alphabet Inc. ($GOOGL). The stock continues to show an incomplete 5 wave impulse from the 3/30 low, which suggests that the current pullback should remain corrective before the next leg higher resumes. As a result, the Blue Box Area is standing out as the next buying opportunity, with wave (4) expected to finish there in 3 swings before wave (5) pushes higher.

5 Wave Impulse + ABC correction​

$AMD

$GOOGL Showing Incomplete 5 Wave Impulse From 3/30 Low​

$GOOGLLooking at the 1-hour chart, $GOOGL started a clear impulsive rally from the 3/30 low. Since then, the stock has advanced in a bullish sequence, forming higher highs and higher lows in a structure that still looks incomplete.

More importantly, the rally appears to be unfolding as a 5 wave impulse. Waves 1, 2, and 3 appear to be in place, and the market is now correcting that advance in wave 4. Therefore, the current dip is viewed as a pullback within an ongoing bullish sequence rather than the start of a larger bearish turn.

Wave 4 Pullback Developing in 3 Swings​

At this stage, the pullback from the recent high looks corrective and is unfolding in 3 swings as an A-B-C structure. This matters because fourth waves often retrace in a corrective pattern before the trend resumes in wave 5.

Consequently, sellers have been able to push price lower in the short term, but the structure still favors a buying opportunity rather than a bearish continuation. As long as the sequence from the 3/30 low remains valid, the preferred view continues to call for another push higher.

Blue Box Area Offering Buying Opportunity​

Most importantly, the Blue Box Area between 390.61 and 383.65 marks the next high-frequency support zone. This is where wave 4 is expected to end and where buyers can look to re-enter in the direction of the main trend.

Typically, Blue Box Areas represent extreme zones where corrective pullbacks tend to finish. In this case, if $GOOGL reaches that support region, buyers can appear and trigger the next advance in wave 5.

Therefore, we favor the long side from the Blue Box as long as price action confirms support in that area.

Wave 5 Expected Before Larger Correction​

Once wave 4 finishes, $GOOGL should resume higher in wave 5 to complete the entire 5 wave impulse from the 3/30 low. That would mark the end of the current bullish cycle from that low.

After wave 5 completes, traders should then be aware that a larger correction can take place against the 3/30 low. In other words, the market still has room to extend higher first, but once the 5-wave structure finishes, the stock can enter a broader corrective phase.

For that reason, the current setup remains bullish in the short term, while the next larger correction should only be expected after wave 5 ends.

Near-Term Outlook for $GOOGL​

In the near term, the focus remains on the wave 4 pullback into the Blue Box Area. If buyers respond there as expected, $GOOGL can resume the rally and extend to new short-term highs in wave 5.

Meanwhile, the broader bullish sequence remains valid as long as the stock stays above the 331.10 invalidation level. Accordingly, dips into support should continue to attract buyers while the right side remains higher.

Technical Summary​

To summarize, $GOOGL is showing an incomplete 5 wave impulse from the 3/30 low. The current decline is viewed as a wave 4 pullback unfolding in 3 swings, and the Blue Box Area at 390.61–383.65 is the next key buying zone.

From there, buyers can appear and drive the stock higher in wave 5 to complete the 5-wave impulse. After that, a larger correction against the 3/30 low can take place.

Source: https://elliottwave-forecast.com/st...uying-opportunity-as-wave-4-pullback-unfolds/
 
PANW has maintained a very strong bullish sequence from the June 2013 low. The strong 5-wave sequence appears to be in the final lap. While the 5th wave could extend to prices above $300, how could traders take advantage?

Palo Alto Networks (NASDAQ: PANW) is a global cybersecurity leader providing advanced network security, cloud protection, and AI-driven threat detection solutions for enterprises and governments worldwide. The company helps organizations secure digital operations across cloud, hybrid, and on-premise environments through its integrated platforms and automation tools. PANW has remained one of the strongest names in the cybersecurity sector.

PANW Elliott Wave Analysis - Weekly Chart

The weekly chart above displays a robust impulse wave sequence originating from the June 2013 low. Following this, wave I concluded at the July 2015 high. Subsequently, a 7-swing correction characterized wave II, concluding in March 2017. Beginning from the March 2017 low, wave III initiated and completed a clear impulse wave sequence, with its 5th wave structured as an ending diagonal. Wave III peaked in October 2025, establishing a record high for the stock, with a highly probable breach anticipated soon. The subsequent wave IV pullback seems shallow; however, the ensuing resurgence suggests the price is currently within wave V.

panw


At the end of wave V, the stock will complete the impulse cycle from June 2013 in wave (I), which will then be followed by a deep correction in (II). The Elliott Wave analysis suggests a near-exhausted move, something long-term investors should be aware of. In the coming months, buyers could start exiting positions and taking profits, potentially leading to a significant pullback. However, wave V appears to be still in its early stages. We can currently confirm the emergence of wave ((1)) of I, which seems to be in the 3rd wave.

We anticipate wave ((1)) to break to a new high before wave ((2)) begins. This is because the 3rd wave of ((1)) is already near its top, making it relatively easy for wave ((1)) to establish a new record high. So, after this potential breach, what should we expect next?

How Should Traders Engage PANW

If wave ((1)) breaks above wave III as anticipated, medium-term traders can look to buy dips at the extreme of wave ((2)). We anticipate the February 23rd low to provide necessary support for the development of wave V. Below the February 23rd low, we could see an early indication of (II), particularly if a new high was achieved beforehand. If not, we will consider wave IV to be lower and buy at its extreme. Since wave IV is currently shallow, we cannot rule out a deeper correction until a new high is reached. Overall, the upside should remain. Thus, traders should buy the dips off wave ((2)) ideally or a deeper IV if by the slight chance it didn't make a new high prior.

Source: https://elliottwave-forecast.com/stock-market/panw-elliott-wave-forecasting-300/
 
The Blackstone Inc, BX has hit a major support zone amid an all-time bullish cycle from February 2009. Thus, buyers could be looking forward for another big bullish cycle.

Blackstone Inc. (NYSE: BX) is one of the world’s largest alternative asset managers, specializing in private equity, real estate, credit, hedge fund solutions, and infrastructure investments. The company manages hundreds of billions in assets globally and is widely recognized for its influence across financial markets and long-term investment strategies.

BX Long Term Elliott Wave Forecast - Monthly Chart

BX


BX, long term, has been very bullish. A strong impulse wave emerged from February 2009. Wave I ended in October 2009 before being corrected in wave II. Wave II closed in July 2010. From the low of July 2010, a big and extended wave III followed all the way to the top of November 2004. Meanwhile, with such an extended 3rd wave, the count allows for differing interpretations. However, the path is very clear. From the top of wave III, the pullback for wave (IV) followed. Wave IV appears to still be emerging. However, it has evolved in a corrective structure and hit a major blue box zone. From this 109.4-77.78 zone, traders can anticipate wave V to begin.

At the end of wave V, the bullish cycle should finish and then BX price should turn lower for a multi-year bearish cycle to correct it. Why do I think the bullish cycle from the year 2009 hasn't finished yet? Simple. That's because the current pullback is the 12th swing from the low of February 2009. From the Elliott wave perspective, impulse wave evolves in 5, 9, 13, 17, 21 ... sequences. This indicates that at least one more leg should happen higher to complete 13-wave sequence which happens to be the minimum at this stage. If 13-waves fails, then it extends to 17-waves before the price start correcting the cycle from February 2009.

Meanwhile, our attention will be on this pullback - current wave IV. At the blue box, we should expect wave V to evolve to $300 or higher. Alternatively, a 3 or 7 swing corrective bounce could emerge instead, leading to a double and deeper wave IV correction. Which ever of these the market will validate in the coming months, traders and investors can take a long term bullish positions off this zone. Medium term and swing traders can wait for a strong 5-wave reaction on the daily chart and then buy the dip from the extreme of a 3 or 7 swing structure.

Source: https://elliottwave-forecast.com/st...ox-support-to-resume-long-term-bullish-trend/
 

Triangle Within Wave (B) Suggests One More Dip Before Bullish Continuation.​

Intercontinental Exchange (ICE) continues to maintain a strong bullish Elliott Wave structure despite the recent consolidation. The stock has developed a clear impulsive advance over the last several years, supported by higher highs and higher lows across multiple time frames. The broader trend remains bullish, and the current pullback appears corrective rather than impulsive.

From the chart, ICE completed a strong five-wave rally into wave ((3)), which marked an important high within the larger bullish cycle. Following this advance, the stock entered a corrective phase labeled as wave ((4)). The correction currently appears to be unfolding as an A-B-C structure rather than a completed pattern. Within wave (B) of wave ((4)), the market has developed a contracting triangle formation labeled A-B-C-D-E. This overlapping structure reflects a period of consolidation and contracting volatility before the next directional move begins.

ICE_2026-05-14_06-37-17-scaled.png

ICE Wave ((4)) Outlook and Bullish Recovery Potential​

Once the triangle within wave (B) completes, ICE should decline again in wave (C) of ((4)) before ending the correction. Based on the projected structure from the chart, wave ((4)) could complete somewhere around the 133.36 area before the stock turns higher again. This region aligns with an important support zone and may provide the foundation for the next bullish phase. After wave ((4)) completes, ICE should resume higher in wave ((5)) and continue the larger bullish trend. This next impulsive leg could eventually push price toward fresh highs above the prior wave ((3)) peak.

In the short term, traders should continue monitoring the triangle boundaries closely as the final swings develop. However, the broader bullish trend remains intact as long as the stock stays above the major invalidation level near 58.84.

Summary:​

Intercontinental Exchange remains in a long-term bullish Elliott Wave trend, with wave ((4)) correction unfolding at this moment. Once this consolidation completes, ICE should resume higher in wave ((5)) and target new highs. As long as price remains above 58.84, the bullish outlook stays intact.

Source: https://elliottwave-forecast.com/st...-ice-elliott-wave-analysis-wave-4-correction/
 
Pool Corporation (POOL) remains within a larger bullish Elliott Wave structure despite the sharp decline from its 2021 peak. The stock completed a strong impulsive rally into wave (I) after a powerful advance from the 2009 lows. This move reflected strong momentum and consistent buying pressure over several years.

After completing wave (I), POOL entered a larger corrective phase in wave (II). The decline has unfolded through a complex corrective structure and continues to pressure price lower. From the chart, the correction still appears incomplete, suggesting the stock may need one more leg lower before wave (II) fully ends. The current structure shows the market progressing through the later stages of the correction. Price has already delivered a substantial decline from the highs, but the Elliott Wave sequence still favors additional downside before a durable bottom forms.

POOL_2026-05-12_05-56-04-scaled.png

POOL Wave (II) Support Zone and Wave (III) Outlook​

Based on the projected structure, wave (II) may extend toward the 123 region before finding stronger support. This level aligns with a key Fibonacci projection and marks an important technical area where buyers could return. The chart also suggests the decline may complete a larger five-wave sequence before the correction finishes.

In the short term, the market may continue to experience volatility and downside swings. However, once wave (II) completes near the projected support zone, the stock should begin a new bullish cycle in wave (III). Third waves often represent the strongest phase within an Elliott Wave structure and usually generate sustained upside momentum.

The long-term bullish trend remains valid as long as the broader structure holds above the major invalidation level near 8.76.

Summary​

Pool Corporation continues to correct within wave (II) after completing a major bullish cycle in wave (I). The decline may extend toward the 123 area before wave (II) completes. Once the correction ends, a strong bullish recovery in wave (III) should begin and support renewed upside over the long term.

Source: https://elliottwave-forecast.com/st...ool-elliott-wave-analysis-wave-ii-correction/
 
Hello traders, and welcome back to my blog. Today we’re diving into the XLY ETF—what it represents, how the EWF team has successfully forecasted and traded it, and what we anticipate moving forward. Let’s jump right in.

What is the ETF All About?

The XLY is the ticker symbol for the Consumer Discretionary Select Sector SPDR Fund, one of the most popular exchange-traded funds (ETFs) used to track the performance of the U.S. consumer discretionary sector.

XLY is managed by State Street Global Advisors and focuses on S&P 500 companies such as Amazon and Tesla. These are businesses in the consumer discretionary sector—selling “non‑essential” goods and services like cars, luxury products, and vacations that people typically buy when they have extra disposable income.

Why Investors Use It?

Economic Indicator:
XLY is often watched as a barometer for the health of the U.S. consumer. When XLY is rising, it typically suggests consumers feel confident enough to spend on discretionary items.

Growth Exposure: With heavy weights in Amazon and Tesla, it often behaves more like a growth fund than a traditional retail fund.

Tactical Trading: Traders use it to "rotate" into or out of the consumer sector based on interest rate changes or economic cycles.

Forecasting the Bounce in the Blue box

Today we’re revisiting how our Elliott Wave technical analysis precisely identified the recent bottom in XLY, giving our members the chance to benefit from the ensuing recovery. In trading, timing is everything. On March 22, 2026, we highlighted a clear corrective sequence unfolding in the XLY daily chart. As illustrated below, the ETF was completing a complex double‑three (W‑X‑Y) correction from its early‑2026 highs.

XLY-daily-22-march-weekend-after.png


At that point, our forecast was highly specific. We marked out a “Blue Box”—our high‑frequency trading zone where supply and demand typically balance, making a reversal highly probable—between 108.29 and 101.53. Alongside this, our charts carried a clear message: “We Do Not Recommend Selling.” The green “Right Side” arrow pointed decisively higher, underscoring that as long as the invalidation level at 86.05 remained intact, the next major move was expected to unfold to the upside.

What Is The W-X-Y Structure?

The W‑X‑Y structure is a sideways corrective pattern formed by combining two distinct corrections. Most traders are familiar with individual corrective patterns such as Zigzags, Flat corrections, and Triangles. When two of these patterns are linked together, the result is a double three—commonly labelled W‑X‑Y. Example below image.

WXY-Structure.jpg


The Result: Precision in Action

Fast forward to our update on May 10, 2026. Looking at XLY daily chart image below, you can see exactly how the price action respected our technical boundaries.

XLY-daily-10-may-weekend-after.png


XLY entered the Blue Box exactly as projected, tagging the upper boundary of our target zone before finding strong support. Almost immediately, the ETF completed its “Y” wave correction within that Blue box area and launched into a sharp impulsive rally. The recovery confirmed our forecast, and with price now trading back above the 120.00 level, it validates that our “Right Side” bias was correct all along.

Why It Matters?

By utilizing Elliott Wave Theory, we don't just guess where the market is going; we identify areas of high-probability exhaustion. In this case, the Blue Box gave our members a clear "buy the dip" opportunity while the rest of the market was likely fearing further breakdowns.

The consumer discretionary sector has shown incredible resilience, and by staying on the right side of the trend, we were able to navigate the volatility with confidence.

What to expect of the ETF going Forward?

As long as the ETF holds above 105.19, any pullbacks in 3 or 7 swings should remain supported, setting the stage for the next leg higher targeting 144.21 – 168.32 area.

Conclusion

The XLY ETF has been a textbook example of how Elliott Wave + disciplined execution can deliver clarity and risk‑controlled trading outcomes. By focusing on high‑probability areas and respecting the larger structure, the EWF Team has successfully forecasted and traded this instrument—and we remain positioned for what comes next.

At Elliottwave Forecast (EWF), we deliver consistent market updates through regular charts update. Our analysts update 1‑hour charts four times daily and 4‑hour charts once per day across all 78 instruments. In addition, we host five live sessions each day and maintain a 24‑hour chatroom, providing clients with real‑time market guidance and answers to any questions they may have.

Source: https://elliottwave-forecast.com/bluebox-wins/xly-bouncing-from-blue-box/
 
Visa (V) shows strong momentum heading into next quarter. Analysts expect higher revenue and EPS, supported by rising payment volumes and steady cross‑border activity. Moreover, Visa keeps beating estimates, which strengthens confidence in continued earnings growth. Stablecoin-linked payments also expand quickly, adding a new growth driver.

Next quarter may deliver another solid performance. Estimates call for EPS near $3.21–$3.22 and revenue above $11.3B, according to analyst projections. Transaction volume trends remain positive, and value‑added services grow fast. Therefore, Visa enters the next quarter with strong fundamentals and improving sentiment.

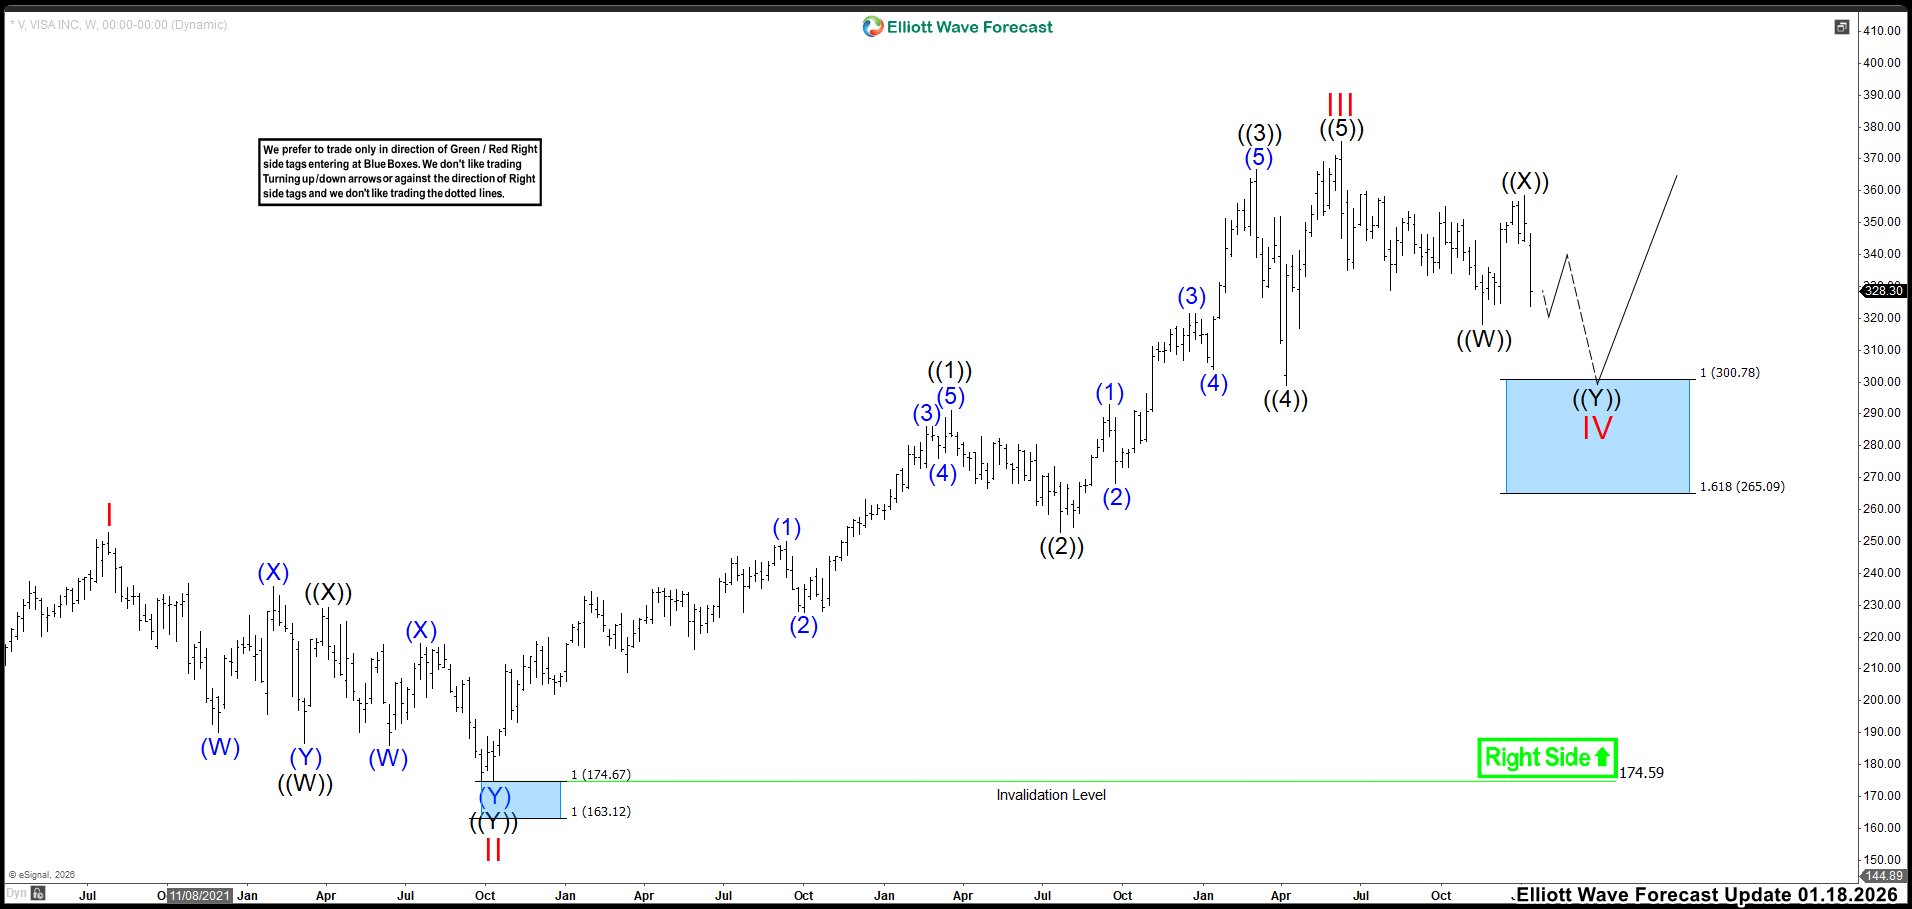
Elliott Wave Outlook: VISA (V) Weekly Chart January 2026​

Elliott Wave Outlook: VISA (V) Weekly Chart January 2026


In the last update, we noted that the market had broken below $328.70 in November, which indicated that wave IV had already started. Because of that break, we labeled the structure as a double correction. Wave ((W)) defined the November low, wave ((X)) defined the January 2026 high, and we anticipated three additional waves lower to complete the pattern before the bullish trend resumed.

We expected the next bounce to unfold as a corrective move, allowing one more leg down into the blue box at 300.78–265.09. To confirm this view, the market needed to break the November low. That break would have created a strong opportunity to buy Visa (V) again.

(If you want to learn more about Elliott Wave Principle, please follow these links: Elliott Wave Education and Elliott Wave Theory.)

Elliott Wave Principle Behind the Market Structure​

Impulse

An impulse is a clean 5‑wave pattern that drives the trend forward.

  • Waves 1‑3‑5 are strong and directional.
  • No overlap between waves 1 and 4.
  • Wave 3 is usually the strongest.
  • Structure is clear, with increasing momentum.
Elliott Wave Principle Behind the Market Structure


Elliott Wave Outlook: VISA (V) Daily Chart May 2026​

In this new update, we saw the market react higher from the blue box as expected. However, the price action in Visa remained unclear, and the market needed to break key levels to define the next scenarios. First, Visa needed to break above the 342.06 high to complete five waves up from the 293.76 low and form an impulsive structure as wave ((1)). In that case, we expected the low labeled as wave IV to hold during a pullback as wave ((2)), followed by a continuation higher.

But if the market failed to break that high, it could continue lagging in price and potentially move lower. In that scenario, the market could break below the 293.76 low, following the orange path, and extend toward the 277.17–237.29 area to correct the cycle from the 2022 low. If that happened, the market would have offered a strong opportunity to buy Visa shares again.

Source: https://elliottwave-forecast.com/stock-market/visa-v-near-term-price-action-enters-twilight-zone/
 
Cameco Corporation (CCJ) is one of the world’s largest uranium producers, headquartered in Saskatoon, Canada, and a key supplier of nuclear fuel used for electricity generation worldwide. With major mining operations such as Cigar Lake and McArthur River, along with strategic assets in fuel services and nuclear technology through Westinghouse, Cameco plays a central role in the global nuclear energy supply chain, benefiting from rising demand for clean, low‑carbon power.

Cameco ($CCJ) Monthly Elliott Wave Chart​

Cameco20260518082706.jpg


The monthly Elliott Wave chart for Cameco (CCJ) shows that wave (II) of the Super Cycle bottomed at $5.17 in March 2020. From that low, the stock launched into a powerful impulsive advance in wave (III), unfolding as a triple nest. Wave I of (III) peaked at $62.55, followed by a corrective wave II that retraced to $35. The next nesting sequence carried prices higher, with wave ((1)) topping at $110.16 and wave ((2)) pulling back to $77.70. The advance then resumed, with wave (1) of ((3)) of III reaching $96.57, and the subsequent wave (2) correction proposed complete at $100.11. As long as price holds above this level, CCJ is expected to continue extending higher within wave (III).

Cameco ($CCJ) Monthly Alternate Elliott Wave Chart​

Cameco-Alternate20260518084347.jpg

The monthly alternate Elliott Wave chart of Cameco (CCJ) suggests that the Super Cycle wave I concluded at $135.24. This completed a five‑wave advance from the March 2020 low. The stock is now positioned for a larger degree correction in wave II of the Super Cycle. It should unfold in either three or seven swings before resuming its upward trend. Within this alternate view, CCJ may decline toward the $74.60–$96.00 zone. This is the area where buyers are anticipated to emerge for renewed strength or at least a three‑wave rally. This area aligns with the 100%–161.8% Fibonacci extension of wave ((Y)) relative to wave ((W)).

$CCJ Daily Elliott Wave Chart​

Cameco-Daily20260518083812.jpg


The daily Elliott Wave chart of Cameco (CCJ) shows the primary view that the ETF is advancing in a triple nest from the March 2020 low. Wave II completed at $35.57, setting the stage for a strong rally in wave III in a nested sequence. From the wave II low, wave ((1)) peaked at $110.16, followed by a corrective wave ((2)) that ended at $77.70. The next advance carried CCJ higher with wave (1) reaching $135.24. The subsequent pullback in wave (2) completed at $100.11. As long as price holds above $100.11, the ETF is expected to find support and continue higher. A break below $100.11, however, would signal that the alternate scenario outlined earlier is in play.

Source: https://elliottwave-forecast.com/stock-market/cameco-ccj-may-see-short-term-support-soon/
 
The current trajectory of the semiconductor market suggests a significant "changing of the guard" in the AI sector, as capital rotates from the first-wave GPU dominance of Nvidia into the foundational infrastructure plays of Intel (INTC) and AMD. This shift is not merely a product of market sentiment but is deeply reflected in the technical structures of the current rally. From an Elliott Wave perspective, Intel appears to be transitioning out of a multi-year corrective phase and into a powerful Wave 3 rally, driven by the structural validation of its strategies and landmark foundry agreements. Our INTC blog back in 2020, called for the same rally to take place and it is finally happening 4-5 years later. Let's take a look at the montly and daily charts to dissect the most recent rally.

INTC (Intel) Long-term Elliott Wave Analysis​

INTC (Intel) ended a major correction back in 2009 and rallied impulsively to a high of $59.59 in April 2019. We labelled this rally as wave I of a bullish wave (III). It then started a pull back which took the form of an expanded FLAT Elliott wave correction and retraced more than 76.4% of wave I rally. Wave II completed back in April 2025 and since then it has gained over 700% and appears to be still within wave ((3)) or within wave ((4)) of III. 261.8% Fibonacci extension of wave I - II comes at 144.07 and is the ideal area to complete wave III.

INTC Monthly Chart Elliott Wave Analysis


INTC (Intel) Daily Chart Elliott Wave Analysis​

Daily chart of Intel below shows structure of the rally up from April 2025 wave II low. Wave ((1)) ended at $43.28, wave ((2)) completed at $34.95, wave (1) of ((3)) completed at $54.60, wave (2) of ((3)) completed at $40.63, wave (3) of ((3)) completed at $132.75 and we are currently in wave (4) pull back, once completed, it should look for a new high to end wave ((3)) before pulling back in wave ((4)) and resuming the rally to complete the cycle from April 2025 low.

INTC Interl Daily Chart Elliott Wave Analysis


2026 Performance (Year-To-Date)​

We can see Intel (INTC) has gained 240% Year-to-date and is in 2nd place behind Micron (MU) which has gained 750% year-t0-date whereas NVDA is in last place having gained only 15% year-t0-date due to saturated market and China not buying advanced NVDA chips despite US government clearance

INTC, AMD, MU and NVDA performance comparison


Source: https://elliottwave-forecast.com/st...the-underdogs-are-finally-winning-the-ai-war/
 
Home Depot (NYSE: HD), the largest U.S. home improvement retailer, will report quarterly earnings tomorrow. The company’s performance often serves as a barometer for economic conditions because of its exposure to spending, housing activity, and construction demand. Over the past year, Home Depot has faced elevated interest rates, slowing home sales, and cautious discretionary spending. These factors have weighed on renovation projects. Despite the challenges, the retailer continues to benefit from strong market leadership, a robust contractor business, and steady demand for essential maintenance products.

Analysts and investors will closely monitor comparable store sales, consumer traffic, margins, and forward guidance. Particular emphasis will be placed on whether demand is stabilizing after several quarters of softer home improvement activity. A stronger-than-expected report could signal improving consumer confidence and renewed housing-related spending, potentially lifting sentiment across retail and housing sectors. Conversely, weaker guidance or declining sales may reinforce concerns that high borrowing costs and economic uncertainty remain significant headwinds. As a result, Home Depot’s earnings release may serve as an important indicator not only for the company but also for the broader U.S. economy.

From a technical perspective, the Elliott Wave outlook remains constructive for Home Depot ($HD). Within the Grand Super Cycle degree, the stock has advanced in an impulsive sequence or potentially a bullish nest since the lows of the financial crisis. Both the primary and alternate counts suggest that the current decline represents a larger corrective phase. We labelled the pullback as wave (IV), unfolding within a High-Frequency Blue Box area. From this region, the expectation is for the stock to resume its broader bullish trend and ultimately reach new all-time highs into 2026.

Home Depot (HD) Quarterly Elliott Wave Chart​

HD-Weekly20260518162108-1024x508.jpg


Under Elliott Wave Theory, an impulse consists of a five-wave structure in the direction of the main trend. Waves 1, 3, and 5 subdivide into five waves. Meanwhile waves 2 and 4 unfold as corrective patterns against the trend. At the moment, Home Depot appears to be finishing wave (IV), which is taking shape as a simple ABC correction. Typically, this structure follows a 5-3-5 internal sequence. In addeition, it tends to terminate near the 100%–161.8% Fibonacci extension of waves ((A)) and ((C)). The current decline has now entered that key extension zone, reinforcing the probability that the correction is approaching completion.

The following chart highlights the wave (IV) structure together with the High-Frequency Blue Box buying area. Historically, these regions have provided high-probability reaction zones where institutional buyers tend to re-enter the market. While Elliott Wave Theory is often criticized for its subjectivity, our approach combines sequence analysis, High-Frequency Blue Boxes, and a proprietary pivot system to improve trend validation and identify statistically favorable areas.

Home Depot Weekly Elliott Wave Chart​

HD-Weekly20260518171931-1024x508.jpg


As a result, buying Home Depot ahead of earnings while the stock trades within this support zone offers a favorable risk-to-reward profile. At minimum, the setup favors a meaningful bounce, while the larger bullish scenario suggests the possibility that the next major rally toward new all-time highs may already be beginning.

Source: https://elliottwave-forecast.com/st...ead-of-the-earning-new-all-time-highs-coming/
 
In this technical blog, we will look at the past performance of the Daily Elliott Wave Charts of SPY. In which, the rally from 07 April 2025 low ended in an impulse sequence & showed higher high sequence in weekly structure therefore, called for an extension higher to take place. We knew that the structure in SPY should remain supported & extend higher. So, we advised members not to sell the ETF & buy the dips in 3, 7, or 11 swings at the blue box areas. We will explain the structure & forecast below:

SPY Daily Elliott Wave Chart From 3.29.2026​

SPY Launches Strong Bullish Rally from Blue Box Zone


Here’s the Daily Elliott wave Chart from the 3.29.2026 Weekend update. In which, the rally to $697.84 high completed wave ((1)) & made a pullback in wave ((2)) to correct the cycle from 4.07.2025 low. The internals of that pullback unfolded as Elliott wave double three correction where wave (W) ended at $662.39 low. A rally to $683.36 high-ended wave (X) bounce. Then started the next leg lower in wave (Y) towards $643.41- $618.72 blue box area. From there, buyers were expected to appear looking for new highs ideally or for a 3-wave bounce minimum.

SPY Latest Daily Elliott Wave Chart From 5.17.2026​

SPY Launches Strong Bullish Rally from Blue Box Zone


This is the latest Daily Elliott wave Chart from 5.17.2026 Weekend update. In which the SPY is showing a very strong reaction higher taking place, right after ending the double correction within the blue box area. Allowed members to create a risk-free position shortly after taking the long position at the blue box area. Since then the ETF already made a new high confirming the next leg higher targeting $847- $899 area before profit taking & next pullback takes place.

Source: https://elliottwave-forecast.com/bluebox-wins/spy-launches-strong-bullish-rally-from-blue-box-zone/
 
Costco Wholesale Corporation., (COST) engages in the operation of membership warehouse in the United States & globally together with its subsidiaries. It offers branded & private-label products in the range of merchandise categories. It also operates e-commerce websites in the US, Canada, UK & many other countries. It comes under Consumer Defensive sector & trades as “COST” ticker at Nasdaq.

In weekly, COST is bullish nested impulse sequence & expect rally against May-2022 low, while dips remain above $844.06 low. It is close to break above February-2025 high of $1080. Once it breaks above that level, buyers should buy the pullback for targeting $1515 or higher.

COST - Elliott Wave Latest Weekly View:​

COST-W91.jpg

It ended ((I)) in weekly at $612.27 high in April-2022 & ((II)) at $406.51 in May-2022. Above there, it ended (I) of ((III)) at $1078.23 high in February-2025 high & (II) at $844.06 low. Within (I), it placed I at $564.75 high, II at $447.90 low, III at $1008.25 high, IV at $902 low & V at $1078.23 high as (I). Within III, it ended ((1)) at 530.05 high, ((2)) at $465.33 low, ((3)) at $923.83 high, ((4)) at $867.16 low & ((5)) at $1008.25 high. The (I) was having extended III wave, which indicates the strength of the trend. In (II) pullback, it ended w at $871.71 low, x at $1067.08 high & y at $844.06 low in blue box area.

COST - Elliott Wave View From 1.26.2026:​

COST-W2.jpg

Above (II) low, it favors rally in I of (III), which confirms above 2.10.2025 high. Above $844.06 low, it ended ((1)) of I at $1028.44 & ((2)) as flat correction at $966 low. It placed (A) of ((2)) at $960.46 low, (B) at $1035.82 high & (C) at $966 low. It already broke above ((1)) high, favoring upside in (1) of ((3)). It expects two or more highs within 4.13.2026 rally to extend (1) before correcting next. The ((3)) can extend into $1149.3 – 1262.4 area before correcting in ((4)). Once it breaks above February-2025 high, we like to buy the pullback in 3, 7 or 11 swings at extremes. If it fail to break above February-2025 high, it can remain choppy or do larger correction in (II) if breaks below Dec-2025 low.

Source: https://elliottwave-forecast.com/stock-market/cost-looking-break-for-targeting-1515/
 
Hello traders! In this post, we’ll explore how Elliott Wave helps time the markets and the patience required when applying the theory in financial trading. We’ll also walk through live examples from recent EWF charts where patience and precise timing were key to identifying the right levels and moments to enter positions.

In the fast-paced world of financial markets, the biggest enemy you will face isn’t the market makers, the algorithms, or bad luck. It’s the reflection in the mirror.

Overtrading, entering too early due to FOMO (Fear of Missing Out), and exiting too late due to greed are psychological traps that claim countless trading accounts. To survive, you don’t just need a strategy, you need a framework that forces discipline upon you.

While many traders view Elliott Wave purely as a forecasting tool to predict where a stock or crypto asset is going, its truest value lies in how it acts as a psychological guardrail. It is a masterclass in enforcing two of the rarest virtues in trading: patience and timing.

What is Elliott Wave Theory in short?

Elliott Wave Theory is a method or language of analyzing financial markets by identifying repeating wave patterns in price action. It helps traders understand whether the market is trending or correcting, giving structure to price movements and improving timing for entries and exits.

Patience Through Structure

Elliott Wave isn’t about chasing every tick. It forces traders to wait for clear structures to unfold—whether that’s a completed 5‑wave impulse or a corrective pattern. By defining invalidation levels, the theory teaches that no trade is better than a forced trade. The discipline comes from respecting the wave count and waiting until the market confirms the setup.

Timing Through Sequences

Wave analysis gives traders a roadmap of sequences: impulsive moves followed by corrections. This rhythm helps identify when to act. For example:

  • Entering near the end of a correction (Wave 2 or Wave 4) positions you for the next impulse.
  • Recognizing when a 5‑wave move is complete prevents chasing exhausted trends.
The timing edge comes from syncing entries with the natural rhythm of market psychology.

Psychological Reinforcement

Patience isn’t just technical—it’s psychological. Elliott Wave reflects crowd behavior, showing that markets move in cycles of optimism and pessimism. By following the structure, traders avoid emotional reactions and instead act when probabilities are strongest. It enforces discipline by saying: “Wait until the market tells its story.”

Real‑World Application

At Elliott Wave Forecast (EWF), patience and timing are applied daily. Recent charts have shown that waiting for corrective structures to complete often provides the exact levels for high‑probability entries. Whether it’s Gold, Silver, or FX pairs, Stocks or ETF’s the discipline of waiting for the market to align with the wave count is what separates consistent traders from reactive ones.

Example below chart of XLI-ETF.

XLI-4-hr-18-march-before.png


XLI ETF – In the example of the XLI ETF, the 5‑wave move up had already been identified. At EWF, we knew there was no need to chase the rally; instead, discipline required us to wait and let the market reveal what corrective structure would form. Once the pattern became clear, we could pinpoint the levels (158.36 - 149.68) where positions should be considered. From that point, it was all about patience and discipline—waiting for the market to come to us. Fast forward about two weeks, the opportunity finally arrived as price reached the Blue Box area, allowing us to enter with precision.

XLI-4-hr-30-april-after.png


XLI ETF – Timing & Patience in Action Fast forward to the chart above: after waiting nearly two weeks, price finally reached the level we anticipated. We applied timing and patience, and when price hit the Blue Box, it wasted no time—rallying immediately. Without discipline, an average trader might have entered too early, only to be shaken out before the real move began. By following the structure and respecting timing, we caught the exact turning point. Almost instantly, the trade moved into profit. Within a few days, we were able to secure risk‑free positions and take partial profits, all in line with the rules and guidelines we follow at EWF.

Key Takeaway

Elliott Wave enforces patience by requiring traders to wait for valid structures, and it sharpens timing by mapping out where the next opportunity lies. In short: structure breeds discipline, discipline breeds timing, and timing breeds consistency.

Conclusion


Timing and patience are among the biggest reasons traders struggle, but Elliott Wave helps prevent unnecessary trades by enforcing discipline through structure and timing. Traders are constantly asking themselves:

  • What wave is the market currently in?
  • Is the structure complete?
  • Is this impulse or correction?
  • Has the setup been confirmed?
These questions act as filters, forcing traders to wait for clarity instead of reacting impulsively. By aligning entries with the natural rhythm of market psychology and respecting the structure, Elliott Wave helps traders time the markets more effectively. The result is fewer forced trades, more precise entries, and the realization that sometimes the best trade is no trade at all.

At Elliottwave Forecast (EWF), we deliver consistent market updates through regular charts update. Our analysts update 1‑hour charts four times daily and 4‑hour charts once per day across all 78 instruments. In addition, we host five live sessions each day and maintain a 24‑hour chatroom, providing clients with real‑time market guidance and answers to any questions they may have.

Source: https://elliottwave-forecast.com/elliottwave/how-elliott-wave-enforces-patience-and-timing/
 
Hello fellow traders. In this technical article, we take a quick look at the Elliott Wave charts of the Gold Miners ETF (GDX), published in the members’ area of our website. The ETF shows bullish impulsive sequences on both the daily and weekly charts. The structure points to a strong uptrend, with higher highs and higher lows. Pullbacks should find support in key areas, offering buying opportunities.

In the following sections, we explain the Elliott Wave structure, highlight key levels, and outline possible scenario. We focus on trading with the trend and avoid selling while the bullish sequence remains intact.

GDX Elliott Wave 4 Hour Chart 3.23.2026​

Current analysis suggests GDX is close to completing wave (IV) (blue) as an ABC zigzag. The extreme zone has already been reached at 81.55–66.56, marked as the blue box. As long as price stays above the 66.56 low, the bullish count remains valid. We expect further strength in the ETF. A rally from the buyers' zone could lead to new highs. We advise against selling.

Official trading strategy on How to trade 3, 7, or 11 swing and equal leg is explained in details in Educational Video, available for members viewing inside the membership area.

90% of traders fail because they don’t understand market patterns. Are you in the top 10%? Test yourself with this advanced Elliott Wave Test

GDX

GDX Elliott Wave 4 Hour Chart 3.23.2026​

GDX ETF held above 66.56 and extended higher, as expected. The correction ended at 74.12, which now acts as the key level. From that low, GDX completed a 5-wave advance labeled ((1)) in black. A 3-wave pullback toward 81.56–77.48 is expected. After wave ((2)) completes, we can define the next upside target.

Keep in mind, the market is dynamic. The presented view could change over time. You can check the latest charts and target levels in the membership area of the site. The best instruments to trade are those with incomplete bullish or bearish swings. These are listed in the Sequence Report, and the best ones are shown in the Live Trading Room.

GDX

Thank you for exploring our GDX technical article with us. While we analyze 78 instruments, it’s important to remember that not every chart represents a trading recommendation. For official trading signals, we invite you to join our Live Trading Room, where we provide actionable insights in real-time. If you’re not yet a member, take advantage of our 14-day trial to unlock new trading opportunities.

Source: https://elliottwave-forecast.com/tr...orecasting-the-rally-after-3-waves-pull-back/
 
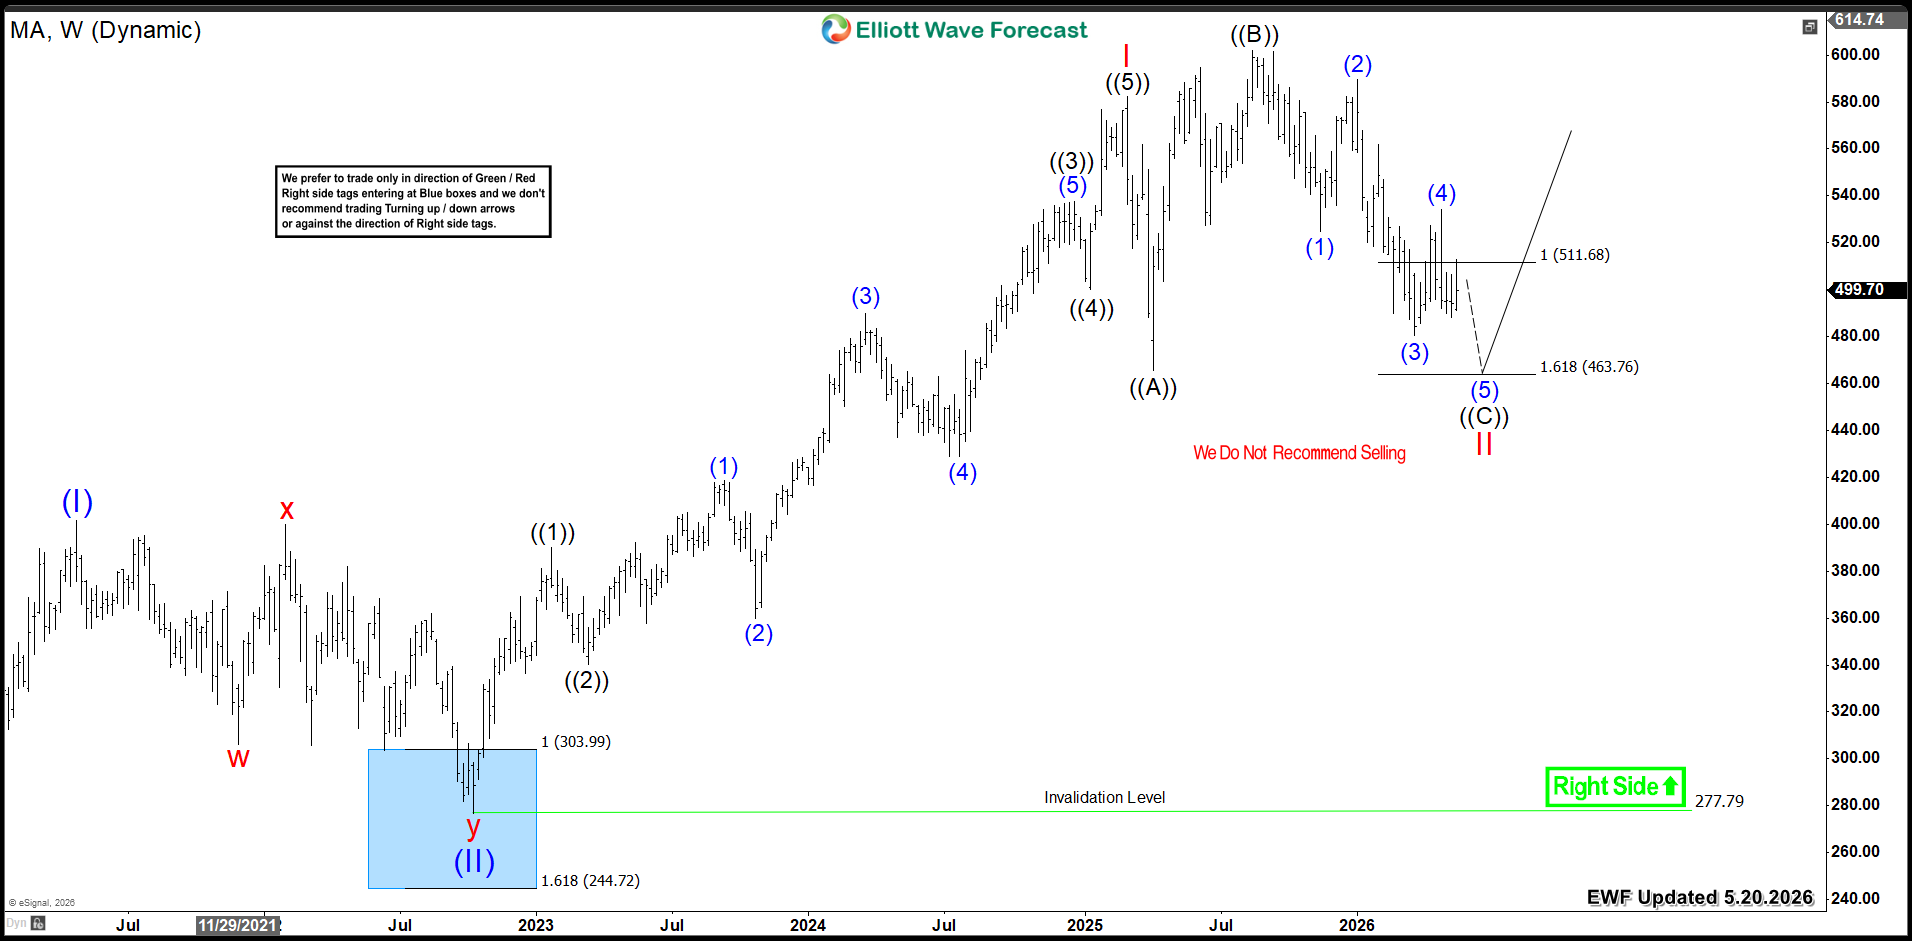
Mastercard Inc (NYSE: MA) is undergoing a weekly correction. Today, we dive into its technical chart. Our analysis explores the Elliott Wave structure and projected target for the current cycle.
MA completed an impulsive five-wave advance from its 2022 low of 277.79. Wave I peaked at $582. From that high, a three-wave flat correction is now unfolding. Wave ((A)) ended at 465. Then, Then, wave ((B)) reached $601. Currently, wave ((C)) remains in progress.

The stock already reached the equal legs zone ( $511 − $463) . This area should conclude wave II. Consequently, a bullish reversal will take place from this zone and Mastercard will look to resume the rally higher in wave III into new all time highs.

Mastercard (MA) Weekly Chart 5.20.2026​

MA Weekly Chart 5.20.2026

Conclusion​

Mastercard's (MA) bullish cycle remains in progress. The stock is poised for further upside extension. Therefore, investors should target buying opportunities within weekly pullbacks.

Source: https://elliottwave-forecast.com/stock-market/mastercard-inc-nyse-ma-enters-extreme-area/
 
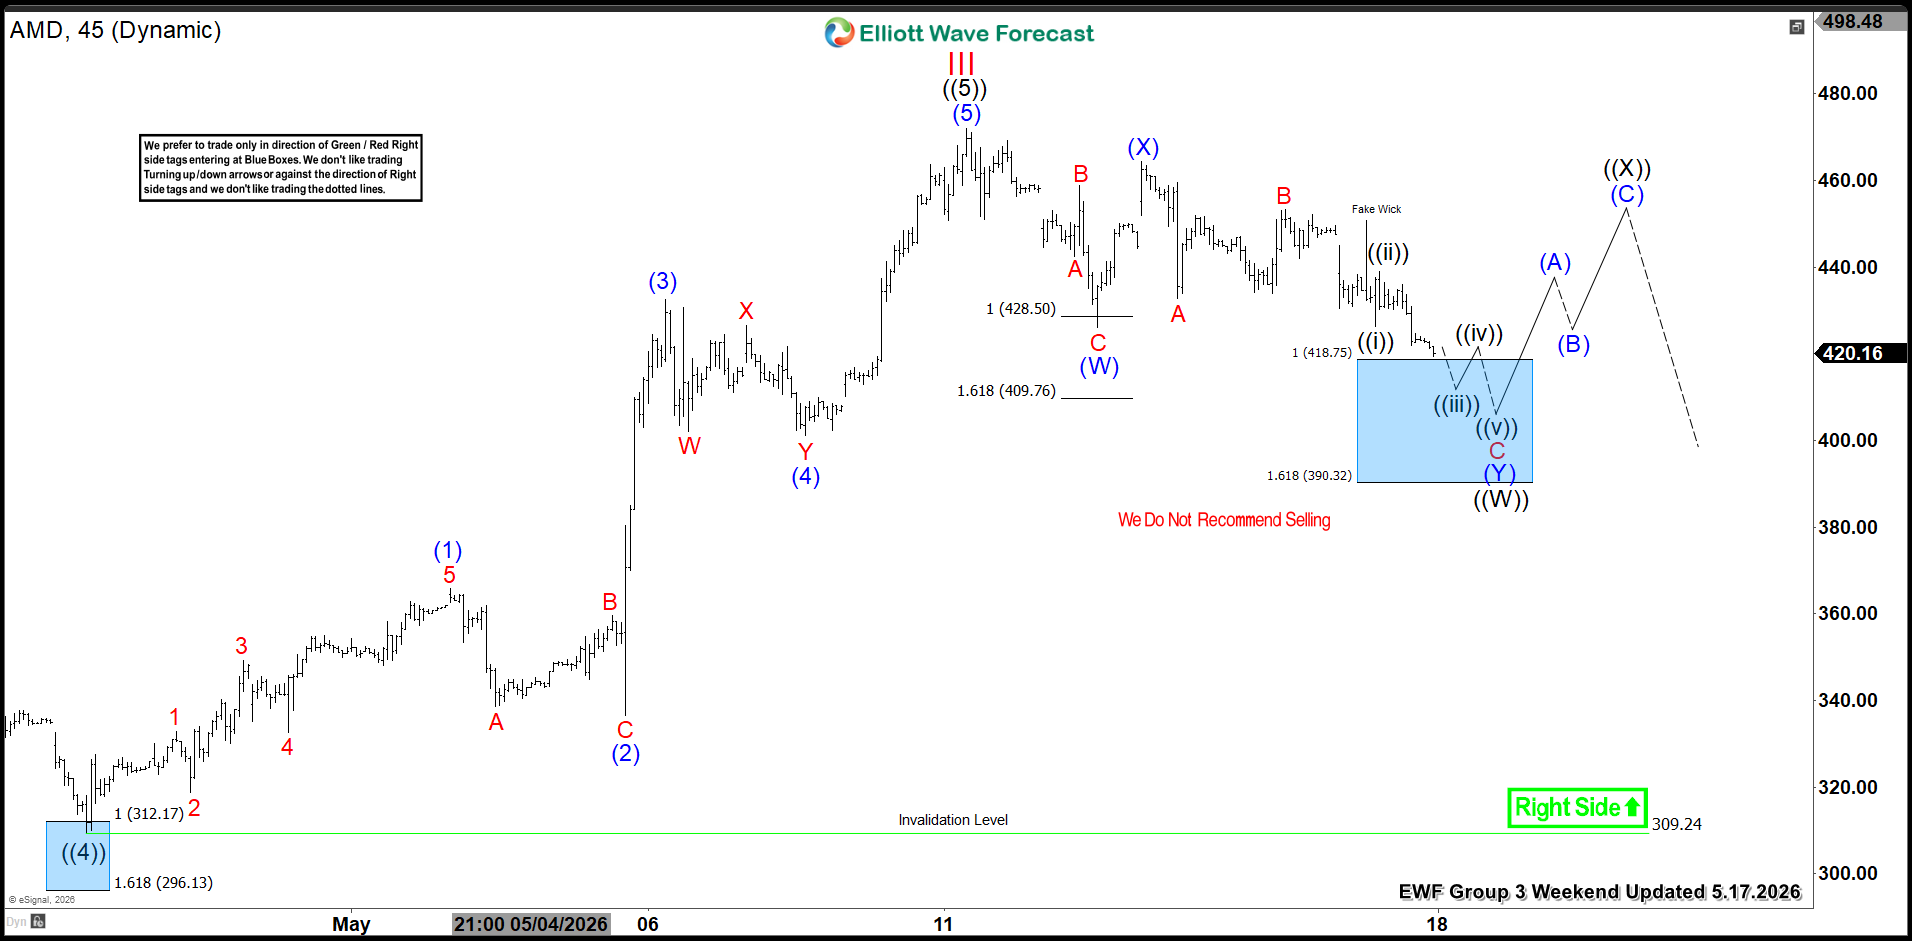
In this Elliott Wave update, we look at the latest structure in Advanced Micro Devices Inc. ($AMD). The stock appears to have ended the bullish cycle from March 2026 and has now turned lower in a larger corrective pullback. However, the decline is being viewed as corrective, not impulsive. As a result, $AMD is now pulling back in 7 swings, and the current leg lower is opening a Blue Box Area buying opportunity in 3 swings at wave ((W)) of wave IV.

5 Wave Impulse + 7 Swing WXY correction​

$AAPL

$AMD Ended the Cycle From March 2026​

Looking at the 45-minute chart, $AMD completed a strong rally from the March 2026 cycle and eventually reached a meaningful peak. After that high, the stock failed to extend higher and started to correct the advance.

This shift is important because it suggests the prior bullish cycle has ended for now, and a larger wave IV correction is taking place. Even so, the pullback still looks corrective in nature, which means the broader bullish structure remains intact unless key support breaks.

$AMD

At this stage, $AMD is not showing a simple straight decline. Instead, the pullback is unfolding as a 7-swing correction, which is a common Elliott Wave structure inside a larger trend.

More specifically, the first leg of wave IV is being labeled as ((W)), and that leg is developing in 3 swings. In other words, $AMD is moving lower in a corrective sequence rather than starting a fresh bearish trend. Therefore, the current weakness should be treated as part of a larger pullback within the broader bullish sequence.

Blue Box Area Offers Buying Opportunity​

Most importantly, the Blue Box Area between 418.75 and 390.32 marks the next key support zone. This is the area where wave ((W)) of wave IV can finish and where buyers are expected to appear.

Typically, Blue Box Areas represent high-frequency reaction zones where selling pressure begins to fade and buyers step in for a bounce. In this case, if $AMD reaches that region, the market can attract buyers and produce a recovery in wave ((X)) before the larger correction continues.

Therefore, we do not like selling into that support zone. Instead, the preferred view is to watch the Blue Box for a buying opportunity as the corrective structure matures.

What Happens After the Blue Box Reaction​

Once $AMD reaches the Blue Box Area and wave ((W)) ends, the stock can stage a bounce in wave ((X)). That reaction higher would fit the idea of a larger 7-swing pullback in wave IV.

After that bounce, $AMD may still see another leg lower to complete the full correction. However, the first important opportunity comes from the reaction out of the Blue Box, where buyers can look for a tradable recovery.

Near-Term Outlook for $AMD​

In the short term, the focus remains on the current decline into 418.75–390.32. As long as the stock continues to pull back in a corrective sequence, that area remains the next important support to watch.

Meanwhile, the broader bullish structure stays valid above the 309.24 invalidation level. Accordingly, the current decline is still favored to remain corrective while the stock stays above that larger support.

Technical Summary​

To summarize, $AMD appears to have ended the cycle from March 2026 and is now pulling back in a 7-swing correction. The current leg lower is being counted as wave ((W)) of wave IV, and it is unfolding in 3 swings.

Most importantly, the Blue Box Area at 418.75–390.32 stands out as the next buying opportunity, where buyers can appear and trigger a bounce before the larger correction continues.

Source: https://elliottwave-forecast.com/st...ering-buying-opportunity-as-pullback-unfolds/
 
Hello fellow traders. In this technical article, we take a quick look at the Elliott Wave charts of IWM iShares Russell 2000 ETF published in members area of the website. The ETF has recently given us Double Three pull back and found buyers again precisely at the equal legs area as we expected. In the following text, we’ll explain the Elliott Wave count.


IWM Elliott Wave 1 Hour Chart 05.18.2026​

The ETF is forming a 3-wave pullback, unfolding as a Double Three pattern. At the moment, we can see incomplete sequences. Our members know that we constantly emphasize the importance of incomplete sequences, as these determine the market’s path.
The structure suggests more weakness toward the Equal Legs area at 274.71-267.93, buying zone. We expect at least a three-wave bounce from the Blue Box area. Once the price reaches the 50% Fibonacci retracement against the (X) connector, we will make the position risk-free by moving the stop loss to breakeven and booking partial profits.

Official trading strategy on How to trade 3, 7, or 11 swing and equal leg is explained in details in Educational Video, available for members viewing inside the membership area.

90% of traders fail because they don’t understand market patterns. Are you in the top 10%? Test yourself with this advanced Elliott Wave Test

IWM

IWM Elliott Wave 1 Hour Chart 05.22.2026​

IWM made proposed leg down and found buyers as expected at the Blue Box area, making decent bounce. Any longs from the blue box zone should be risk free. 289.26 is the key level at this stage. A break above this peak would confirm a bullish continuation for the ETF and open the door for further upside extensions

Reminder for members: Our chat rooms in the membership area are available 24 hours a day, providing expert insights on market trends and Elliott Wave analysis. Don’t hesitate to reach out with any questions about the market, Elliott Wave patterns, or technical analysis. We’re here to help.

IWM

Thank you for exploring our IWM technical article with us. While we analyze 78 instruments, it’s important to remember that not every chart represents a trading recommendation. For official trading signals, we invite you to join our Live Trading Room, where we provide actionable insights in real-time. If you’re not yet a member, take advantage of our 14-day trial to unlock new trading opportunities.

Over the years, we’ve developed a reliable trading strategy that clearly defines entry, stop loss, and take profit levels. By joining us, you’ll gain access to expert guidance and the chance to refine your trading skills.

Source: https://elliottwave-forecast.com/stock-market/iwm-found-buyers-after-double-three-pattern/