Elliott Wave Analysis by EWF

Walmart (NYSE: WMT) ended its rally from the April 2025 low triggering a larger degree correction. We mentioned this idea earlier this year in our previous article. Today, we explain the Elliott Wave structure unfolding now. Our analysis leads to the next potential investment opportunity.

Elliott Wave Analysis

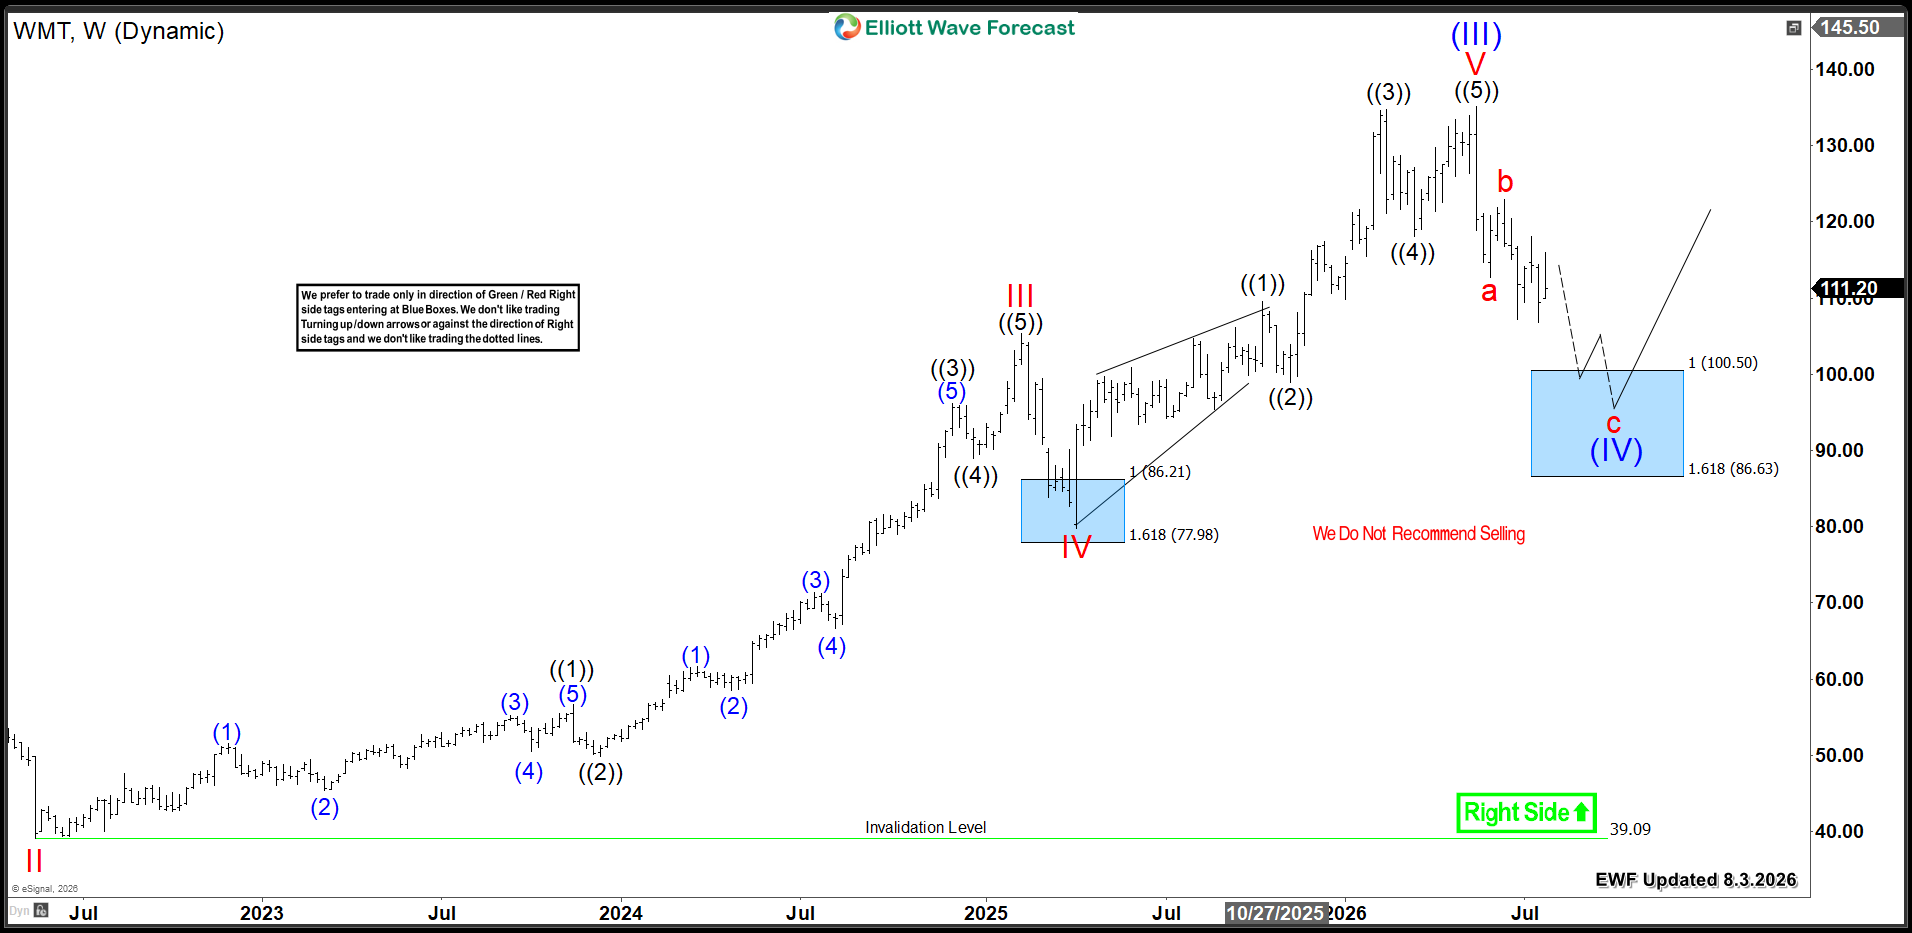
WMT's last rally from the April 2025 Blue Box unfolded as a five-wave advance. This move ended at $135, marking wave (III). From that peak, the stock began a three-wave zigzag correction within wave (IV). Price already established the first two legs, "a" and "b". Consequently, as long as WMT stays below the recent June peak of $116.80, further downside continuation should occur within wave C.

Based on the a-b connector, WMT should reach the $100.50 - $86.63 Blue Box equal legs area. Therefore, buyers and investors should wait for this extreme zone. They will enter the market there and look for the stock to turn higher. It will either resume the rally in wave (V) toward new highs or bounce in three waves at minimum.

Walmart WMT Weekly Chart 08.03.2026
Walmart WMT Weekly 8.3.2026

Conclusion​

Walmart (WMT) weekly bullish cycle remains firmly intact. Therefore, this correction will create the next strategic buying opportunity before the uptrend resumes.

Source: https://elliottwave-forecast.com/stock-market/walmart-wmt-new-investment-opportunity-below-100/
 
In this Elliott Wave update, we examine the long-term structure in the SPDR S&P Oil & Gas Exploration & Production ETF ($XOP). The ETF continues to show a bullish double-nest structure from the 2020 low, which supports additional upside over the longer term. However, $XOP currently trades at an important inflection point. The correction against the April 2025 low may have already ended, or the ETF may need a deeper 7-swing pullback before the larger bullish trend resumes.

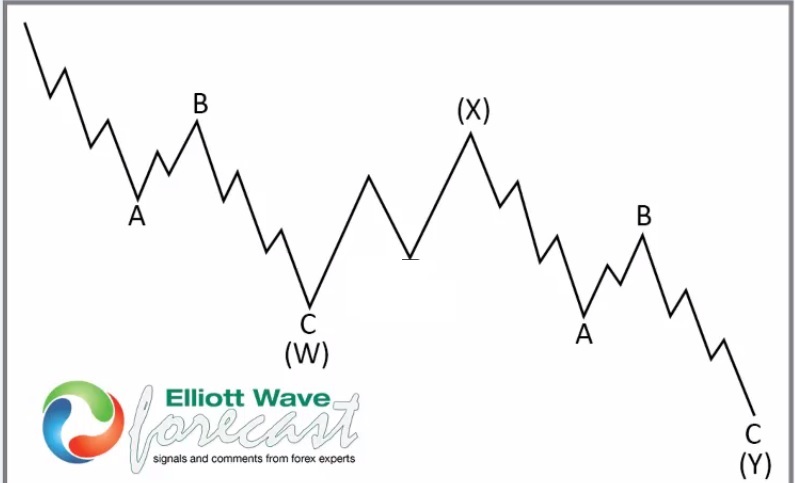
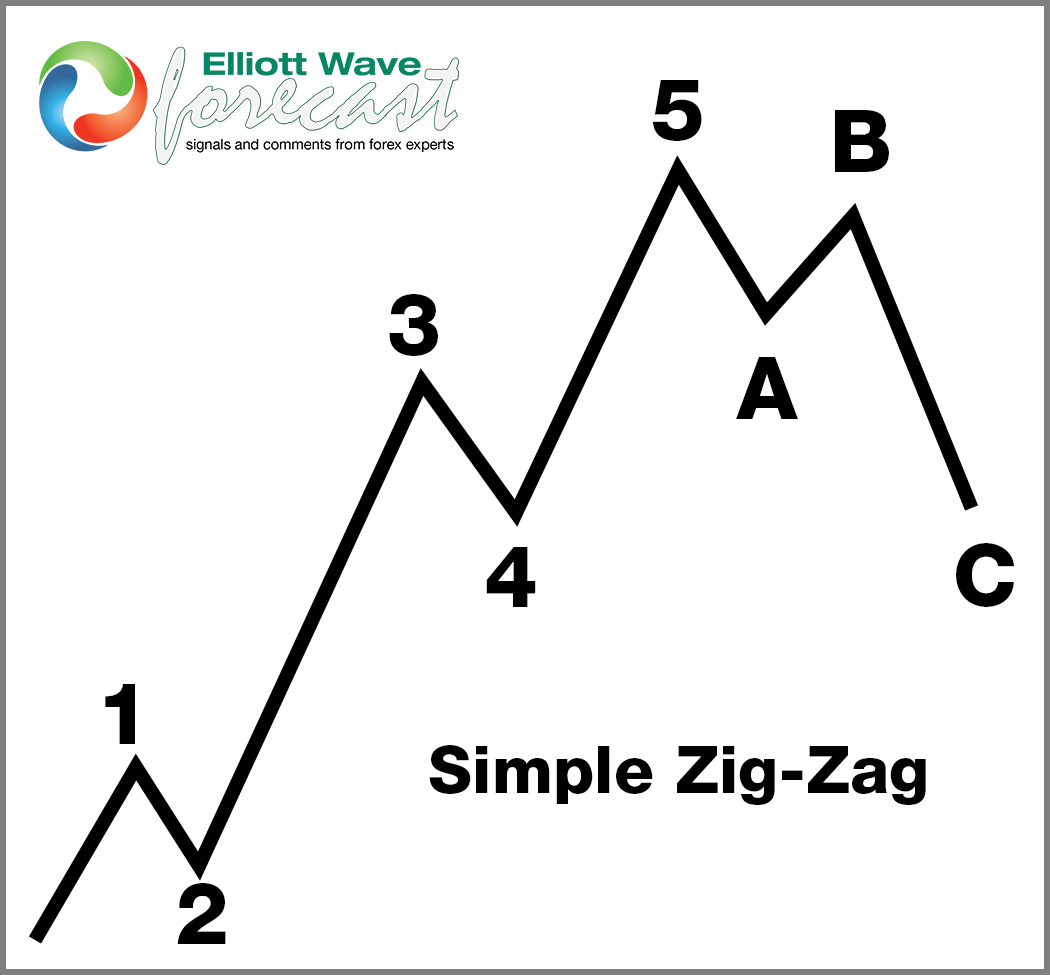
5 Wave Impulse + ABC correction + WXY correction​

$AMD

$NVDA

$XOP Shows a Double Nest From the 2020 Low​

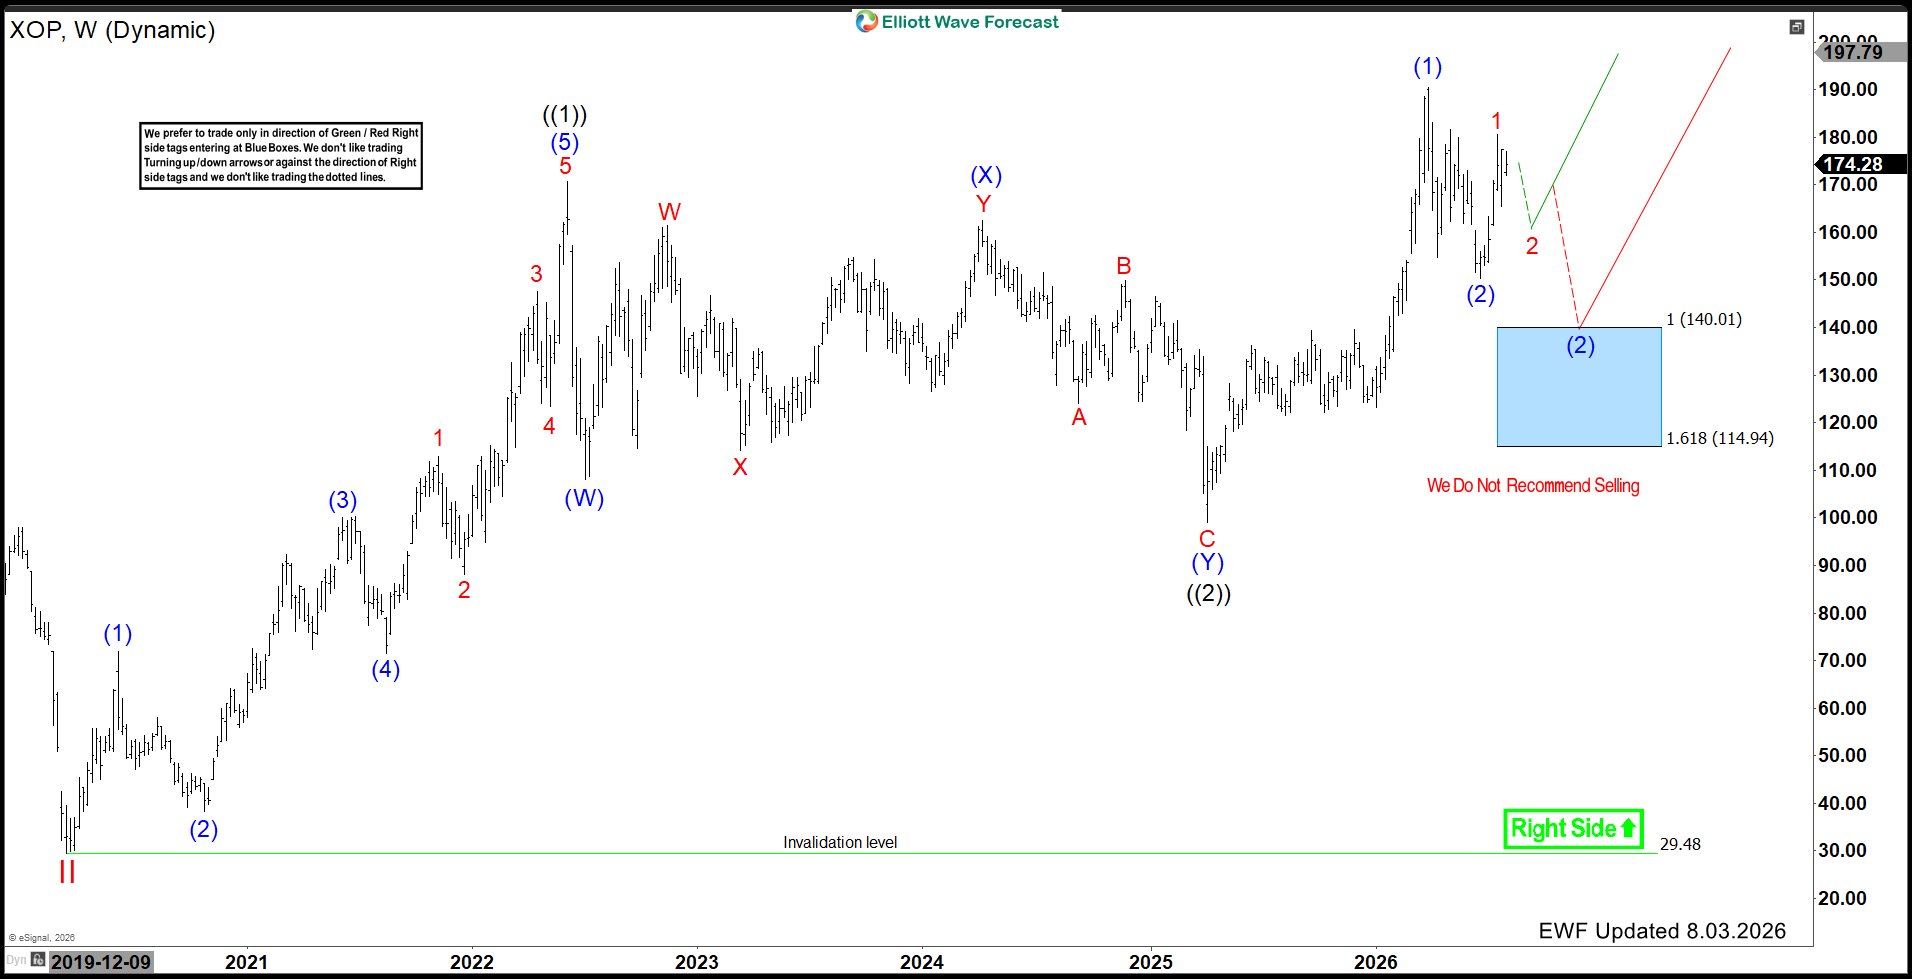
Looking at the weekly chart, XOP established an important low in 2020 and then advanced in five waves to complete wave ((1)). Afterward, the ETF corrected that rally in a 7 swing (WXY) structure and formed wave ((2)) at the April 2025 low.

The strong rally from that low appears to have completed another five-wave advance in wave (1). Consequently, the larger structure now displays a bullish double nest. This pattern often occurs before a powerful third-wave acceleration, which keeps the long-term outlook constructive.

$XOP

April 2025 Low Started a New Bullish Cycle​

From the April 2025 low, $XOP rallied sharply and reached the 2026 peak near the $190 area. That advance can be counted as a completed five-wave impulse in wave (1).

The ETF then pulled back in wave (2) and found support near the $150 area. Since that low, price has started to recover and may already be building the next impulsive sequence. Nevertheless, the current structure has not yet confirmed whether the correction fully ended at that low.

$XOP Is Trading at an Important Inflection Point​

At this stage, two possible scenarios remain in play.

In the first scenario, wave (2) already ended near the recent low. Under this view, the current rally represents wave 1 of a new impulsive advance. A short-term pullback in wave 2 should remain supported, followed by another strong move higher.

However, $XOP could still fail to sustain the current recovery. In that case, the correction against the April 2025 low may remain incomplete and develop as a larger 7-swing structure.

Therefore, the next pullback and subsequent price reaction should help clarify which path the ETF will follow.

Blue Box Area Offers the Alternative Buying Opportunity​

If $XOP extends the correction in 7 swings, the next major support comes within the Blue Box Area between 140.01 and 114.94. This region represents the 100%–161.8% Fibonacci extension of the corrective sequence.

Typically, buyers are expected to enter within a Blue Box Area and produce at least a three-wave reaction higher. Accordingly, we do not recommend selling into this zone. Instead, the area should provide another buying opportunity in the direction of the larger bullish trend.

A decline into the Blue Box would not necessarily damage the long-term outlook. Rather, it could complete wave (2) at a lower level before the next major advance begins.

What Comes Next for $XOP?​

The preferred bullish scenario calls for the recent low to hold. In that case, XOP should complete a short-term pullback and then continue higher toward and eventually above the 2026 peak.

Alternatively, a failure to hold the recent support would open a deeper corrective path toward 140.01–114.94. Buyers would then be expected to enter the Blue Box and support the next bullish cycle.

In both scenarios, the larger direction remains higher. The primary uncertainty concerns whether wave (2) has already ended or requires another 7-swing decline first.

Technical Summary​

To summarize, $XOP shows a bullish double nest from the 2020 low, and the April 2025 low appears to have started another long-term advance. The ETF now trades at an important inflection point.

The recent low may have completed wave (2), allowing a new impulsive rally to develop. However, if the recovery fails, $XOP can pull back in 7 swings toward the 140.01–114.94 Blue Box Area, where another buying opportunity should develop.

The broader bullish sequence remains valid above the long-term 29.48 invalidation level. Therefore, whether the next low has already formed or develops inside the Blue Box, the larger outlook continues to favor additional upside.

Source: https://elliottwave-forecast.com/st...point-as-double-nest-supports-further-upside/
 
GameStop Corporation (NYSE: GME) continues to develop a complex Elliott Wave structure on the weekly chart. After completing a major cycle-degree red wave III at $120.75, the stock entered a prolonged consolidation phase in red wave IV. The correction has taken the form of a sideways range and appears to be developing as a five-legged contracting triangle. The chart shows the triangle progressing through waves ((A))-((B))-((C))-((D))-((E)), with the final swings of wave ((E)) potentially still unfolding. This structure suggests that the wave IV correction may be approaching completion.

GME 08.04.2026 Weekly Elliott Wave Chart​

GME_2026-08-04_06-13-37-scaled.png

GME Wave IV May Complete Near $11.89 And​

Following the 2024 low, GameStop started another corrective sequence. The chart shows wave (A) followed by a contracting triangle structure. Within this triangle, the subdivisions appear as A-B-C-D-E, with the pattern now approaching its final stages. The current decline is expected to unfold as wave (C), which should complete the larger triangle and the corresponding wave ((E)). The chart projects the potential completion of red wave IV near the $11.89 level.

This area is important because $11.89 represents the 0.618 Fibonacci retracement level of wave (A) in wave (C) marked on the chart. If price reaches this support zone and the Elliott Wave structure completes as expected, it could provide a significant potential reversal area.

Once red wave IV completes, we expect GameStop to begin another five-wave advance in red wave V. The initial objective is for wave V to break above the $120.75 peak, confirming the continuation of the larger bullish cycle. Beyond that level, the rally could extend further toward the $148.75 area before the next major pullback develops.

Conclusion​

GameStop's Elliott Wave structure suggests that red wave IV may be nearing completion within a contracting triangle. A potential completion near $11.89 could set the stage for wave V, with expectations for a move above $120.75 and a potential extension toward $148.75.

Source: https://elliottwave-forecast.com/st...iott-wave-promising-triangle-setup-new-highs/
 
Analysts remain cautious on QS because the company is still pre‑revenue and continues to burn cash. Even so, they highlight recent manufacturing progress and note that partnerships like Honda and Volkswagen keep long‑term potential alive. We see this mixed sentiment creating wide price targets and uneven expectations for the next quarters.

At the same time, analysts warn that commercialization delays remain the biggest risk. However, they also point to strong liquidity and improving pilot‑line performance as positive signs. We expect these themes to dominate analyst commentary over the next three months as QS works to prove it can scale its solid‑state technology.

Elliott Wave Outlook: QuantumScape (QS) Weekly Chart May 2026

Elliott Wave Outlook: QuantumScape (QS) Weekly Chart May 2026


Back in May, wave A fell harder than we expected and hit the 6‑dollar zone. We saw QS bounce to 9.66 and complete Wave B. After that bounce, we still expected more downside to finish three waves and complete the Wave (2) correction. Only then were we ready to look for buying setups to trade Wave (3) of the impulse.

We viewed the ideal area to finish the correction between 5.03 and 3.60. In that region, the market had to show a strong bullish reaction to confirm the pullback had ended and the next upward cycle could continue.

(If you want to learn more about Elliott Wave Principle, please follow these links: Elliott Wave Education and Elliott Wave Theory.)

Elliott Wave Principle Behind the Market Structure​

Impulse

An impulse is a clean 5‑wave pattern that drives the trend forward.

  • Waves 1‑3‑5 are strong and directional.
  • No overlap between waves 1 and 4.
  • Wave 3 is usually the strongest.
  • Structure is clear, with increasing momentum.
Elliott Wave Principle Behind the Market Structure


Elliott Wave Outlook: QuantumScape (QS) Weekly Chart August 2026

Elliott Wave Outlook: QuantumScape (QS) Weekly Chart August 2026


As we see on the chart, Wave B resisted the buyers’ pressure and the market continued lower. Price has already reached the 5.03–3.60 zone, and it could start moving higher from here. Even so, the short‑term bearish structure still looks incomplete, and we expect more downside before the trend can turn.

At this stage, we ideally want to see two additional lows to complete the Wave C impulse and form a clean bottom. In the worst case, the market may produce one final low below 4.77 before confirming a bullish reversal. Once that structure finishes, we will look for signs that the next upward cycle is ready to begin.

Source: https://elliottwave-forecast.com/stock-market/qs-approaches-key-bottom-structure-potential-reversal/
 
In today's blog post, we take a trip down memory lane and look back at a previous CADJPY analysis. This serves as a great example of how we use technical analysis to identify potential market moves.

Specifically, we'll be examining the CADJPY chart from 07.29.2026. At that time, we were tracking a potential bullish move. Our Elliott Wave analysis suggested that a primary wave (B) corrective pattern was nearing completion.

CADJPY-Before.jpg


According to our forecast, we anticipated that CADJPY would form a significant high somewhere in the 117.52 region. This level represented a major Fibonacci resistance zone, and we believed it would be a logical place for the bulls to take profits and for the bears to re-enter the market.

The Reaction: Sharp Reversal from the Highs

1CADJPY-24020260803185117.jpg


As anticipated, CADJPY capped its upward momentum right at the projected peak area and reversed aggressively to the downside. The pair completed wave ((v)) of C of (B) just below the 116.49 invalidation level, confirming the top before launching into a sharp impulsive decline.

This sell‑off drove prices more than 500 pips lower, reaching the 110.50 zone to complete wave 1, now trading around 112.02. The initial drop unfolded in five clear sub‑waves, underscoring the strength of the move.

Looking ahead, with wave 1 complete, the forecast calls for a corrective three‑wave bounce in wave 2—((a)), ((b)), and ((c))—toward the 113.50–114.00 region. Once this corrective rally is complete, the higher‑degree downtrend is expected to resume, extending the bearish sequence. Importantly, selling directly into current lows is not advised, as a corrective bounce is anticipated before the next major decline unfolds.

Conclusion

The CADJPY sequence is a textbook example of how Elliott Wave analysis maps out corrective structures and anticipates reversals. By combining wave counts, invalidation levels, and right‑side tags, traders can position themselves with the trend rather than against it.

Source: https://elliottwave-forecast.com/elliottwave/how-elliott-wave-mapped-the-cadjpy-drop/
 
Valero Energy Corporation., (VLO) manufactures, markets & sells petroleum based & low-carbon liquid transportation fuels & petrochemical products in the US, Canada & internationally. It comes under Energy sector & trades as “VLO” ticker at NYSE.

In weekly, VLO is trading in bullish sequence at all time high. It favors further upside, while short term pullback remains above 6.18.2026 low to extend April-2025 rally. It should find support between $288.36 - $272.10 area for next rally towards $330 or at least 3 swings bounce.

VLO - Elliott Wave Latest Daily View:​

VLO-D1.jpg

In weekly, it ended (I) of ((III)) at $184.79 high (4.05.2024) & (II) at $99.00 low (4.07.2025). Above there, it favors rally in I of (III). Within I of (III), it ended ((1)) at $155.12 high, ((2)) at $130.78 low, ((3)) at $320.24 high & favors pullback in ((4)) in 7 or 11 swings. Within ((3)), it placed (1) at $178.43 high, (2) at $155.29 low, (3) at $265.61 high, (4) at $232.72 low & (5) at $320.24 high. It is showing 11 swings & favors pullbacks in 12th as ((4)) started from 7.22.2026 high before 13th swing rally.

Below 7.22.2026 high, it placed (W) at $294.21 low & proposed ended (X) at $315 high. As long as the bounce fail below $315 high, it expects (Y) to extend lower between $288.36 - $272.10 area to finish ((4)). It should find support there for next rally in ((5)) or a 3-swing connector before larger correction unfolds. So far, the pullback is too shallow, but above 6.18.2026 low, it favors more upside as the part of I wave. We like to buy the pullback in 3, 7 or 11 swings at extreme area for next rally. Better opportunity can be larger double in ((4)) or later II pullback against April-2025 low.

Source: https://elliottwave-forecast.com/stock-market/valero-vlo-analysis-buying-pullback-for-rally-330/
 
Hello fellow traders. In this technical block we’re going to take a quick look at the Elliott Wave charts of AMD stock published in members area of the website.

Recently, AMD completed a three-wave structure from the peak, which could be the first leg of a deeper correction unfolding as a seven-swing pattern. In the following analysis, we will examine the Elliott Wave structure in detail and discuss the potential market outlook from this support zone.


AMD Elliott Wave 1 Hour Chart 07.29.2026​

AMD stock is correcting the cycle from the 185.53 low. The price has reached an important technical zone between 437.76 and 360.77, marked as the Blue Box. As our members know, this buying zone is derived by measuring the Equal Legs area using the Fibonacci Extension tool. From this area, we expect buyers to step in and regain control, potentially driving the price higher in a three-wave bounce. Once the bounce reaches the 50% Fibonacci retracement against the (X) connector high, we will take partial profits and move the stop loss to break-even.

You can learn more about Elliott Wave Patterns at our​

90% of traders fail because they don’t understand market patterns. Are you in the top 10%? Test yourself with this advanced Elliott Wave Test


AMD Elliott Wave 1 Hour Chart 08.03.2026​

The stock found buyers at the Equal Legs zone, producing a solid reaction from that area. As a result, long positions taken from the Equal Legs zone are now risk-free. The rally from the buying zone looks impulsive, so we assume we should see at least another leg higher in five waves.

Important note: Our analysis is not based on Elliott Wave in isolation. We perform detailed higher-time-frame cycle analysis, which shows an incomplete market structure. This is one of the key drivers of price action, along with correlation analysis and broader market context.

We also teach our members in live analysis sessions how to identify incomplete bullish and bearish sequences. Even a 14-day trial, is enough to noticeably improve your trading analysis and forecasting approach.


Source: https://elliottwave-forecast.com/stock-market/amd-finds-support-in-the-blue-box-buyers-zone/
 
Hello fellow traders. In this technical article we’re going to take a look at the Elliott Wave charts charts of RUSSELL Futures $RTY_F published in members area of the website. RUSSELL made a clear 3-wave move down from the 3068 peak and completed the correction right at the Equal Legs zone. In the following text, we will explain the Elliott Wave pattern and the trading setup.

RUSSELL Elliott Wave 4 Hour Chart 07.29.2026​

RUSSELL is showing a clear 3-wave correction from the peak. The price is reaching the extreme zone at 2901.69–2822.28. We don’t recommend selling RTY_F and prefer the long side from the marked Blue Box (buying zone).

We expect Russell to ideally make either a rally toward new highs or, alternatively, a 3-wave bounce. Once the bounce reaches 50% Fibonacci retracement against the ((x)) black high, we will make the long position risk-free by moving the stop loss to breakeven and taking partial profits.

The current view suggests that we may only be ending the first leg of the proposed pullback. Regardless, the right side remains the bullish side, and the Blue Box presents a valid trading setup.

Our strategy allows us to enter trades from the current area and make them risk-free as soon as the corresponding bounce develops.

Official trading strategy on How to trade 3, 7, or 11 swing and equal leg is explained in details in Educational Video, available for members viewing inside the membership area.

Quick reminder on how to trade our charts :

Red bearish stamp+ blue box = Selling Setup
Green bullish stamp+ blue box = Buying Setup
Charts with Black stamps are not tradable.


RUSSELL Elliott Wave 4 Hour Chart 07.29.2026​

RUSSELL found buyers right at the Equal Legs zone at 2901.69 and produced a very good reaction from the Blue Box Area. Consequently, any long positions taken from the zone should be risk-free by now.

The 3068 level is important at this stage. We would need to see a break above that high to confirm that the next leg is in progress.

You can check the latest charts and target levels in the membership area of the site. The best instruments to trade are those with incomplete bullish or bearish swings. These are listed in the Sequence Report, and the best ones are shown in the Live Trading Room.

Keep in mind that the market is dynamic, and the proposed view may have changed in the meantime. Our member chat rooms are open 24/7 and provide ongoing expert guidance on market trends and Elliott Wave analysis. Members are encouraged to ask questions about market structure and technical setups at any time.


Source: https://elliottwave-forecast.com/in...xplained-buyers-react-from-the-blue-box-area/