Elliott Wave Analysis by EWF

Markets rarely reward consensus in the way most participants expect. Right now, a large portion of traders are anticipating a pullback. But anticipation alone does not translate into execution. In reality, most participants will enter too early, hesitate when the opportunity appears, or miss the move entirely.

This is not randomness—it is the result of structural market dynamics, liquidity behavior, and deeply ingrained psychological biases. The pullback may be expected. Capitalizing on it is not.

The Execution Gap: Why Expectation Fails​

There is a persistent gap between what traders expect and what they actually do. When markets begin to pull back, some traders enter prematurely and get stopped out. Others wait for confirmation and miss optimal entries. Many freeze as volatility increases and uncertainty rises. By the time the opportunity becomes “obvious,” it is often already gone. This pattern repeats because markets are designed to exploit hesitation and emotional decision-making.

Our Approach: A Different Use of Elliott Wave Theory​

At ElliottWave-Forecast, we apply Elliott Wave Theory differently from the traditional approach. Over the years, we have developed a rule-based system focused on: Identifying trend changes early, defining high-probability entry zones, and executing within the dominant trend—not against it. This framework allows us to act when others hesitate, especially during periods of panic or dislocation.

We demonstrated this during: The Covid crash in 2020

The April 2025 market pullback

https://elliottwave-forecast.com/st...msft-blue-box-area-offers-buying-opportunity/

These events did not surprise us. Not because we predict news, but because we track market cycles and structure. Preparation, not prediction, is what enables execution.

The Current Market: The Warning Was Already There​

Earlier this year, we identified warning signs pointing to the current pullback. This is not just across indices, but also within key individual stocks like Delta Air Lines (DAL).

https://elliottwave-forecast.com/st...ce-april-structural-warning-to-world-indices/

From the April 7th low, Delta developed a clear five-wave impulsive structure. Within our framework, a completed 5-wave sequence is not just a continuation signal. It is often a warning that the underlying cycle is approaching exhaustion. What made this particularly important is that the structure was clean and complete. In addition, the sequence aligned with broader market extensions. It signalled that the cycle from April 7th was maturing.

This was not an isolated observation. When we see five-wave completions in leading or highly liquid stocks, it often reflects a broader shift developing across the market. In other words, Delta was not just moving, it was sending a signal. A signal that the market was nearing the end of its current cycle and that a pullback phase was becoming increasingly likely.

When News Follows Structure​

It often appears that news “causes” market moves. In reality, markets frequently price in structure first, and news follows. The recent Iran conflict is a clear example. Once tensions escalated, markets reacted in a textbook risk-off manner: Oil prices surged on supply disruption concerns, energy stocks rallied, major indices (S&P 500, Nasdaq) pulled back, and high-beta assets (tech, small caps) sold off aggressively. This creates a feedback loop of fear. Traders shift into risk-off mode, often abandoning the broader trend entirely.

The Nature of Pullbacks: Messy by Design​

Pullbacks are rarely clean. They are typically volatile, overlapping, and emotionally difficult to trade. This is because corrections unfold in complex sequences, not straight lines. In our methodology:

Corrective structures develop in 3, 7, or 11 swings
Impulsive trends extend in 5, 9, 13, 17, or 21 swings

These extensions refine traditional Elliott Wave principles and allow for more precise timing. Geopolitical events amplify this complexity by compressing opportunity windows, increasing volatility, and distorting trader behaviour. This is exactly why most traders miss the move they were waiting for.

Removing Emotion: A Rule-Based Framework​

Success in this environment requires structure—not intuition. Our process is straightforward:

Identify the dominant trend
Wait for corrective sequences (3-7-11)
Execute within predefined zones
Let the market confirm the outcome

We also use what we call Blue Box zones—areas derived from:

Wave structure
Sequence relationships
Fibonacci extensions

These zones provide high-probability reaction areas, with historical accuracy approaching 85%.

Where We Are Now​

The market has now reached a key reaction area we identified weeks ago. This is not a moment to chase price. It is a moment to observe structure and prepare for the next move.

The latest META daily chart reflects this clearly:

META-Daily20260328190706-1024x504.png


META shows a completed impulsive sequence, followed by a three-wave corrective pullback. Now it supports the case for a near-term bounce. The minimum target has been achieved. From here, we allow the market to confirm direction while positioning for what could evolve into a much larger move.

Final Thought: Systems Over Emotion​

No system is perfect. But trading without a system guarantees inconsistency. Markets will always:

Create fear at the bottom
Create euphoria at the top
Punish emotional decision-making

The objective is not to be right 100% of the time. The objective is to operate with a structured edge. Because in the end, the difference is not who sees the move coming. It’s who is actually prepared to act on it.

Source: https://elliottwave-forecast.com/el...market-pullback-most-traders-will-miss-again/
 
Estée Lauder (EL) has completed a major bullish cycle within wave (III), which topped near 374.20. The structure within this advance shows a clear five-wave sequence, with wave I extending strongly and driving the broader trend higher. This type of extension often reflects strong momentum and institutional participation during the impulsive phase.

After completing wave (III), the stock entered a deep corrective phase in wave (IV). This pullback unfolded as a complex W-X-Y-X-Z structure and found support near 48.37. The decline corrected a large portion of the prior advance, but it maintained the overall bullish structure on the higher time frame. Price has now turned higher from this low, suggesting that the correction has likely completed. From the wave (IV) low, the market has already developed a clear 5-3 sequence. This structure supports the idea that a new impulsive cycle has started. We label this move as wave ((1)) followed by a corrective wave ((2)), which sets the foundation for further upside in wave (V).

EL_2026-04-01_05-44-13-scaled.png


Upside Targets and Trading Strategy

As long as price remains above 48.37, the bullish outlook stays intact. The next phase should see continued upside within wave (V). In the medium term, the stock has the potential to reach the 168 to 297 area. These levels align with key Fibonacci projections and previous structural zones.

Before reaching higher levels, the market may produce smaller pullbacks along the way. However, these dips should act as buying opportunities rather than signs of weakness. Traders should focus on identifying corrective structures such as 3, 7, or 11 swings to enter in the direction of the trend.

From a broader perspective, wave (V) must break above the previous wave (III) high at 374.20 to confirm a full bullish continuation. This remains a key requirement for the long-term trend to extend further. Given the current structure and momentum, the long-term targets extend well beyond the medium-term resistance zone.

Summary

Estée Lauder has likely completed its wave (IV) correction and started a new bullish cycle. As long as price holds above 48.37, the path of least resistance remains higher. The stock targets the 168–297 range in the medium term, with the potential to break above 374.20 and extend significantly in the long run.

Source: https://elliottwave-forecast.com/st...-wave-v-recovery-signals-strong-upside-ahead/
 
In this Elliott Wave update, the latest structure in Nike Inc. ($NKE) is being reviewed. A larger bearish sequence continues to be seen, and the stock remains under pressure within a grand super cycle correction.

ABC correction​

$NKE

$NKE 1H Elliott Wave Chart 3.24.2026:​

$NKE
On the current chart, a decline appears to have been completed in wave (3), and a bounce in wave (4) is now being projected. This rebound is being counted as an A-B-C corrective structure. In other words, the current recovery is not being viewed as impulsive strength, but rather as a temporary rally before another leg lower unfolds.

Furthermore, the projected wave C of (4) is expected to reach the blue box area between 54.30 and 55.55. This region has been defined as the next high-frequency reaction zone, where sellers are likely to reappear.

$NKE 1H Elliott Wave Chart 4.01.2026:​

$NKE

The latest update, from Apr 01, 2026, shows the stock selling as predicted. Currently, it is trading lower in wave 3 of (5) looking for continuation lower towards 45 area.

Summary

To summarize, $NKE remains in a grand super cycle correction, and bounces are being viewed as corrective, with the 45 area being targeted as the next major downside objective.

By applying the principles of Elliott Wave Theory, traders can gain a deeper understanding of market cycles, better anticipate the structure of upcoming moves, and ultimately enhance their risk management strategies in dynamic markets like the current one for $NKE.

Source: https://elliottwave-forecast.com/st...blue-box-area-offering-a-selling-opportunity/
 
Micron (MU) delivered a strong second quarter because AI memory demand expanded rapidly. Moreover, revenue exceeded expectations, which boosted institutional confidence. However, the market reacted cautiously since memory pricing remains highly cyclical. Therefore, analysts expect continued volatility while Micron manages inventories and increases capacity.

Even so, the consensus stays bullish because AI supports a favorable long‑term cycle. Additionally, several banks project higher prices if HBM demand accelerates further. Consequently, the stock could resume its upward trend once margins stabilize. Finally, investors monitor costs and production plans to confirm sustained momentum.

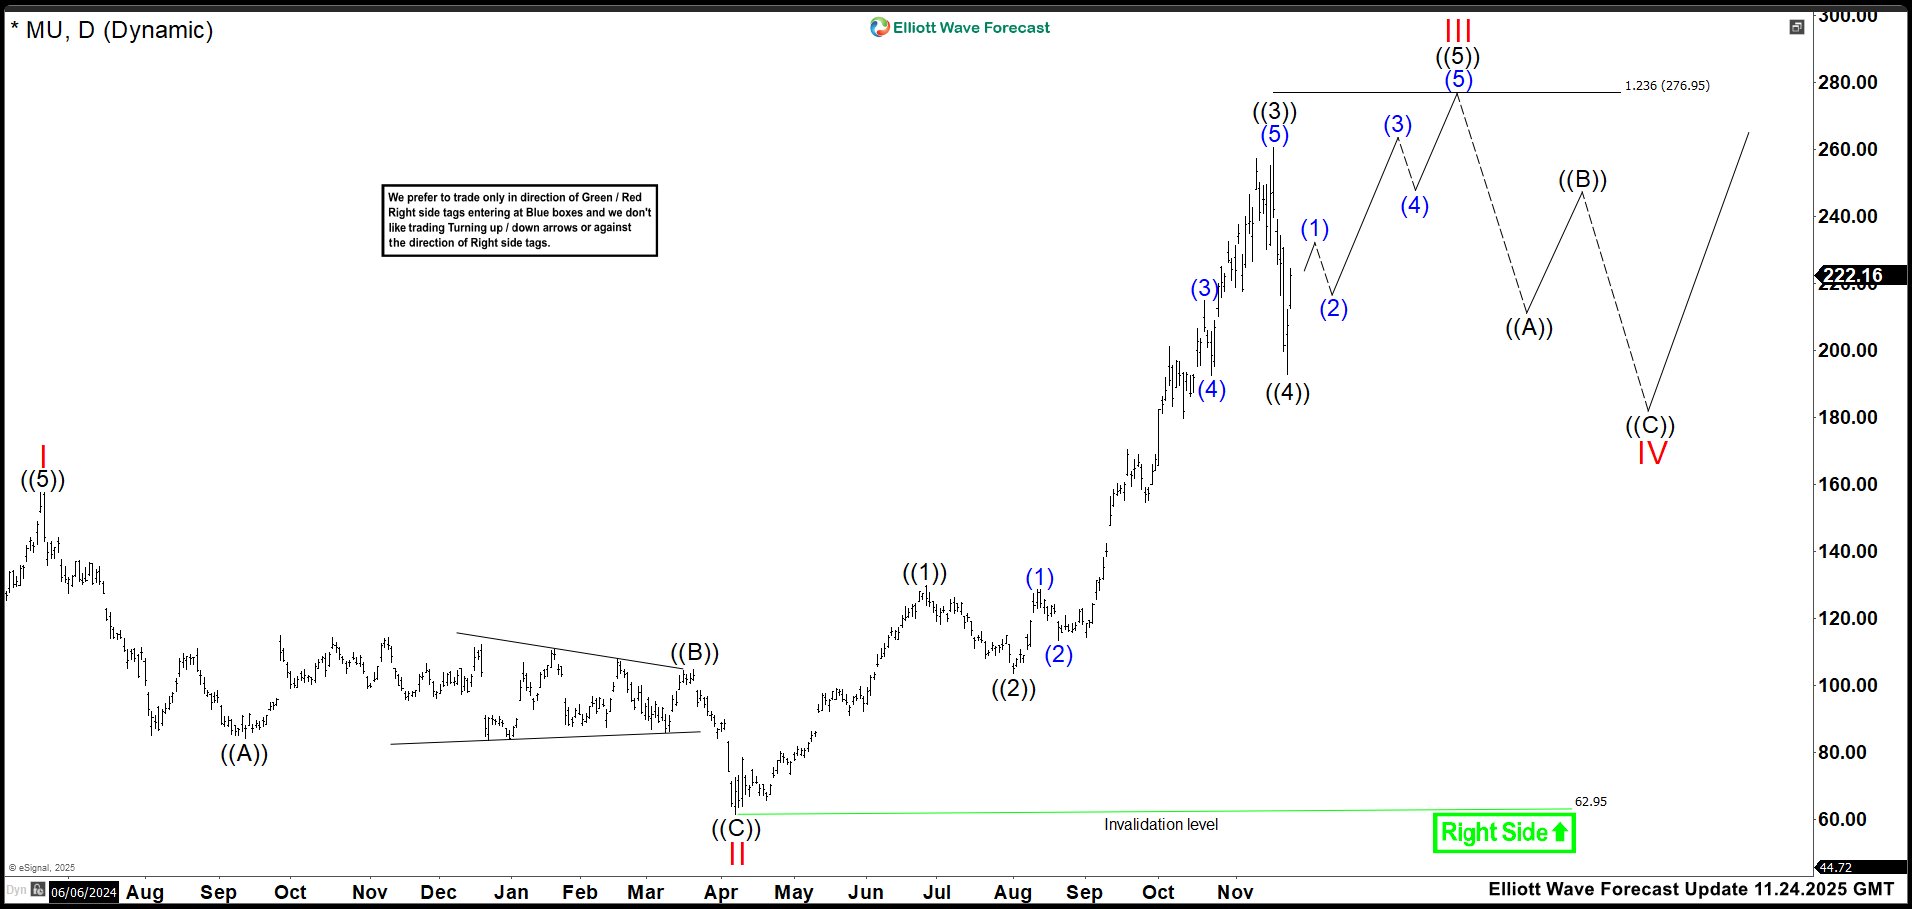
Elliott Wave Outlook: MU Daily Chart November 2025

Elliott Wave Outlook: MU Daily Chart November 2025


In the November update, MU maintained an impulsive structure and advanced with strong momentum. Then wave ((1)) ended at 129.96, and a correction followed toward 102.94. From that level, wave ((3)) began extending with increasing strength. As expected, wave ((3)) pushed higher and reached 261.03 in November. Afterward, MU dropped sharply to 192.58 over four days, which defined wave ((4)).

Looking ahead, the minimum target stood at 276.95, and price could extend if momentum persisted. Moreover, MU needed to break above 261.03 to complete wave ((5)) of III. This target did not signal an immediate short opportunity because the trend remained bullish. Instead, the level served as a projection, not a reversal trigger. Ultimately, MU could continue rising before any major correction develops. (If you want to learn more about Elliott Wave Principle, please follow these links: Elliott Wave Education and Elliott Wave Theory.)

Elliott Wave Principle Behind the Market Structure​

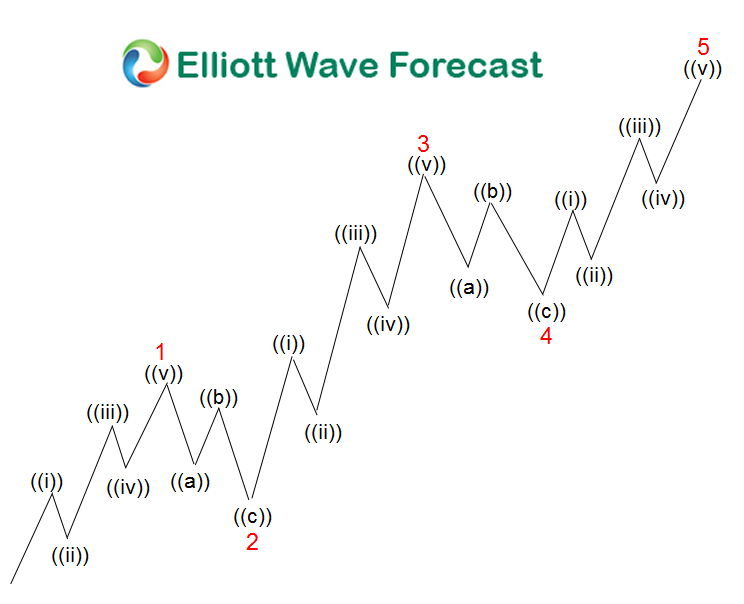
Impulse

An impulse is a clean 5‑wave pattern that drives the trend forward.

  • Waves 1‑3‑5 are strong and directional.
  • No overlap between waves 1 and 4.
  • Wave 3 is usually the strongest.
  • Structure is clear, with increasing momentum.

Impulse

Elliott Wave Outlook: MU Daily Chart April 2026

Elliott Wave Outlook: MU Daily Chart April 2026


In this update, MU not only broke above 300 but also extended toward 480 in a strong rally. Therefore, we adjusted the count from the April wave II low. Given the impulsive structure, we see two possible scenarios. First, the impulse from wave II may represent a new wave ((1)), and the market now develops wave ((2)). This view suggests wave (A) of ((2)) already ended, and MU currently advances in wave (B) of ((2)). We expect a move toward 406.46–447.93, where MU could reverse and start wave (C) of ((2)).

The second scenario proposes that the impulse from the April low is wave III, and the March correction is wave IV. Under this view, MU should break above the wave III high to complete wave V of (I). Ultimately, everything depends on the reaction inside the 406.46–447.93 area. Any strong rejection there could trigger a deeper decline. For now, price action still favors more upside against the wave IV low toward the 406.00 region.

Source: https://elliottwave-forecast.com/stock-market/mu-elliott-wave-targeting-zone/
 
McDonald’s (MCD) enters the second quarter with steady momentum as the stock trades near 307. Moreover, recent performance shows resilient demand despite a slower consumer environment. However, investors still want stronger comparable sales before supporting a sustained breakout. Therefore, the 320 level remains the key resistance for confirming a broader bullish continuation.

Looking ahead, analysts expect moderate revenue growth supported by digital expansion and stable margins. Additionally, the company benefits from consistent global traffic, which strengthens the quarterly outlook. Consequently, price action may push toward 340 if market conditions remain favorable. Ultimately, the trend stays constructive while the stock holds above the 300-support zone.

Elliott Wave Outlook: McDonald's MCD Weekly Chart December 2025

Elliott Wave Outlook: McDonald's MCD Weekly Chart December 2025

After several months, MCD prices action stayed stable without meaningful variation. Consequently, this stability suggested the market was forming a triangle or a bullish nest. We adopted the triangle scenario because we believed the April 2025 cycle was nearly complete. If this view was correct, it would deliver a correction shown on the chart as wave ((2)).

Meanwhile, we looked for one more high to complete wave ((1)), so price needed to hold above 283.63. This level supported our primary idea of targeting another high near 336.36. Finally, we monitored the market for a bearish reaction that could signal the end of wave ((1)) and the start of a possible correction.

(If you want to learn more about Elliott Wave Principle, please follow these links: Elliott Wave Education and Elliott Wave Theory.)

Elliott Wave Principle Behind the Market Structure​

Impulse

An impulse is a clean 5‑wave pattern that drives the trend forward.

  • Waves 1‑3‑5 are strong and directional.
  • No overlap between waves 1 and 4.
  • Wave 3 is usually the strongest.
  • Structure is clear, with increasing momentum.

Impulse

Elliott Wave Outlook: McDonald's MCD Weekly Chart April 2026

Elliott Wave Outlook: McDonald's MCD Weekly Chart April 2026

In our latest update, McDonald's Corporation (MCD) made a higher high and completed the leading diagonal, then pulled back as expected, confirming the initial corrective phase. However, the correction still appears incomplete, suggesting further downside is likely, and therefore we expect price to continue declining before the structure is fully resolved. Specifically, the correction could extend into the 292.59–280.99 zone, where wave ((2)) should complete before the trend resumes.

After that, the broader bullish cycle is expected to resume, but for now we must remain patient and disciplined in our approach. We should wait for buying opportunities within the projected support zone and let the market come to us instead of forcing entries prematurely. At this stage, we should avoid both buying and selling positions, and we will reassess the structure and opportunities in the next update.

Source: https://elliottwave-forecast.com/stock-market/mcdonalds-mcd-wave-correction-outlook/
 
Adobe Inc., (ADBE) operates as a technology company worldwide. The Digital Media segment offer products & services to individuals, teams & enterprises to create, publish & promote content. It comes under Technology sector in Software-Application & trades as “ADBE” ticker at Nasdaq.

ADBE ended ((I)) at $699.54 high in yearly chart since inception & correcting it lower. It favors ((II)) pullback in zigzag correction into $212.73- $112.19 area. Buyers looking for next long set up enter below $212.73.

In yearly, it ended ((I)) at $699.54 high in November-2021. Below there, it favors ((II)) pullback in 3 swings correction. It placed (a) of ((II)) at $274.73 low in September-2022 & (b) at $638.25 high in January-2024. Within (a) down, it ended I at $604.30 low, II at $675.21 high, III at $338 low, IV at $451.15 high & V at $274.73 low. It ended a of (b) at $402.49 high, b at $318.60 low & extended c at $638.25 high. Below (b) high, it placed I at $433.97 low, II at $587.75 high & favors downside in III of (c).

ADBE - Elliott Wave Latest Weekly View:​

ADBE-W1.jpg

It ended ((1)) of III at $332.01 low, ((2)) at $422.95 high, ((3)) proposed ended at $233.16 low & favors bounce in ((4)). Within ((3)), it placed (1) at $311.58 low, (2) at $362.71 high, (3) at $244.28 low, (4) at $285.36 high & (5) at $233.16 low. The ((4)) should bounce into $278.43 – $306.22 area in 3 or 7 swings before lower in ((5)) of III. It expects two or few more lows to extend (c) into $212.73 or lower in ((II)) pullback. Sellers may enter in 3, 7 or 11 swings bounce when reaching extreme area, while bounce fail below trendline. Long term investors can enter below $212.7 for the next leg higher in yearly set up from blue box or 3 swings rally.

Source: https://elliottwave-forecast.com/stock-market/adbe-analysis-deeper-pullback-below-before-next-rally/
 
Hut 8 Corp (NASDAQ: HUT) surged 550% from its April 2025 low. Now, the stock is undergoing a larger degree correction. Today, we inspect its current Elliott Wave structure. Our analysis reveals the next high-probability buying opportunity.

Elliott Wave Analysis

HUT completed a five-wave advance in wave (I) at $66.07 in January 2026. Since then, it has been forming a double three corrective structure (w-x-y). Wave w ended at $43.81. Subsequently, wave x bounced to $61.82. Now, wave y is in progress. Price must stay below the descending trendline and below $56.87 high for this pattern to remain valid.

The downside target for this correction is the $39.46 - $25.67 Blue Box zone. This high-frequency area represents the next potential investment zone. Buyers should emerge there to end wave (II). At minimum, a three-wave bounce will occur from this area.

HUT Daily Chart 4.7.2026

HUT Daily 4.7.2026

Conclusion​

HUT larger-degree bullish cycle remains firmly intact. Therefore, investors should continue targeting buying opportunities within weekly and daily pullbacks. Utilize our Elliott Wave strategy for precise entry timing. Specifically, establish positions after a 3, 7, or 11-swing correction completes. Additionally, our proprietary Blue Box system highlights high-probability zones with pinpoint accuracy. As a result, this disciplined method gives traders the clarity and confidence to catch the next bullish leg.

Source: https://elliottwave-forecast.com/stock-market/hut-corp-investment-opportunity/
 
In this technical blog, we will look at the past performance of the Daily Elliott Wave Charts of Gold. In which, the rally from all time low is unfolding as impulse sequence & showed a higher high sequence therefore, called for an extension higher to take place. We knew that the structure in XAUUSD should remain supported & extend higher. So, we advised members not to sell the metal & buy the dips in 3, 7, or 11 swings at the blue box areas. We will explain the structure & forecast below:

Gold Daily Elliott Wave Chart From 3.21.2026​

Gold Buyers Step In at Blue Box Zone — Risk-Free Longs Secured


Here’s the Daily Elliott wave Chart from the 3.21.2026 Weekend update. In which, the high to $5598.75 completed the rally from September 2022 lows & made a pullback lower. The internals of that pullback unfolded as Elliott wave zigzag correction where wave a ended at $4402.06 low. Then a rally to $5419.32 high-ended wave b bounce. Then started the next leg lower in wave c towards $4230.96- $3496.04 blue box area. From there, buyers were expected to appear looking for new highs ideally or for a 3-wave bounce minimum.

Gold Latest Daily Elliott Wave Chart From 4.04.2026​

Gold Buyers Step In at Blue Box Zone — Risk-Free Longs Secured


This is the latest Daily Elliott wave Chart from the 4.04.2026 Weekend update. In which the XAUUSD is showing a strong reaction higher taking place, right after ending the correction within the blue box area. Allowed members to create a risk-free position shortly after taking the long position at the blue box area. However, a break above $5598.75 high is needed to confirm the next extension higher & avoid deeper pullback. It's important to note that with more data, we were able to adjust the corrective pattern into double three structure.

Source: https://elliottwave-forecast.com/bl...-in-at-blue-box-zone-risk-free-longs-secured/
 
The VanEck Junior Gold Miners ETF (GDXJ) is a specialty equity fund that tracks the MVIS® Global Junior Gold Miners Index, offering investors exposure to smaller-cap gold mining companies worldwide. It is widely used as a leveraged play on gold prices due to the higher volatility and growth potential of junior miners.

GDXJ Monthly Elliott Wave View​

GDXJ-Monthly20260407155944.jpg


The monthly chart of GDXJ indicates that the ETF established a major bottom in 2016 at $16.87. From that low, price advanced in a nesting impulse structure. Wave (I) terminated at $52.50, followed by a corrective decline in wave (II) to $19.52. The ETF then nested higher, with wave I of (III) ending at $65.95. Wve II of (III) pulled back to $25.80. Wave III of (III) extended sharply to $157.49, while the subsequent wave IV of (III) correction is proposed complete at $95.13.

For confirmation, GDXJ must break above the prior wave III of (III) peak at $157.49 to eliminate the risk of a double correction in wave IV. Assuming this occurs, the ETF is expected to advance in wave V, completing the larger wave (III), before undergoing a wave (IV) pullback and resuming higher again. As long as price remains above the 2016 low at $16.87, the broader outlook favors continued upside.

GDXJ Daily Elliott Wave View​

GDXJ-Daily20260407142753.jpg


The Daily Elliott Wave chart of GDXJ provides a detailed view of the subdivisions within wave (III). Wave II of (III) concluded at $25.98, while wave III of (III) peaked at $157.49. Wave III unfolded as a classic impulse in lesser-degree waves ((1))–((2))–((3))–((4))–((5)). The subsequent wave IV correction ended at $95.13, and the ETF has since resumed its rally. Looking ahead, GDXJ is expected to extend higher in wave V, completing the larger wave (III). A break below $95. 13 would imply that wave IV is evolving into a double correction. Support will then likely to emerge at the next extreme area in either a 3- or 7-swing sequence. Importantly, the broader bullish outlook remains valid as long as the pivot low at $25.98 holds.

GDXJ 4 Hour Elliott Wave View​

GDXJ-4-Hour20260407160003.jpg


The 4‑hour Elliott Wave chart of GDXJ highlights provides a detailed subdivision of the recent wave IV pullback. Internally, wave IV unfolded as a zigzag structure. From the wave III peak, wave ((A)) ended at $127.79 and wave ((B)) rebounded to $142.40. Wave ((C)) declined to $95.13, completing wave IV. As long as price holds above $95.13, the ETF is expected to extend higher. A break below this level, however, would indicate that wave IV is evolving into a double correction.

Source: https://elliottwave-forecast.com/video-blog/gdxj-breaks-correction-targets-higher/
 
In this Elliott Wave update, Meta Platforms Inc. ($META) is being revisited following the previously discussed blue box support areas. As anticipated, the reaction from those areas has happened as expected. Buying interest was seen from the blue box zones, and a meaningful bounce has been produced. As a result, the bullish sequence has been respected, and further upside is now being allowed while the stock remains above the key invalidation level.

$META

Reaction From the Blue Box Areas Has Been Confirmed​

$META

In the prior outlook, attention was drawn to the blue box area as high-frequency support zones where the correction was expected to be completed and buyers were expected to step in. That view has now been validated by price action.

A strong reaction was produced from the blue box, and a major rally followed in line with expectations.

Why the Blue Box Areas Mattered​

In Elliott Wave analysis, blue box areas are commonly used to identify extreme zones where corrective structures tend to finish. In $META, those areas were reached after corrective declines, and selling pressure began to fade once support was tested.

Consequently, a bullish reaction was produced instead of a continued breakdown. This is exactly why selling was not recommended into the blue box, and that approach has now been justified by the market response.

Current $META Structure​

At this stage, $META appears to have completed another corrective leg into the recent blue box area at 528.43 – 394.14. From there, a bounce has already been seen, suggesting that wave (II) may have ended and that the next leg higher may now be getting started.

Moreover, the chart shows that price has reacted strongly after entering the blue box, which keeps the preferred bullish path intact. As long as the March 30th low at 520.26 remains protected, the recovery can continue to develop.

Near-Term Outlook​

For now, additional upside can be allowed while the stock continues to recover from the blue box support area. Although short-term pullbacks can still be seen, they are expected to remain corrective as long as the larger bullish structure stays valid.

Furthermore, the current rebound suggests that buyers are still defending the key support region. If that remains the case, the next advance can continue to unfold in the sessions ahead.

Technical Summary​

To summarize, the reaction from the blue box areas in $META has happened as expected. Support was found in those zones, buyers stepped in, and a strong rebound was produced.

As a result, the blue box setup has once again worked well in identifying a high-probability reversal area. While the stock remains above 520.26, the bullish sequence can stay supported and more upside can be seen.
 
Morgan Stanley MS continues to trade within a strong bullish Elliott Wave structure at cycle degree. The stock has developed a clear impulsive sequence over the long term, and price now approaches the final stages of this advance. The current structure suggests that MS is working on the last five-wave move higher within blue wave (5) of ((5)), which will complete the larger cycle degree wave III around the 265.61 price level.

In the near term, the stock may continue to push higher in a final impulsive leg. The trend remains bullish for now, and buyers still control the market direction as long as the structure holds.

MS_2026-04-09_05-15-14-scaled.png

Limited Upside in MS Followed by Wave IV Pullback Opportunity

Once Morgan Stanley completes the final leg within wave (5) of ((5)), the market should enter a corrective phase in wave IV. This correction will likely unfold in at least three swings and could develop into a more complex structure such as 3, 7, or 11 swings. Unlike the current impulsive move, wave IV should bring a deeper pullback and reset the trend before the next bullish phase begins. Based on the broader structure and key support zones visible on the chart, the expected pullback could reach the 95–65 area. This region aligns with previous support levels and Fibonacci retracement zones, making it a high-probability area for buyers to re-enter the market.

In the short term, traders should avoid chasing the rally at higher levels as the upside remains limited. Instead, the focus should shift toward preparing for the upcoming correction. The best strategy will involve waiting for wave IV to complete and then looking for buying opportunities at extreme levels.

Summary

Morgan Stanley is approaching the final stage of its bullish cycle within wave III, with limited upside remaining below 322. Once this move completes, a larger wave IV correction should follow, potentially reaching the 95–65 zone. This pullback will likely provide a strategic buying opportunity before the long-term uptrend resumes.

Source: https://elliottwave-forecast.com/st...nley-ms-elliott-wave-analysis-wave-5-outlook/
 
CrowdStrike Holdings Inc (CRWD) from the perspective of the Elliott wave theory favors the upside to continue. However, the stock is currently undergoing a corrective phase. The blog post will discuss two scenarios by which the corrective phase could finish before the prevailing bullish trend resumes.

From the low of March 2020, when CRWD was trading at $32.6, prices surged in a 9-swing structure, reaching a high of $566 in November 2025. This indicates an impulse wave from the long-term low. However, the impulse wave cycle from March 2020 is not yet complete. Considering the cycle degree, wave I ended in November 2021 at $298, as shown in the weekly chart below. A pullback for wave II followed, reaching $92.2, thus ending the first significant bearish cycle in January 2023. From the low in January 2023, wave III began. Third waves in an impulse cycle are always impulse structures. Therefore, wave III is likely in a multiple nest, suggesting an extended wave III that is likely to reach and exceed 2.618 x Wave I from Wave II.

CRWD Weekly Elliott Wave Chart - 13th April, 2026

CRWD


From the weekly chart above, the price continued to evolve in a sequence of higher highs and higher lows. Waves ((1)) and ((2)) of III ended in March 2024 and August 2024 with an impulse and a flat structure, respectively. Wave ((3)) started from the August 2024 low, with a projected target of $936 – 1.618x wave ((1)) from ((2)). The stock reached its peak of $566 in November 2025, completing a diagonal structure for wave (1) of ((3)). A pullback followed for wave (2) of ((3)), with the technical invalidation level at the low of wave ((2)).

Looking ahead, two scenarios are possible. First, wave (2) could extend further in a double correction, with the current bounce from the February 2026 low developing as wave X of (2) after completing wave W at the same low. Therefore, if the pullback deepens, traders should consider buying at the extreme, aiming for profits exceeding the $700s and $800s. Alternatively, wave (2) may have already concluded at the March 2026 low within the $359-$280 extreme buying zone. Traders who have already gone long can hold their position, adjusting their stop-loss to $342. Going forward, if the recovery from $342 is impulsive, rising above $487 and towards the $566 high, there could be another opportunity to buy the dip. Selling against the bullish trend at the extreme of the pullback is not advised.

Source: https://elliottwave-forecast.com/stock-market/crwd-elliott-wave-analysis-showing-nest/
 
The Nasdaq-100 ETF (QQQ) appears to have ended its correction against the April cycle. The current resurgence stems from the blue box, where we recommended members to go long. In this blog post, we will analyze the structures, the blue box, and what to expect next.

Indices began to sharply rebound last week after correcting the April cycle for over two months. We believe the April bullish cycle for most indices ended in January/February 2026. As for QQQ, the pullback against the April cycle began in late October 2025. We confirmed the peak to our members and recommended selling. We anticipated the correction against the April low to occur in a 3, 7, or 11-wave corrective sequence. We looked to buy at the extreme of any of these correction stages, as long as it wasn't too shallow – below a 23.6% retracement. The length of the correction confirmed that we weren't dealing with a 4th wave of the April cycle, but rather a complete correction. Therefore, we considered a 38.2% retracement and deeper as an additional guideline.

QQQ Elliott Wave Bullish Setup - 22nd March, 2026

QQQ


On March 22nd, we shared the QQQ Daily chart with Elliottwave-Forecast members. The chart revealed the pullback as a 7-swing structure, as a 3-swing structure was considered too shallow. The 7-swing pullback extended to the blue box, where we recommended members to go long on the stock ETF. The blue box covers the 580.13-345.14 area, and we anticipated the low to be within this zone. Therefore, we didn't need to pinpoint the exact low. Consequently, members went long at 580 with a stop at 545. We provided members with subsequent daily charts displaying this blue box for several days, giving them ample time to decide and set their pending orders.

QQQ Elliott Wave Bullish Setup (Update) - 12th April, 2026

qqq


On April 12, 2026, we alerted members with the daily update chart above. The chart shows the price triggered the blue box and reacted sharply upwards. At the time of writing, the ETF was trading at $620. Given the strength of this rally, there is a 70% probability of a new high. Thereafter, buyers will likely look for entry points from the blue box again. However, until that high is breached, we cannot completely rule out the possibility of a 15-swing pullback extending deeper (30% chance). As for us and our members, we have already booked profits on half of our position and left the remainder with an adjusted stop to ensure a risk-free trade.

Source: https://elliottwave-forecast.com/stock-market/qqq-ended-correction-from-blue-box/
 
Royal Bank of Canada., (RY) operates as diversified financial service company worldwide. It operates through personal finance, commercial banking, wealth management & Insurance segments. It comes under Financial services sector & trades as “RY” ticker at NYSE.

RY favors nesting within October-2023 sequence, while dips remain above $156.91 low. Above March-2026 low, it should continue rally in (3) of ((3)), which confirms once momentum divergence erased.

Since March-2020 low as (II), it started rally in (III) in weekly. It placed I of (III) at $119.41 high in January-2022 & II at $77.90 in October-2023 low. Above there, it ended ((1)) of III at $128.05 high, ((2)) at $106.10 low & favors rally in ((3)) as nest from April-2025 low. Within ((1)), it ended (1) at $176.19 high & proposed ended (2) at $156.91 low as shallow pullback. In (1), it placed 1 at $149.26 high, 2 at $143.13 low, 3 at $174.61 high, 4 at $164.95 low & 5 at $176.19 high.

RY - Elliott Wave Latest Weekly View:​

RY-W5.jpg

Further rally in (3) will confirm, when it breaks above $176.19 high. Until then it can still do double correction in (2), if breaks below $156.91 low to correct against April-2025 low. We like to buy the pullback, if doing double in (2) at extreme area. The next rally in (3) can extend towards $226.8 or higher in weekly. Alternatively, it can extend towards $180.7- $188.1 area to finish five swings in ((1)) from October-2023 low before correcting in ((2)). In either the case, investors can look for buy in dips if reach extreme area.

Source: https://elliottwave-forecast.com/st...lliott-wave-signals-strong-upside-toward-226/
 
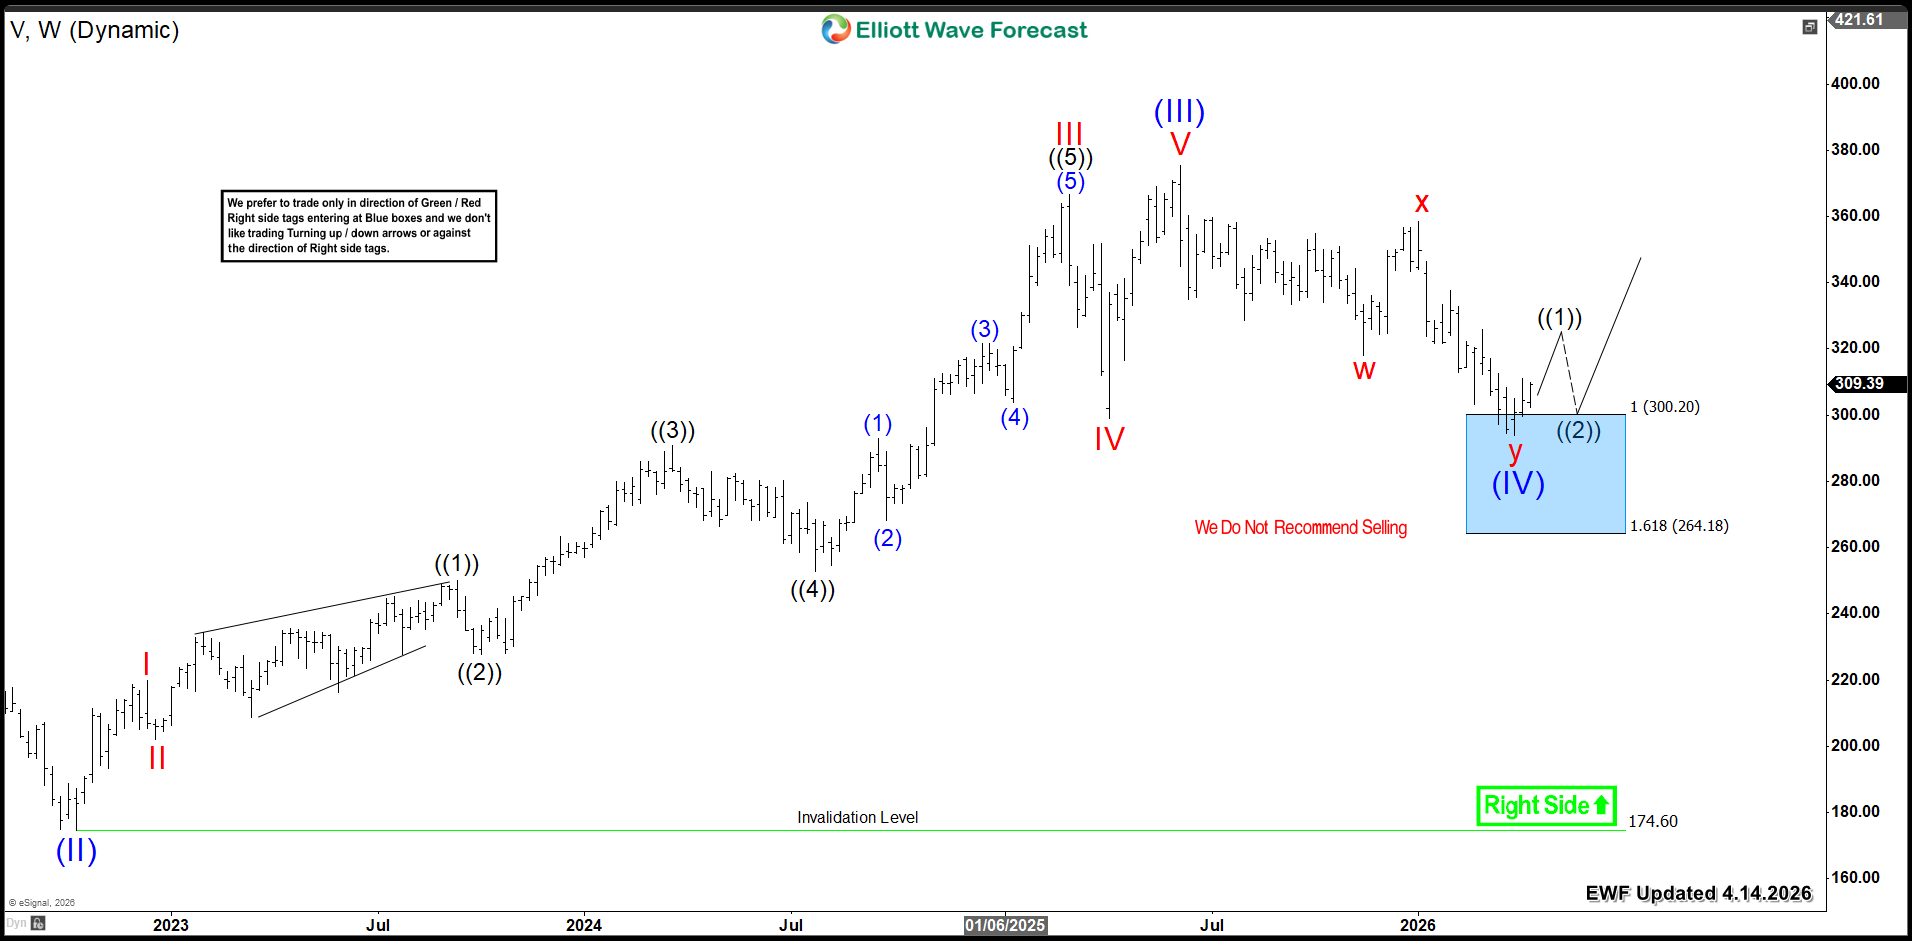
Last year, we explained Visa (NYSE: V) bullish sequence and outlined the reasons for more upside. Now that this cycle has ended, we analyze the recent weekly correction. This pullback presents a fresh investment opportunity. Therefore, we update our bullish view for the stock.
Looking at Visa's Elliott Wave count, the cycle from the 2022 low has ended. A five-wave advance marked wave (III) at $375. Following that peak, the stock started a pullback in wave (IV). This correction shaped a corrective double three structure. Price already reached the $300 - $264 Blue Box zone. Investors should buy from this extreme area for the next move higher.

Consequently, Visa should react to the upside with at least a three-wave bounce. Ideally, wave (V) will begin from this zone. This next cycle should target at least the $395 - $427 area.

Visa V Weekly Chart 4.14.2026​

Visa V Weekly 4.14.2026

Conclusion​

Visa's larger-degree bullish cycle remains firmly intact. Therefore, investors should target buying opportunities within weekly and daily pullbacks. Utilize our Elliott Wave strategy for precise entry timing. Specifically, establish positions after a 3, 7, or 11-swing correction completes. Additionally, our proprietary Blue Box system highlights high-probability zones with pinpoint accuracy. As a result, this disciplined method provides traders with clarity and confidence. Ultimately, it positions you to capture the next bullish leg.

Source: https://elliottwave-forecast.com/stock-market/visa-v-establishes-300-base/
 
In this Elliott Wave update, we take a look at the latest structure in Netflix Inc. ($NFLX). The stock continues to show an incomplete bullish sequence, which suggests that higher prices should still be seen before the current move is finished. As a result, the next upside area to watch comes at 115–130. Moreover, a break to new all-time highs would confirm that a new bull cycle is taking place.

5 Wave Impulse​

$NFLX

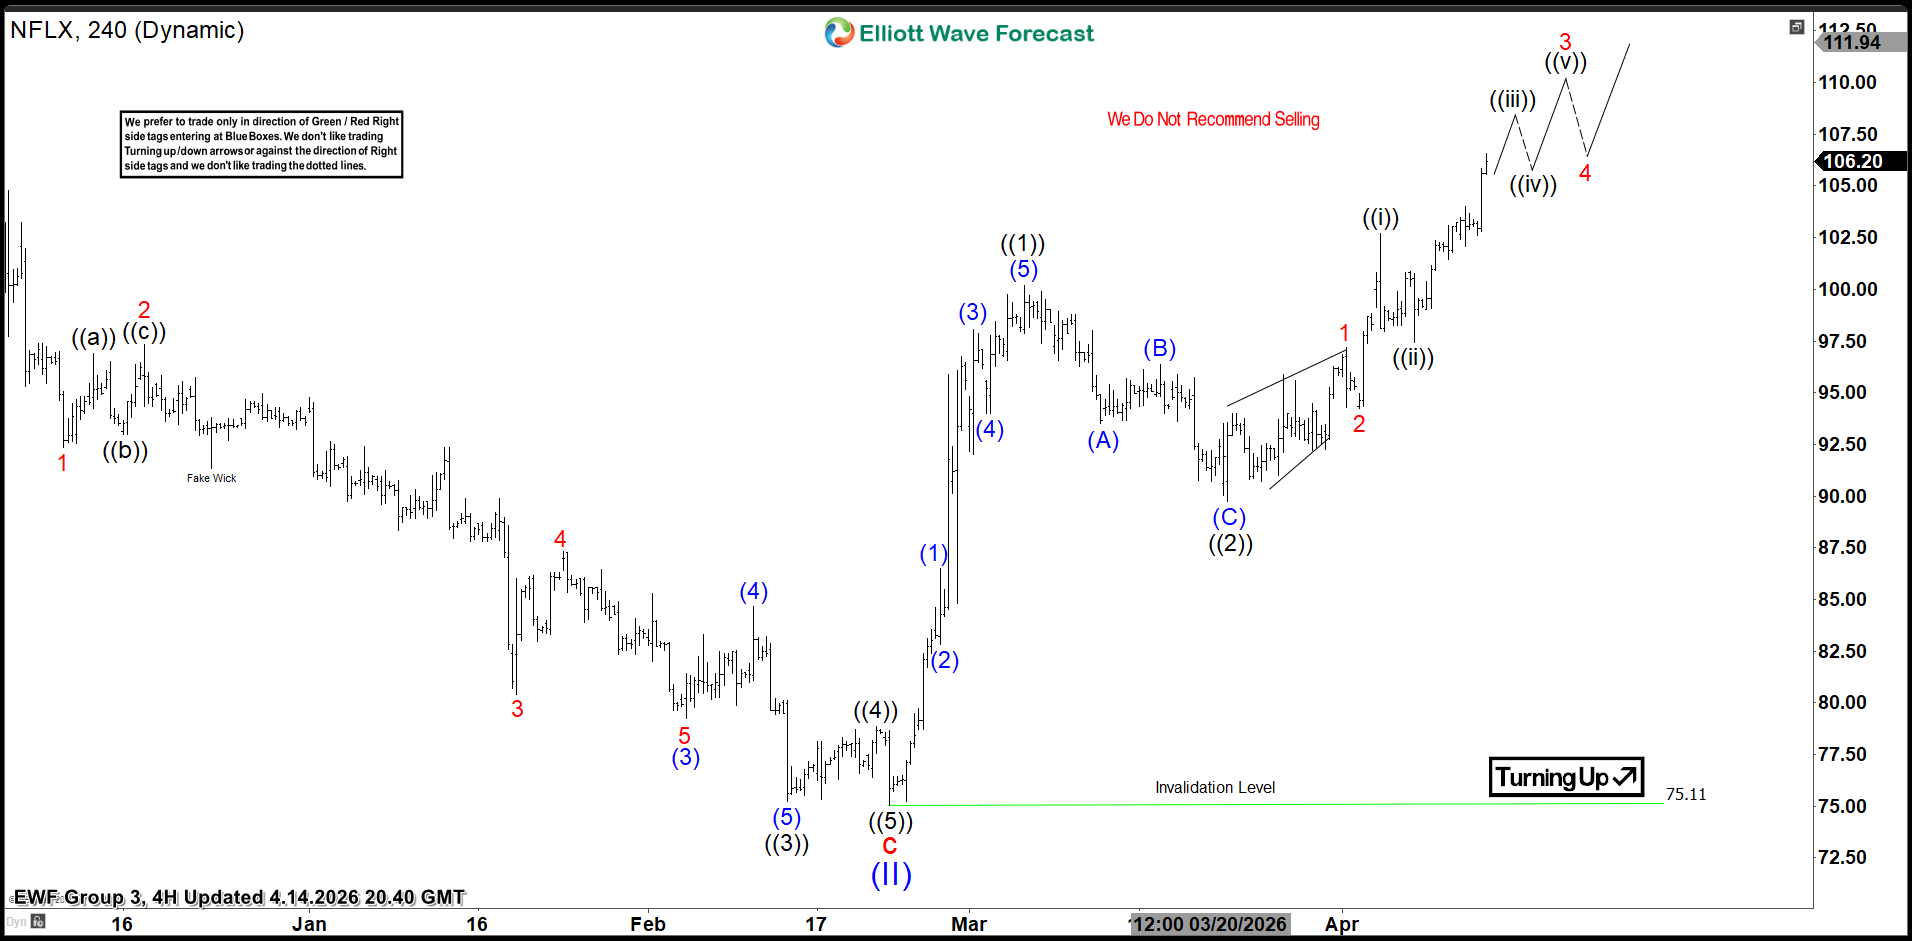
$NFLX 4-Hour Elliott Wave View​

$NFLX

Looking at the 4-hour chart, $NFLX appears to have completed a meaningful low on 2/23 at 75.11 and then turned higher in a clear impulsive structure. From that low, the stock has continued to build a series of higher highs and higher lows, which supports the bullish outlook.

More importantly, the rally does not appear complete yet. Instead, the current structure suggests that the stock still trades within an unfinished upside sequence. In other words, buyers remain in control, and the market likely needs more upside before the cycle fully matures.

Incomplete Bullish Sequence Remains in Place​

At this stage, the advance from the recent low is unfolding in a constructive Elliott Wave pattern. Pullbacks have remained corrective, while each dip has continued to attract buyers. Consequently, the broader sequence still favors higher prices rather than a larger bearish reversal.

This matters because an incomplete bullish sequence often points to continuation in the direction of the trend. Therefore, until the sequence finishes or the structure breaks down, the preferred path remains higher.

Upside Target at 115–130​

Based on the current wave structure, $NFLX is expected to extend toward the 115–130 region. This area marks the next important upside zone as the bullish sequence continues to unfold.

Although short-term pullbacks can still happen along the way, they should remain corrective while the stock continues to trade within this bullish pattern. For that reason, dips are more likely to be viewed as part of the ongoing advance rather than as signs of a completed top.

New All-Time Highs Would Confirm a New Bull Cycle​

Perhaps most importantly, a push into new all-time highs would provide strong confirmation that a new bull cycle is taking place. That would show the stock is not simply bouncing within a larger corrective structure. Instead, it would signal that $NFLX has entered a fresh higher-degree bullish phase.

Accordingly, traders should keep a close eye on how price behaves as it approaches prior record highs. If that level breaks decisively, the bullish case would strengthen further and support the view that a larger cycle to the upside has already started.

Near-Term Outlook​

For now, the path of least resistance remains higher. While the market can still produce short-term pauses or pullbacks, the overall sequence remains constructive and incomplete. As long as the current structure stays intact, the bullish view should remain favored.

Meanwhile, the chart also shows an invalidation level at 75.11. As long as $NFLX stays above that level, the current wave count remains valid and the upside targets remain in focus.

Technical Summary​

To summarize, $NFLX continues to show an incomplete bullish sequence, which keeps the upside path favored. The next important target area comes at 115–130, and a break to new all-time highs would confirm that a new bull cycle is taking place.

Therefore, while short-term pullbacks can still occur, the broader structure continues to support additional upside as long as the bullish sequence remains intact.

Source: https://elliottwave-forecast.com/st...ncomplete-bullish-sequence-points-to-115-130/
 
Industrial Select Sector SPDR Fund (XLI) ended the March 2026 pullback at the point where Elliott Wave Forecast Blue Box recommended members to go long. What's next following this rebound?

The US Industrial sector has been one of the most profitable since the turn of the millennium. The XLI ETF established a long bullish cycle from the March 2009 low. Since then, it has remained bullish, continuing to establish a higher high - lower low sequence.

Our weekly chart shows the end of the cycle degree wave IV of the supercycle wave (I) at the low of March 2020. From that low, the ETF moved upwards for about two years, establishing a top in November 2021, where we placed wave (I). From that peak, the price corrected lower to finish wave (II) in October 2022.

Meanwhile, from the October 2022 low, the supercycle degree wave (III) commenced. Wave I of (III) concluded at the November 2024 high. A subsequent sharp pullback extended until April 2025, where we identified the conclusion of wave II of (III). The resurgence from April 2025 continued throughout 2025 and into 2026, mirroring trends seen in most stocks, indices, and ETFs. XLI peaked in March 2026, establishing ((1)) of III of (III). Consequently, since the March 2020 low, XLI has completed a distinct 5-swing sequence, which should extend to at least 9 swings. At the break of the previous peak, we recommended members to buy the dips within the blue box. Our most recent trade setup was shared on March 18th.

XLI Elliott Wave Trade Setup - 18th March, 2026 Update

XLI-4-hr-18-march-before-1024x573.png


On March 18, 2026, we shared the chart above with members. The chart illustrates the nature of the pullback for wave ((2)) of I from the March 2026 peak. The structure was developing as an incomplete double zigzag, a 7-swing price pattern, which is one of our "bread and butter" setups. Therefore, we shared the chart, highlighting the blue box at 158.36-149.69. From this blue box, we recommended members to go long on the ETF.

XLI Elliott Wave Trade Setup - 16th April, 2026 Update

xli

Barely a month later, we shared the chart above with members. The H4 chart shows the price completed the double zigzag structure as expected. In addition, the structure finished in the blue box buying zone. A big resurgence quickly followed as soon as the price triggered the blue box. The resurgence lasted throughout the last week and is poised to continue in the coming weeks. With this, members booked partial profit from the blue box and are now holding the rest of the trade at breakeven. This is how we provide members daily with blue boxes for 78 instruments across all timeframes.

Source: https://elliottwave-forecast.com/stock-market/xli-stays-bullish-from-blue-box/
 
Johnson & Johnson (JNJ) engages in research & development, manufacture & sale of range of products in the healthcare sector worldwide. It operates through Innovative Medicine & MedTech. It comes under Healthcare sector & trades as “JNJ” at NYSE.

The JNJ favors rally in bullish sequence from January-2025 low. Currently, it favors double correction lower in ((4)) & find support between $227.8 – $215.82 area to rally higher. Buyers will enter into that area for at least 3 swings bounce.

JNJ - Elliott Wave Latest Daily View:​

In weekly, it ended (I) impulse at $186.69 high in April-2022 & (II) correction at $140.68 low in January-2025. The pullback in (II) as choppy double three structure. Within (II), it ended w at $150.11 low, x at $175.97 high & y at $140.68 low. Above April-2025 low, it ended ((1)) of I at $169.99 high, ((2)) at $141.50 low, ((3)) at $251.71 high & favors pullback in ((4)) in 3 or 7 swings (or triangle) correction. It is showing extended ((3)) sequence. In ((3)), it ended (1) at $159.44 high, (2) at $146.12 low, (3) at $215.19 high, (4) at $200.91 low & (5) at $251.71 high.

JNJ - Elliott Wave Daily View From 3.16.2026:​

Below $251.71 high, it favors 7 swings pullback in ((4)) to correct against April-2025 low. In ((4)), it ended (W) in 3 swings at $232.24 low, (X) at $247.21 high & favors lower in (Y). It broke below (W) low, favoring downside into $227.8 – $215.82 area to finish ((4)). Buyers can look for long entry in blue box area for next rally. Once it ends ((4)) in blue box area, it expects rally targeting above $259 to extend January-2025 sequence. We do not like selling it in any pullback as overall bias is bullish & close to find support.

Source: https://elliottwave-forecast.com/stock-market/jnj-forecast-buyers-should-enter-227-8-215-8-area/
 
In this technical blog, we will look at the past performance of the 4-hour Elliott Wave Charts of CHFJPY. In which, the rally from September 2024 low is unfolding as an impulse sequence. Therefore, called for more upside to take place. We knew that the structure in the pair should remains incomplete & should see more upside. So, we advised members not to sell the pair & buy the dips in 3, 7, or 11 swings at the blue box areas. We will explain the structure & forecast below:

CHFJPY 4-Hour Elliott Wave Chart From 3.31.2026​

CHFJPY Achieves New Highs from Blue Box Zone


Here’s the 4-hour Elliott wave Chart from 3.31.2026 update. In which, the rally to 204.01 high completed wave ((1)) & made a pullback in wave ((2)). The internals of that pullback unfolded as Elliott wave double correction where wave (W) ended at 199.47 low. Then a bounce to 202.49 high-ended wave (X) & started the (Y) leg lower towards 197.97- 195.18 blue box area. From there, buyers were expected to appear looking for new highs ideally or for a 3-wave bounce minimum.

CHFJPY Latest 4-Hour Elliott Wave Chart From 4.20.2026​

CHFJPY Achieves New Highs from Blue Box Zone


This is the latest 4-hour Elliott wave Chart from the 4.20.2026 update. In which the pair is showing a strong reaction higher taking place, right after ending the double correction within the blue box area. Allowed members to create a risk-free position shortly after taking the long position at the blue box area. Since than the pair has already made a new high above previous wave ((1)) high confirming the next leg higher towards 205.51- 207.92 initial target area before profit taking & next pullback unfolds.

Source: https://elliottwave-forecast.com/bluebox-wins/chfjpy-achieves-new-highs-blue-box/
 
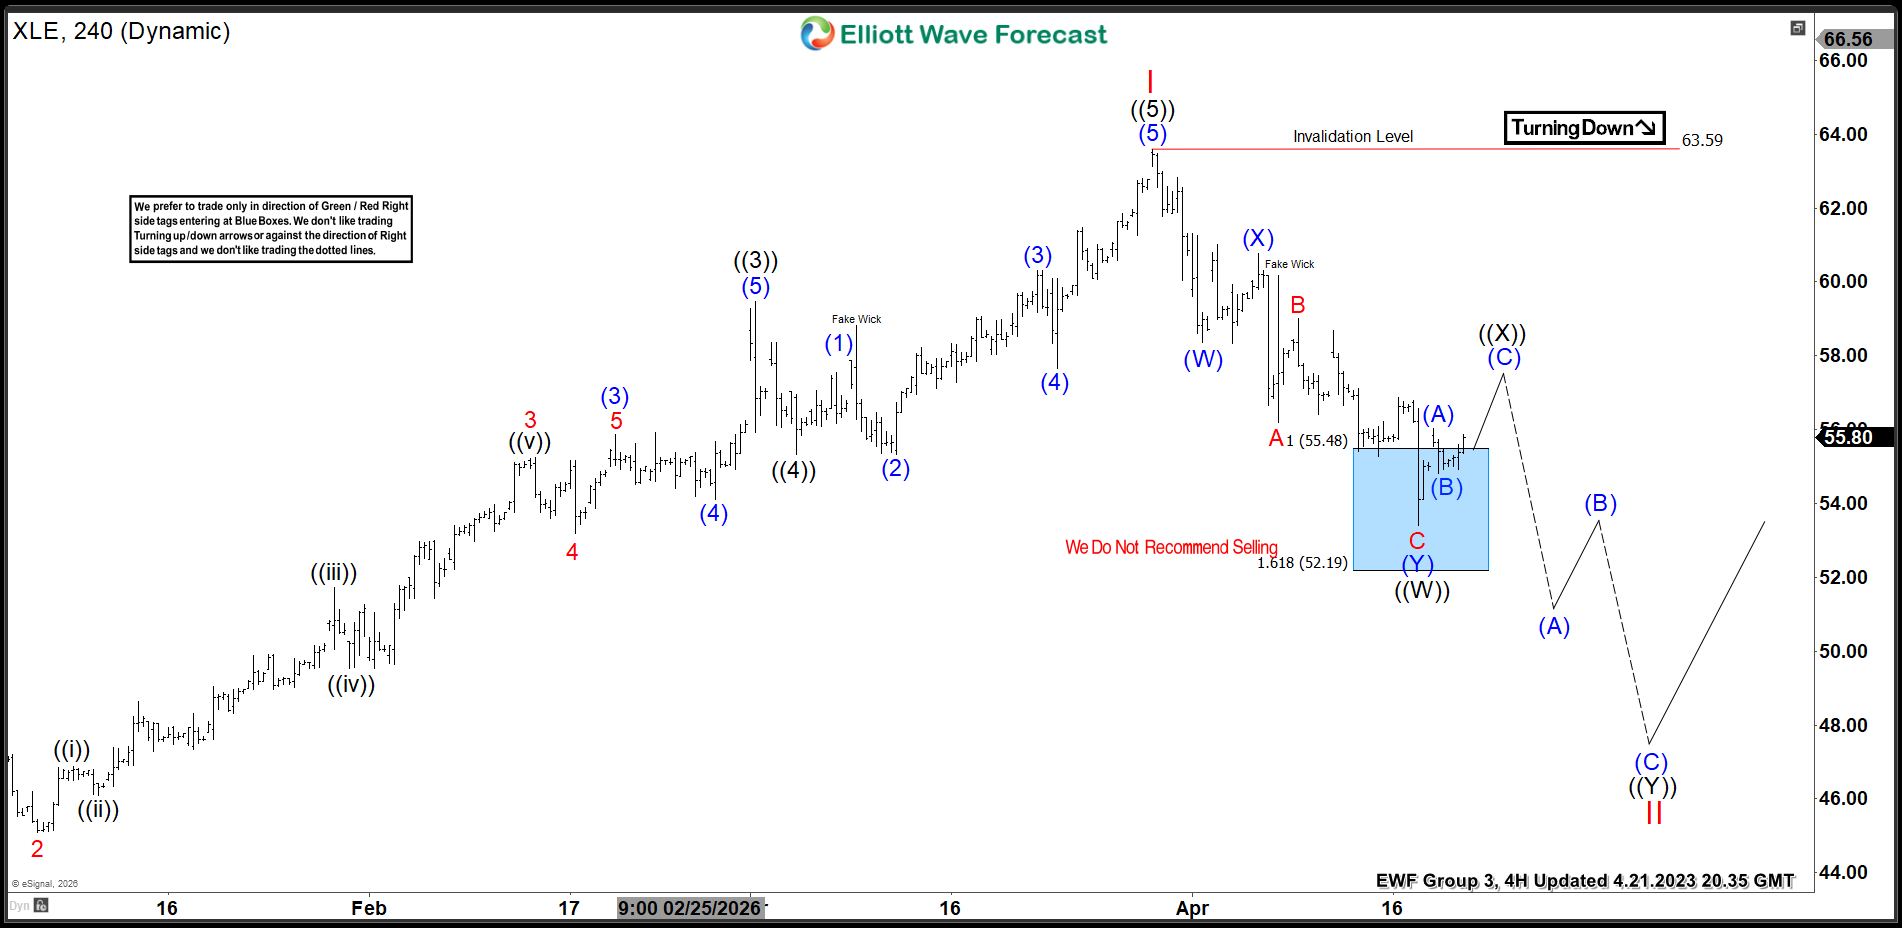
In this Elliott Wave update, we look at the latest price action in Energy Select Sector SPDR Fund ($XLE). The ETF extended lower into the short-term blue box area at 55.48–52.19 and ended the cycle from the 3/30 peak. As expected, buyers appeared in that zone and triggered a reaction higher. Therefore, longs from the blue box can now look to get risk free.

5 Wave Impulse + 7 Swing WXY correction​

$AAPL

$XLE 4H Elliott Wave View April 21, 2026​

$XLE

XLE turned lower in a corrective sequence and reached the blue box at 55.48–52.19, where sellers were expected to lose control. Once price entered that area, buyers stepped in and delivered the expected bounce. This reaction confirms the blue box once again worked as an important support zone.

As the market has already reacted higher, traders who bought the blue box can now manage the position by getting risk free. In other words, they can reduce exposure or move stops to breakeven while allowing the trade room to develop further.

In the short term, $XLE can continue to recover from the blue box area. However, the larger structure still suggests the rebound may stay corrective unless price breaks higher with stronger momentum. The key invalidation level remains at 63.59.

To sum up, $XLE ended the cycle from the 3/30 peak, reached the 55.48–52.19 blue box, and buyers entered as expected. As a result, the reaction higher is in place, and longs can now look to get risk free while the bounce continues.

Source: https://elliottwave-forecast.com/st...eaction-higher-starts-after-blue-box-support/