Elliott Wave Analysis by EWF

Analysts expect Ford (F) stock to trade in a tight range during Q2. However, they see moderate upside if margins stabilize. Most firms keep a Hold rating because tariffs and EV losses still pressure sentiment. Even so, strong cash flow helps limit downside risk.

Moreover, analysts note that Ford Pro growth supports valuation. Some expect a slow recovery if cost controls improve. Therefore, the stock could attempt a mild rebound toward consensus targets. Still, weak pricing and industry uncertainty may cap gains.

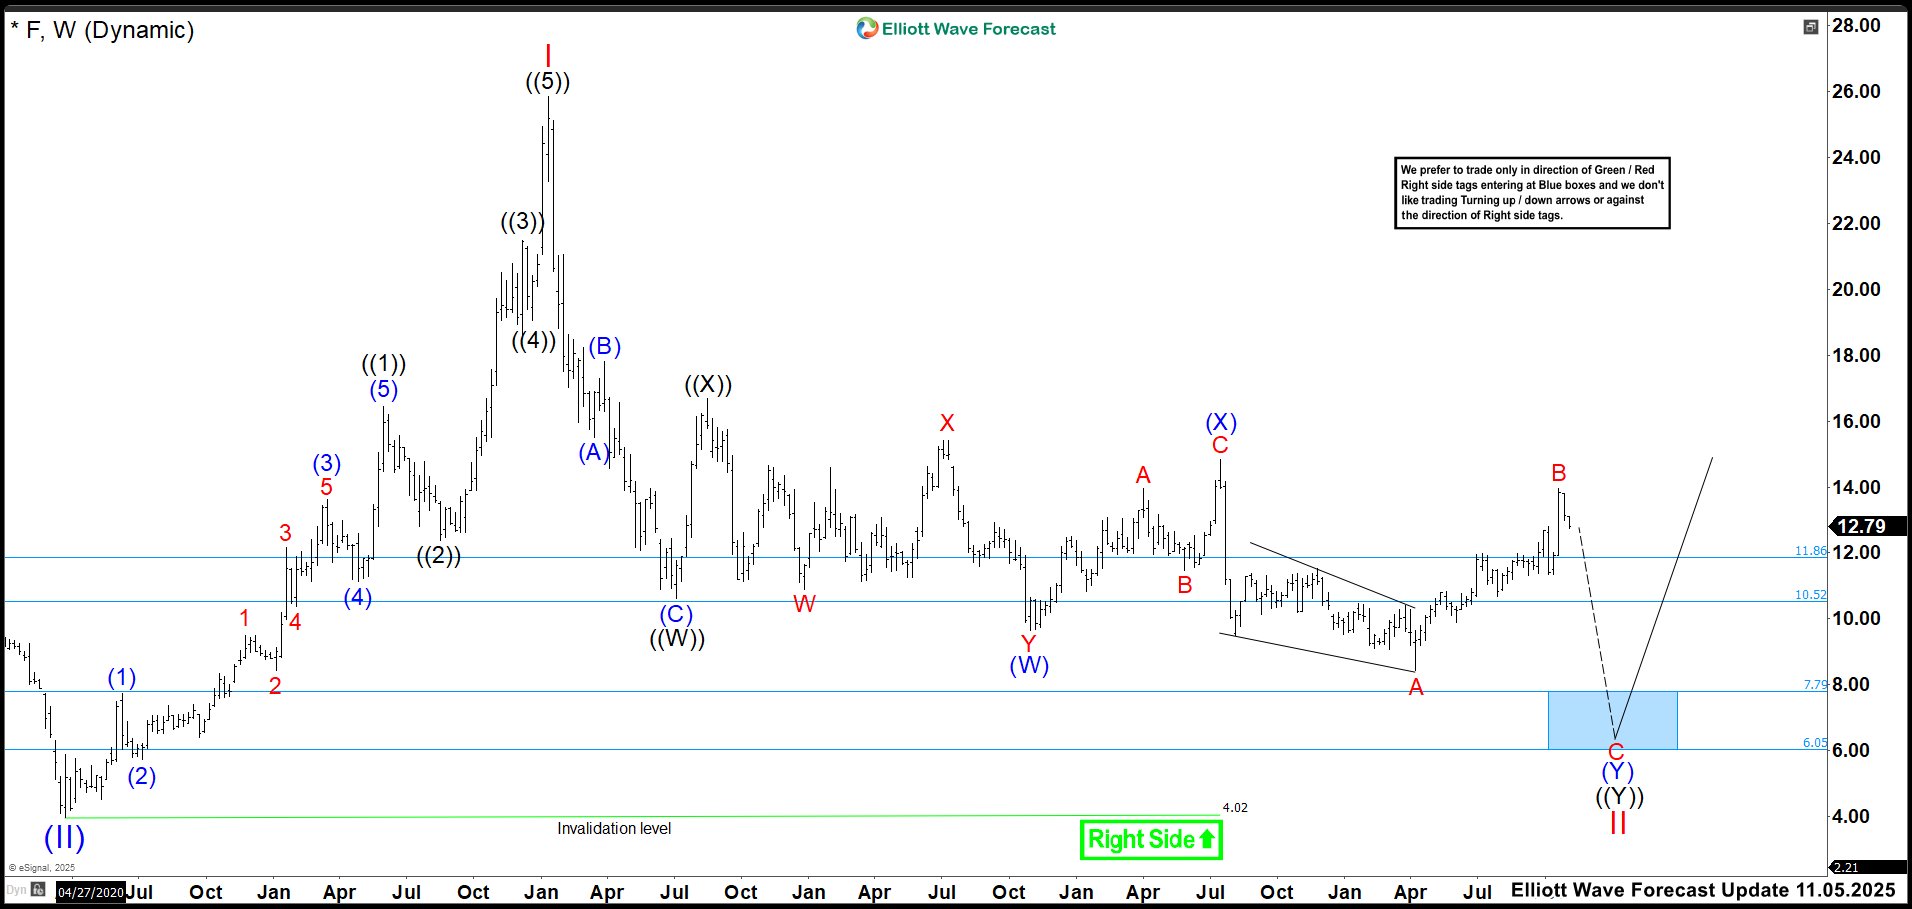
Elliott Wave Outlook: Ford (F) Weekly Chart Nov 2025

Elliott Wave Outlook: Ford (F) Weekly Chart Nov 2025

In the last update, wave B climbed sharply and formed a double correction. It still showed potential to break above 13.97. Then sellers defended the 14.88 high, which acted as a key level. For the bearish scenario to hold, price must stay below this level and move toward 7.79–6.05. Moreover, a break above 14.88 would signal that wave II ended at the 8.36 low. This shift would turn the structure bullish and open higher targets.
Elliott Wave Principle Behind the Market Structure​

Impulse

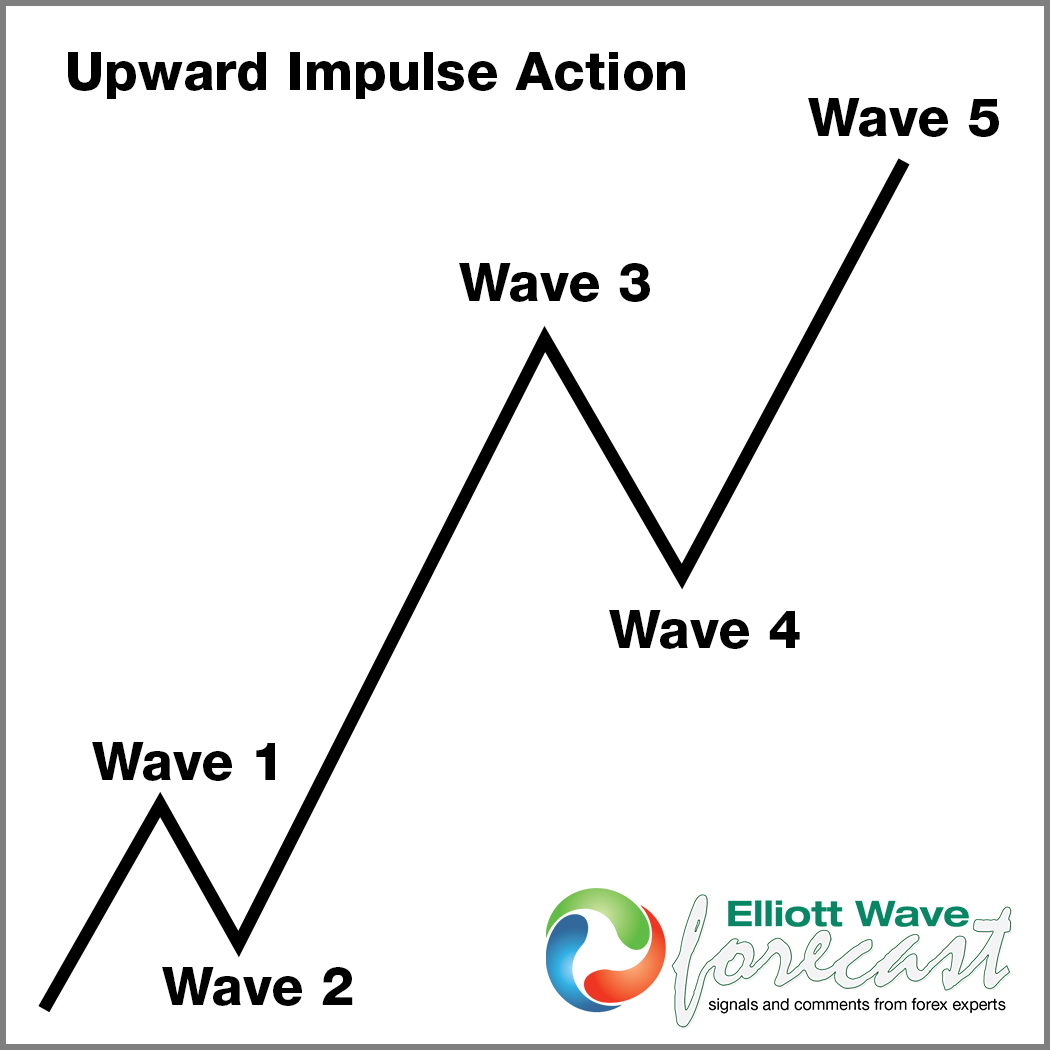
An impulse is a clean 5‑wave pattern that drives the trend forward.

  • Waves 1‑3‑5 are strong and directional.
  • No overlap between waves 1 and 4.
  • Wave 3 is usually the strongest.
  • Structure is clear, with increasing momentum.

Impulse

Elliott Wave Outlook: Ford (F) Weekly Chart March 2026

Elliott Wave Outlook: Ford (F) Weekly Chart March 2026

In this update, we see that wave B failed to break the wave (X) high and reached 14.80. Then price reacted sharply lower, which kept the bearish paths intact. Now we expect the market to form an impulse as wave C toward the blue‑box area at 8.28–4.26.

Moreover, we believe buyers will enter again once price reaches this zone. This reaction would complete the entire wave II correction and support a new rally in the stock.

Source: https://elliottwave-forecast.com/stock-market/ford-f-elliott-wave-outlook/
 
In this technical blog, we will look at the past performance of the 1-hour Elliott Wave Charts of state street energy select sector SPDR ETF ticker symbol: XLE. In which, the rally from April 2025 low is unfolding as an impulse structure. And showed a higher high sequence favored more upside extension to take place. Therefore, we advised members not to sell the ETF & buy the dips in 3, 7, or 11 swings at the blue box areas. We will explain the structure & forecast below:

XLE 1-Hour Elliott Wave Chart From 3.03.2026​

XLE Attracts Consistent Buying from Blue Box Zone


Here’s the 1-hour Elliott wave chart from the 3.03.2026 Midday update. In which, the cycle from the 16 December 2025 low ended in wave ((3)) at $59.29 high. Down from there, the XLE made a pullback in wave ((4)). The internals of that pullback unfolded as Elliott wave double three correction where wave (W) ended at $57.88 low. Then a bounce to $58.36 high ended wave (X) & wave (Y) managed to reach the blue box area at $55.33- $53.46 equal legs area. From there, buyers were expected to appear looking for the next leg higher or for a 3 wave bounce minimum.

XLE Latest 1-Hour Elliott Wave Chart From 3.17.2026​

XLE Attracts Consistent Buying from Blue Box Zone


This is the latest 1-hour Elliott wave Chart from the 3.16.2026 Post-Market update. In which the XLE is showing a very nice reaction higher taking place, right after ending the double three correction within the blue box area. Allowed members to create a risk-free position shortly after taking the long position at the blue box area. However, a break above $59.29 high is needed to confirm the next leg higher minimum towards $60.24- $61.75 target area before profit taking & pullback takes place in 3 or 7 swings.

Source: https://elliottwave-forecast.com/bluebox-wins/xle-attracts-consistent-buying-from-blue-box-zone/
 
Johnson & Johnson (JNJ) engages in research & development, manufacture & sale of range of products in the healthcare sector worldwide. It operates through Innovative Medicine & MedTech. It comes under Healthcare sector & trades as “JNJ” at NYSE.

The JNJ favors rally in bullish sequence from January-2025 low & expect at least one or few more highs to extend rally. Buyers can look to enter the pullback in 3, 7 or 11 swings correction for next leg higher.

JNJ - Elliott Wave Latest Daily View:​

JNJ-D.jpg

In weekly, it ended (I) impulse at $186.69 high in April-2022 & (II) correction at $140.68 low in January-2025. The pullback in (II) as choppy double three structure. Within (II), it ended w at $150.11 low, x at $175.97 high & y at $140.68 low. Above April-2025 low, it ended ((1)) of I at $169.99 high, ((2)) at $141.50 low, ((3)) at $251.71 high & favors pullback in ((4)) in 3 or 7 swings (or triangle) correction. It is showing extended ((3)) sequence. In ((3)), it ended (1) at $159.44 high, (2) at $146.12 low, (3) at $215.19 high, (4) at $200.91 low & (5) at $251.71 high.

Currently, it favors pullback in ((4)) below 3.02.2026 high. It ended (A) of ((4)) at $235.43 low. Above there, it favors bounce in (B), which can retest March-2025 high before it may turn lower to correct (C) against 4.05.2026 low. Buyers can look for buy at extreme area in (C) of ((4)) & later in II correction. If it breaks above 3.02.2026 high, then it can be the part of (5) of ((3)). The ((4)) can possibly correct towards $225.85 or lower before another push higher resumes. Do not like selling it in any pullback as impulse from January-2025 low looks incomplete.

Source: https://elliottwave-forecast.com/stock-market/jnj-stock-extended-rally-signals-buyers/
 
We previously mapped BlackRock's (NYSE: BLK) bullish weekly path. We also hinted at a potential dip below $1000. Today, we continue our analysis with the Elliott Wave structure of the current correction. This update highlights the next high-probability buying opportunity emerging for the stock.

Elliott Wave Analysis

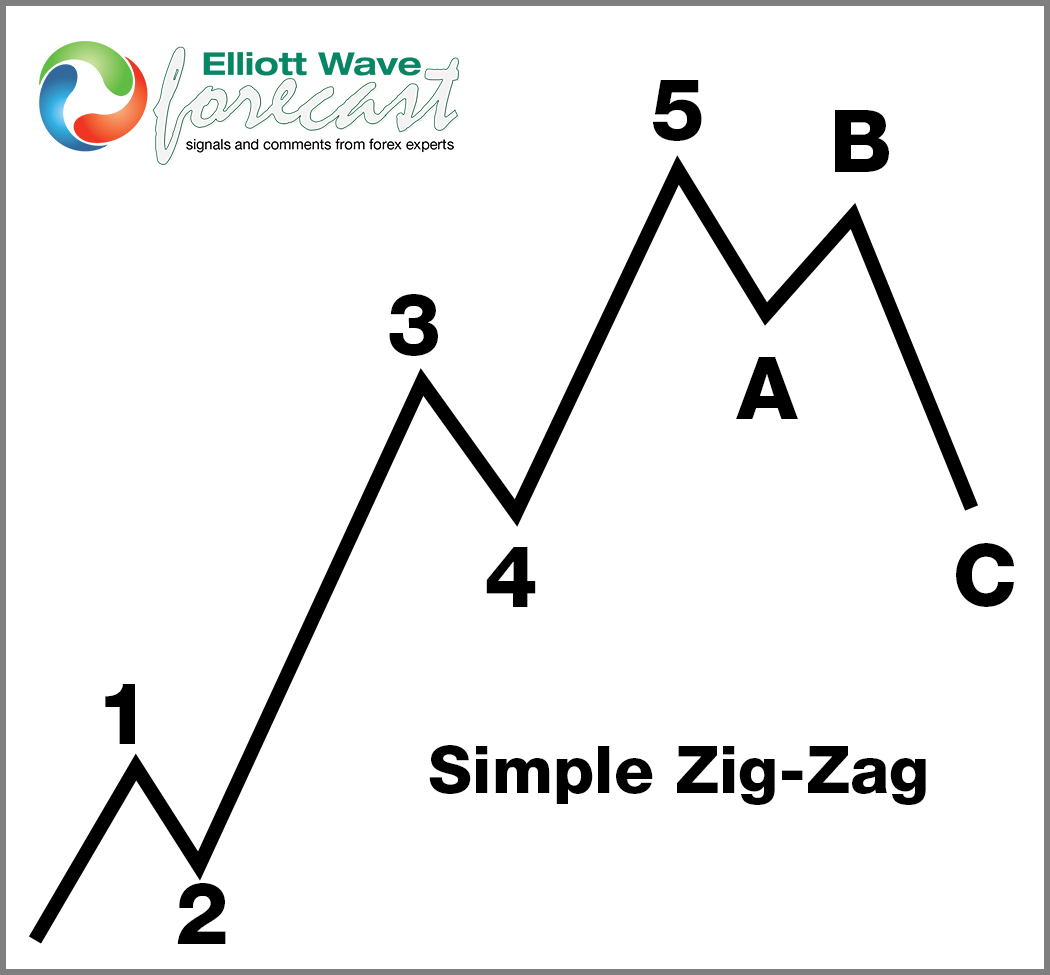
BlackRock completed an impulsive five-wave advance from its 2022 low. Wave I peaked at $1,219.90 in October 2025. Since then, the stock has shown three swings down. This decline is unfolding as a zigzag structure.

BLK already dipped below $1,000. It now enters our Blue Box buying zone at $951 - $808. This extreme high-frequency area should attract buyers. Therefore, the market will likely attempt a bullish reversal. At minimum, a three-wave bounce should occur.

The stock maintains a weekly bullish sequence after breaking to new highs. Consequently, investors should view this correction as a buying opportunity. Entries will form as 3, 7, or 11-swing patterns.

BlackRock (BLK) Weekly Chart 3.17.2026

BlackRock BLK Weekly 3.17.2025

Conclusion​

BlackRock’s larger-degree bullish cycle remains firmly intact. Therefore, investors should continue targeting buying opportunities within weekly and daily pullbacks. Utilize our Elliott Wave strategy for precise entry timing. Specifically, establish positions after a 3, 7, or 11-swing correction completes. Additionally, our proprietary Blue Box system highlights high-probability zones with pinpoint accuracy. As a result, this disciplined method gives traders the clarity and confidence to catch the next bullish leg.

Source: https://elliottwave-forecast.com/stock-market/blackrock-blk-enters-key-buying-zone-below-1000/
 
The Global X Uranium ETF (URA) offers investors diversified exposure to companies engaged in uranium mining and nuclear component production, making it a key vehicle for those looking to participate in the nuclear energy transition. In this article, we will explore the long term technical outlook using Elliott Wave.

URA Elliott Wave Chart Monthly Chart​

URA20260317171227.jpg


The monthly Elliott Wave chart of Uranium Miners ETF (URA) above shows that it has ended wave ((II)) grand super cycle degree at $6.95. It has started a new bullish leg in wave ((3)) with internal subdivision as a 5 waves impulse. Up from wave ((II)), wave I ended at $31.6 and wave II ended at $17.65. The ETF then nested higher with wave ((1)) ended at $33.66 and wave ((2)) ended at $19.5. While pivot at $6.95 low stays intact, expect pullback to find buyers in 3 or 7 swing for further upside.

URA Daily Elliott Wave Chart​


URA-Daily20260317173627.jpg


The daily chart of the Uranium ETF shows that the rally from the wave ((2)) low on April 7, 2025, concluded with wave (1) at $62.28, forming a five‑wave diagonal. The current pullback in wave (2) is unfolding as a seven‑swing corrective structure, commonly referred to as a double three. From the wave (1) peak, wave W ended at $49.11, followed by a rally in wave X to $56.66. Wave Y is now in progress, with a 100%–161.8% Fibonacci extension target at $35.11–$43.11 (blue box area). Buyers are expected to emerge from this zone, setting the stage for renewed upside momentum.

Source: https://elliottwave-forecast.com/stock-market/uranium-miners-ura-pullback-in-corrective-structure/
 
In this Elliott Wave update, the latest weekly structure in Meta Platforms Inc. ($META) is being reviewed. After a massive advance over several years, the stock appears to have completed a Grand Super Cycle degree move. As a result, a larger 7 swing correction is now being formed. Furthermore, the next important reaction area is seen in the blue box reversal zone, where a renewal of the bull can happen.

5 Wave Impulse + 7 Swing WXY correction​

$AAPL

$META​

$META

On the weekly chart, a strong impulsive rally was seen from the 2022 low. That advance carried $META sharply higher and eventually pushed the stock into what looks like the ending stages of a much larger cycle. At this point, the rally appears to have been completed at Grand Super Cycle degree, or at least a major long-term peak may have been established.

Consequently, upside momentum has been reduced, and a corrective sequence has started to develop. Rather than another immediate extension higher being seen, a broader pullback is now being favored.

Grand​

From the chart, a completed five-wave structure can be identified into the peak. After that, a decline has started, and the move lower is being treated as part of a larger corrective phase. In other words, the bullish cycle that had been in place for years may already have ended, and a new correction of higher degree may now be underway.

Moreover, this decline is not being viewed as a simple pullback. Instead, a 7 swing structure is being suggested, which is commonly labeled as W-X-Y in Elliott Wave analysis. Because of that, additional swings on both sides can still be expected before the correction is fully completed.

7​

At the moment, the correction is being developed in a complex form. A first leg lower appears to have been completed in wave W, while a connector bounce in wave X also seems to have been formed. Therefore, the market may now be in the process of extending lower again in wave Y.

This type of pattern is important because several bounces can be produced during the correction, yet the larger structure can still remain incomplete. As a result, traders should be aware that temporary recoveries may be seen before the next important low is in place.

Blue​

Most importantly, the next reversal zone is located in the blue box area between 531.22 and 399.82. This area is being watched closely because it marks a high-frequency support zone where the current decline may be completed.

Typically, when the blue box is reached, selling pressure starts to fade and a reaction higher is often produced. In this case, the renewal of the bull can happen from that area. In other words, once the 7 swing correction is completed into the blue box, buyers may step in again and the larger bullish trend may resume.

However, until that area is tested, more downside can still be seen. Therefore, the focus should remain on how price behaves as it approaches the blue box support region.

Near-​

For now, a corrective path continues to be favored. Although short-term rebounds can still be produced, the broader correction is not yet confirmed as complete. Accordingly, patience should be maintained while the stock continues to work through this larger structure.

At the same time, the long-term bullish sequence has not been invalidated. Once the blue box is reached, a meaningful reaction higher may be triggered. Then, a new bullish phase could be started as the correction comes to an end.

Technical​

To summarize, $META may have ended a Grand Super Cycle advance, and a 7 swing correction is now taking place. Meanwhile, the next reversal zone comes in the blue box area at 531.22–399.82, where a renewal of the bull can happen.

Therefore, while more downside may still be seen in the short term, the blue box remains the key area to watch. From there, the correction may be completed and the long-term bullish trend may be renewed.

Source: https://elliottwave-forecast.com/vi...er-cycle-ended-as-7-swing-correction-unfolds/
 
The recent price action in Bajaj Finance Limited indicates a classic Elliott Wave structure unfolding on the weekly chart. After completing a strong five-wave impulsive rally forming Wave (I) at ₹1102.50, the stock has now entered a corrective phase, labeled as Wave (II).

Current Trend: Short-Term Weakness, Long-Term Strength​

Following the peak at ₹1102.50, Bajaj Finance has started to move lower as part of this broader correction. In the near term, the stock is expected to decline slightly further toward the ₹827 level. This move would complete three equal swings within Wave W, a common corrective pattern in Elliott Wave analysis. However, this is not the end of the correction. After reaching the ₹827 zone, a temporary bounce is likely before the stock resumes its downward move in the next leg of Wave (II).

The broader Wave (II) correction is expected to extend deeper into the ₹681–₹551 range. This zone is technically significant because it represents a 38.2% to 50% Fibonacci retracement of the entire Wave (I) rally. Such retracement levels are commonly seen in strong trending stocks before the next major upward move begins.

BAJFINANCE_2026-03-18_08-16-10-scaled.png

What This Means for Investors​

Despite the ongoing correction, the overall structure of Bajaj Finance Limited remains bullish. Wave (II) is typically followed by Wave (III), which is often the strongest and most explosive phase in an Elliott Wave cycle.

The key takeaway here is patience. Short-term downside should not be mistaken for a trend reversal. Instead, it may present a strategic accumulation opportunity for long-term investors.

Conclusion​

Bajaj Finance is currently undergoing a healthy correction after a strong rally. With downside targets between ₹681 and ₹551, investors should watch for signs of reversal in this zone. Once Wave (II) completes, the next bullish phase could drive the stock to new highs, reinforcing its long-term growth potential.

Source: https://elliottwave-forecast.com/st...on-analysis-elliott-wave-india-stock-outlook/
 
Royal Gold Inc. (NASDAQ: RGLD) is a leading precious metals company that specializes in royalty and streaming financing within the mining sector. Founded in 1981 and headquartered in Denver, Colorado, the company does not operate mines directly. Instead, it provides upfront capital to mining companies in exchange for the right to receive a percentage of the revenue (royalties). Alternatively, it can purchase metal at a fixed, discounted price (streams). This business model allows Royal Gold to benefit from rising gold prices. At the same time, it can minimize the operational risks typically associated with mining activities, such as cost overruns and production disruptions.

The long-term price chart of Royal Gold Inc. (RGLD) illustrates a strong bullish trend characterized by a series of impulsive and corrective waves, consistent with Elliott Wave theory. From the early 2000s to 2026, the stock demonstrates a clear upward trajectory, with major impulsive phases (labeled I, III, and the current developing sequence) reflecting periods of strong appreciation. Corrective phases (such as wave II and intermediate ABC structures) indicate temporary pullbacks driven by broader market conditions or gold price fluctuations. Notably, the most recent price action shows an “incomplete bullish sequence,” suggesting that the current upward trend may continue. This reinforces the idea that RGLD behaves as a leveraged proxy for gold, where sustained increases in gold prices tend to amplify gains in the company’s stock, albeit with intermittent corrections influenced by equity market dynamics and company-specific factors. Please check the chart below.

Royal Gold (RGLD) Monthly Elliott Wave Chart​

RGLD-Monthly20260317140811-1024x508.jpg


The daily chart of Royal Gold Inc. (RGLD) offers a refined perspective on the prevailing market structure and underscores the presence of a corrective phase within a broader bullish trend. Following the completion of a strong impulsive rally to the upside, labeled as wave (3), the stock has transitioned into a corrective sequence identified as wave (4). This correction unfolds through an A–B–C structure, with prices currently moving lower toward a defined support region highlighted by the blue box.

The blue box represents a high-probability demand zone, derived from Fibonacci retracement and extension levels, approximately between 251 and 218 USD. Within Elliott Wave analysis, wave (4) corrections frequently retrace a portion of wave (3) before the dominant trend resumes. This zone is therefore regarded as a potential reversal area, where renewed buying interest is expected to emerge.

The importance of this support region extends beyond RGLD itself. The company’s performance is closely correlated with gold (XAUUSD). This means stabilization and a bullish reaction from this area would suggest continued strength in underlying fundamentals, particularly gold prices. If RGLD finds support and resumes its upward trajectory from the blue box, it reinforces expectations of sustained momentum in gold.

Short-term volatility remains possible within the blue box. A temporary bounce followed by a final dip toward point C would be consistent with corrective wave behavior. Once this sequence concludes, the next impulsive advance, wave (5), is anticipated to drive prices higher, potentially surpassing prior peaks. Such a move in RGLD would likely coincide with a broader upward trend in gold.

In conclusion, the blue box functions as a critical technical support zone. A bullish response from this area would confirm the continuation of RGLD’s upward trend and simultaneously strengthen the outlook for gold, given the strong linkage between the company’s trajectory and the commodity’s value. Please review the chart below.

Royal Gold (RGLD) Daily Elliott Wave Chart​

RGLD-Daily20260317140604-1024x508.jpg


The combined quarterly chart of gold (XAUUSD) and Royal Gold Inc. (RGLD) provides strong visual evidence of a positive long-term correlation between the two assets. Over multiple decades, both series exhibit a similar directional trend, particularly during major bullish cycles. For instance, during periods of rising gold prices—such as the 2000–2011 bull market and the more recent uptrend into 2025—RGLD’s stock price also increases significantly. This reflects the company’s direct exposure to gold revenues through its royalty and streaming business model.

However, the chart also highlights that the correlation is not perfectly linear. RGLD (blue line) often shows greater volatility and sharper price swings compared to gold (red line). In several periods, the stock either outperforms or underperforms gold, indicating a leveraged response. This is typical of gold-related equities, where operational leverage, investor sentiment, and equity market conditions amplify movements relative to the underlying commodity.

Notably, in the most recent period, gold has experienced a very strong upward acceleration. The yellow metal reaches new highs, while RGLD has also risen but at a comparatively slower pace. This slight divergence suggests that, although gold remains the primary driver, stock-specific factors—such as market expectations, capital allocation, or temporary corrections (as seen in the daily chart)—can cause short-term deviations. Here is the Quarterly of Royal Gold Inc and Gold, showing the strong correclation.

Overlay of Royal Gold and XAUUSD (Spot Gold)​

RGLD-Monthly20260317134605-1024x508.jpg


Overall, the chart confirms that RGLD and gold share a strong positive correlation over the long term, with RGLD acting as a leveraged proxy for gold prices. When gold enters sustained bullish phases, RGLD tends to follow and often magnify those movements, reinforcing the fundamental link between the company’s performance and the value of gold. Daily chart showing Royal Gold Inc and Gold getting closer to a turn higher.

RGLD-Daily20260317150243-1024x508.jpg


In conclusion, both Royal Gold Inc. (RGLD) and gold (XAUUSD) appear to be undergoing a wave (4) corrective phase within a broader bullish cycle. The identification of a high-frequency “Blue Box” support zone in RGLD highlights a statistically significant area. This is the area where corrective structures—typically unfolding in 3, 7, or 11 swings—tend to terminate. According to Elliott Wave Forecast methodology, these zones represent regions where institutional participants often re-enter the market.

Source: https://elliottwave-forecast.com/vi...ld-forecasting-gold-path-higher-into-6000-00/
 
Natural Gas (NG_F) is poised to continue higher after ending a bearish cycle in February 2026, Now in a nest, the commodity is expected to break higher while the February 2026 low is not breached.

Over the long term, Natural Gas (NG_F) has exhibited a choppy, sideways price pattern. Since 1995, it has failed to sustain a trend of either higher highs or lower lows. The commodity completed a major supercycle rally in December 2005, reaching a record high. Following that peak, a bearish corrective cycle commenced, lasting until March 2024, during which it fell to its pre-1995 lows. From the March 2024 low, a fresh bullish cycle began in a 5-wave structure, concluding in January 2026. A subsequent, highly volatile pullback ensued, ending in February 2026. Since then, the commodity has been in a "nest" formation, awaiting a bullish momentum to initiate a breakout higher.

Natural Gas H4 Elliott Wave Outlook - 22 March, 2026


Natural gas


We recently shared the H4 chart with Elliottwave-forecast members. The chart shows a completed impulse structure for cycle degree wave I in January 2026. According to Elliott Wave theory, a 3-wave correction/pullback follows a 5-wave trend/advance. Wave II, within a 3-wave structure, followed and ended in February 2026 at $2.779. From this February 2026 low, we anticipate a bullish impulse or 5-wave reaction to confirm that wave II has ended. The chart above shows a triple nest emerging, suggesting a significant bullish move could soon follow. However, until we see a 5-wave response, new buyers will remain hesitant. As retail traders, it's better to join a move rather than attempt to initiate it. Let the market show the way, and then we will follow.

In the coming days/weeks, we anticipate a 5-wave advance. Once confirmed, we can confidently buy dips within the blue box. Until then, the reaction from $2.779 is likely a 3-wave bounce. Downside could resume below $2.779, as much as the expected 5-wave upside. We need more data in the coming days/weeks to determine which scenario unfolds. We always advise our members to trade with the market's direction, whether red or green, and never against it. Currently, we don't want to sell, but it's not yet time to buy Natural Gas.

Source: https://elliottwave-forecast.com/commodities/natural-gas-nesting-breaking-higher/
 
EQT Corporation (NYSE: EQT) displays a strong weekly bullish sequence. This structure drove the stock to new all-time highs. Today, we explore the Elliott Wave pattern behind this move. Our analysis highlights potential paths and targets for continued momentum.

Elliott Wave Analysis

EQT Corporation completed an impulsive five-wave advance from its 2023 low. Wave I peaked at $61.02. Subsequently, Wave II corrected to $48.47. Then, the stock resumed its rally in Wave III, breaking into new highs.

EQT already holds an incomplete bullish sequence from its 2020 low. The recent break to new all-time highs opened another bullish sequence within the grand super cycle. Specifically, the stock shows three swings from all-time lows into new highs.

This development supports a strong bullish trend. Momentum is building for further acceleration. The initial $76 target marks only the first step. Ideally, the stock should extend beyond the $105 Fibonacci 1.618 extension as the impulsive structure develops further.

EQT Weekly Chart 3.23.2026

EQT Weekly 3.23.2026

Conclusion​

EQT's bullish cycle suggests further continuation toward the $100 milestone. Consequently, investors should target buying opportunities within weekly and daily pullbacks. Utilize our Elliott Wave strategy for precise entry timing. Specifically, establish positions after a 3, 7, or 11-swing correction completes. Additionally, our proprietary Blue Box system highlights high-probability zones with pinpoint accuracy. As a result, this disciplined method provides traders with clarity and confidence. Ultimately, it positions you to capture the next bullish leg.

.Source: https://elliottwave-forecast.com/stock-market/eqt-sets-sights-on-100/
 
In this Elliott Wave update, the latest structure in Alphabet Inc. ($GOOGL) is being reviewed. After a strong rally from the October 2022 low, the stock appears to have completed a larger bullish cycle. As a result, a 3 swing correction is now being formed. Furthermore, the next important reversal zone is seen at 257 - 223, where a renewal of the bull can happen.

5 Wave Impulse Structure + ABC correction​

$GOOGL

$GOOGL Daily Elliott Wave Analysis March 22nd 2026​

$GOOGL

On the daily chart, a powerful advance was seen from the October 2022 low. That rally carried $GOOGL sharply higher and allowed a larger bullish sequence to be developed over time. However, the move now appears to have reached an important peak, and the Super Cycle from October 2022 may have ended.

Consequently, upside momentum has been reduced, and a corrective structure has started to take shape. Rather than another immediate extension higher being favored, a pullback sequence is now being expected.

3 Swing Correction Is Taking Place​

At the moment, the correction is being developed in three swings. The first leg lower is being labeled as wave A, with a bounce to correct it as wave B. Once price breaks below wave A, wave C is expected to happen.

This pattern is important because temporary rebounds can be produced during the correction, yet the larger pullback can still remain incomplete. As a result, traders should be aware that near-term strength may be corrective and not necessarily the start of a fresh impulsive rally.

Next Reversal Zone Comes at 257 - 223​

Most importantly, the next reversal zone is seen in the 257 - 223 area. This region is being watched closely because it marks the next support zone where the current corrective decline may be completed.

Typically, when such a support area is reached, selling pressure begins to fade and a reaction higher is often produced. In this case, a renewal of the bull can happen from 257 - 223. In other words, once the 3 swing correction is completed into that area, buyers may step in again and the larger bullish trend may be resumed.

However, until that zone is tested, more downside can still be seen. Therefore, attention should be kept on how price behaves as it approaches the next reversal area.

Near-Term Outlook for $GOOGL​

For now, a corrective path is being favored. Although short-term rebounds can still be produced, the broader pullback has not yet been confirmed as complete. Accordingly, patience should be maintained while the stock continues to work through this 3 swing structure.

At the same time, the long-term bullish sequence has not been invalidated. Once the 257 - 223 area is reached, a meaningful reaction higher may be triggered. Then, a new bullish phase could be started as the correction comes to an end.

Technical Summary​

To summarize, $GOOGL may have ended its Super Cycle from October 2022, and a 3 swing correction is now taking place. Meanwhile, the next reversal zone is seen at 257 - 223, where a renewal of the bull can happen.

Source: https://elliottwave-forecast.com/video-blog/googl-elliott-wave-forecast-3-swing-correction-unfolds/
 
Vertex Pharmaceuticals Incorporated (VRTX), operates as Biotechnology company in the United States, Europe & internationally. It offers transformative medicines for people with serious diseases of different age groups. It comes under Healthcare – Biotech sector & trades as “VRTX” ticker at Nasdaq.

In weekly, it favors bullish sequence & expect rally, while pullback holds above August-2025 low. It favors rally in (III), which will confirm, when it breaks above November-2024 high. Currently, it favors correction in ((2)) in 3 or 7 swings against 8.11.2025 low before next rally.

In weekly, it placed ((I)) at $306.08 high in July-2020 & ((II)) at October-2021 low of $176.36. Above there, it ended (I) of ((III)) at $519.88 high in November-2024 & (II) at $362.50 low in August-2025 low. Within (I), it ended I at $292.75 high, II at $233.01 low, III at $510.63 high, IV at $447.70 low & V at $519.88 high. Within extended III, it placed ((1)) at $324.75 high, ((2)) at $282.21 low, ((3)) at $448.40 high, ((4)) at $391.01 low & ((5)) at $510.63 high.

VRTX - Elliott Wave Latest Weekly View:​

VRTX-W11.jpg

Below (I) high, it ended (II) in double three correction. It ended w at $377.85 low in December-2024, x at $519.68 high in March-2025 & y at $362.50 low in August-2025. Above there, it ended ((1)) at $507.92 high & favors pullback in ((2)) in 3 or 7 swings correction. Within ((1)), it ended (1) at $403.58 high, (2) at $374.17 low, (3) at $487.52 high, (4) as flat at $450.67 low & (5) at $507.92 high. It favors downside in (A) of ((2)) & expect minor downside, while bounce fail below $463.78 high. Later it should bounce soon in (B) as connector before another push lower. The next pullback in (C), should hold the trend channel to finish ((2)) before next rally continue. But if it breaks below August-2025 low, it can do double correction in (II) against October-2021 low. Buyers can look to enter the extreme area of (C) in ((2)) correction.

Source: https://elliottwave-forecast.com/stock-market/vrtx-weekly-outlook-pullback-before-strong-rally/
 
In this technical blog, we will look at the past performance of the 4-hour Elliott Wave Charts of Bitcoin. In which, the decline from 14 January 2026 high ended 5 waves in an impulse sequence and showed a lower low sequence in a corrective pattern. Therefore, we knew that the structure of Bitcoin is incomplete to the downside & should see more weakness. So, we advised members to sell the bounces in 3, 7, or 11 swings at the blue box areas. We will explain the structure & forecast below:

Bitcoin 4-Hour Elliott Wave Chart From 3.02.2026​

Bitcoin Faces Textbook Rejection at Blue Box Zone


Here’s 4-hour Elliott wave Chart from the 3.02.2026 update. In which, the decline to $59930 low ended 5 waves from the 1.14.2026 high within wave (A) & made a wave (B) bounce. The internals of that bounce unfolded as an Elliott wave zigzag correction where wave A ended at $72174 high. Then a decline to $62525 ended wave B pullback and started the C leg higher towards $74750- $82450 blue box area from where sellers were expected to appear looking for more downside or for a 3 wave reaction lower at least.

Bitcoin Latest 4-Hour Elliott Wave Chart From 3.24.2026​

Bitcoin Faces Textbook Rejection at Blue Box Zone


This is the Latest 4-hour view from the 3.24.2026 update. In which the BTCUSD is showing a strong reaction lower taking place from the equal legs area allowing shorts to get into a risk-free position shortly after taking the position.

Source: https://elliottwave-forecast.com/bluebox-wins/bitcoin-faces-textbook-rejection-at-blue-box-zone/
 
Robinhood Markets, Inc. (ticker symbol, NASDAQ: HOOD) is a U.S.-based financial services company best known for its commission-free trading app, designed to make investing accessible to everyday retail traders. Founded in 2013, it has grown into a major fintech player with millions of users worldwide. Stock has dropped more than 50% since its October 2025 peak. In our last article, we noted the June 2022 cycle was close to ending and a pull back was expected. June 2022 cycle ended as expected in October 2025 but the subsequent pullback has been deeper than anticipated. Now, the question is whether this decline is simply a larger correction within the ongoing bullish cycle—or the start of a new bearish trend. Let's take a look at what Elliott wave analysis says and potential area for a turn higher.

HOOD: Weekly Elliott Wave Analysis: Wave (IV) Pull Back in Progress​

Wave (I) ended at 85, followed by Wave (II) which bottomed at 6.81. The rally then extended into Wave (III), peaking at 153.86. Currently, Wave (IV) is unfolding and could potentially complete within the 62.85–41.37 zone, which corresponds to the 61.8–76.4% Fibonacci retracement of the Wave (III) advance. Adding further weight to this area, the 161.8% Fibonacci extension of the a–b sequence comes in at 56.74, while the February 2025 peak sits at 66.91. This creates a strong confluence of Fibonacci retracement and extension levels, reinforced by a prior peak. Altogether, this cluster suggests that Wave (IV) may terminate in this region, setting up the possibility of a bounce and continuation of the broader cycle.

HOOD Weekly Elliott Wave Analysis


HOOD: Weekly Elliott Wave Analysis: Wave II of ( III ) Pull Back in Progress​

Wave (I) ended at 85, followed by Wave (II) which bottomed at 6.81. The rally then extended into Wave I of ( III ) peaking at 153.86. This view suggests current pull back is wave II of ( III ) and support zone remains the same as mentioned above which is between 62.85 - 41.37. This view suggests, after finding buyers between 62.85 - 41.37, rally will resume in a powerful wave III of ( III).

Alternatively. if the decline from October 2025 peak turns into a 5 wave move, then the next bounce should fail below October 2025 peak for another leg lower to complete wave II of ( III ) pull back.

HOOD Elliott Wave Analysis Bullish Nest


Source: https://elliottwave-forecast.com/stock-market/robinhood-nasdaq-hood-big-correction-or-trend-change/
 
BNBUSD (Binance) found a peak back on March 16 and has since dropped more than $80. The corrective rally into the blue box unfolded with a clear three-wave structure, consistent with Elliott Wave corrective patterns. Rejection occurred between 100 - 161.8% Fibonacci extension levels of first leg up from February 6 low projected higher from the secondary low seen on February 24 and thus it was a high‑probability area for sellers to step in. Let's take a look at the Elliott wave charts from before and after this reaction

BNB (Binance) 4 Hour Elliott Wave Analysis 26 February, 2026​

The chart shows that a cycle ended back in February 2026, after which the cryptocurrency began a corrective bounce. The structure of this bounce appears to be unfolding as a double three pattern, suggesting that one more leg higher is still needed before the corrective cycle completes. The area between $673.3 and $732.2 has been highlighted as the blue box zone, which represents the 100–123.6% Fibonacci extension of the corrective sequence. This zone is critical because while below $732.2, bounce remains to be in 3 waves and hence making it a high‑probability area for sellers to re‑emerge. Once price reaches this cluster, we expect either a resumption of the decline or, at minimum, a three‑wave reaction lower.

BNB 4 Hour Elliott Wave Analysis 26 February 2026


BNB (Binance) 4 Hour Elliott Wave Analysis 26 March 2026​

Chart below shows cryptocurrency made a push higher into the mentioned area and found a peak at $686.99 on March 16. It then started dropping and already reached 50% Fibonacci retracement ($631.28) of the rally from February 24 low allowing sellers from $673.3 to take partial profits and move stop loss on remaining position above March 16 peak to eliminate risk on the trade. After trading below $600, it is currently trading at $612.75 and showing a short-term incomplete sequence against March 25 peak. While below March 25 and more importantly below March 16 highs, we expect the decline to continue.

BNB 4 Hour Elliott Wave Analysis 26 March 2026


The rejection from the blue box suggests that the larger bearish sequence remains intact, and the market respected the blue box extreme area. Only a break above March 16 high will open up more upside toward $713 - $784 area.

Source: https://elliottwave-forecast.com/cryptos/binance-bnbusd-selling-from-blue-box-area/
 
Occidental Petroleum (NYSE: OXY) is gaining momentum in recent weeks due to global events. Today, we inspect its current Elliott Wave structure. This analysis highlights the next high-probability path for the stock.

Elliott Wave Analysis

OXY dropped 54% from its 2022 peak in a three-wave zigzag structure. This decline marked wave (II), bottoming at $34.78 in April 2025. From there, the stock resumed its rally within a new impulsive structure. Currently, it is finishing its first five-wave advance within wave I. The 61.8% Fibonacci extension targets the $77 - $87 zone.

A break above the wave (I) high will confirm a new weekly bullish sequence. This development will validate the overall bullish trend. Consequently, OXY will then target the $103 - $119 equal legs area and eventually leads to new all-time highs. This development supports a strong bullish trend. Momentum continues building for further acceleration. Specifically, this acceleration will occur once wave III of (III) kicks in.

OXY Weekly Chart 3.30.2026

Occidental Petroleum OXY Weekly 3.30.2026

Conclusion​

Occidental Petroleum larger-degree bullish cycle remains firmly intact. Therefore, investors should continue targeting buying opportunities within weekly and daily pullbacks. Utilize our Elliott Wave strategy for precise entry timing. Specifically, establish positions after a 3, 7, or 11-swing correction completes. Additionally, our proprietary Blue Box system highlights high-probability zones with pinpoint accuracy. As a result, this disciplined method gives traders the clarity and confidence to catch the next bullish leg.

Source: https://elliottwave-forecast.com/stock-market/occidental-petroleum-oxy-triple-digits/
 
Ralph Lauren (RL) continues to show a strong bullish structure based on Elliott Wave analysis. Price advances steadily within wave III at cycle degree. The trend remains clearly to the upside and shows no major signs of weakness. A clean impulsive structure supports this move and reflects consistent buying pressure across multiple time frames.

Wave ((3)) within wave III now looks mature and well-developed. Price may still push slightly higher before this leg completes. However, the structure suggests that wave ((3)) has entered its final phase. Extended third waves often maintain strength until the very end, and RL continues to follow that behavior closely. Once wave ((3)) completes, the market should shift into a corrective phase in wave ((4)), which will likely slow the trend temporarily.

HEY3-8IbkAA6ftb-scaled.jpeg

Pullback to Offer Opportunity, Long-Term Target Remains Higher

Wave ((4)) should unfold as a corrective structure with at least three swings. It may extend into a 3, 7, or 11 swing pattern, depending on market conditions. This move should act as a pause within the broader trend rather than a reversal. Traders should treat this pullback as a buying opportunity in line with the dominant trend. The best entries often appear at extreme levels during these corrective phases. Wave III has already matched wave I in length, which is a common relationship. Even so, the overall structure still looks incomplete and suggests further upside ahead. This opens the door for a possible extension. The next key target stands near the 1.618 Fibonacci extension of wave I. This level comes around 1106 and represents a strong long-term objective.

In the short term, traders should focus on buying dips and avoid selling against the trend. Look for corrective pullbacks that form clear 3, 7, or 11 swing structures. As long as price stays above 82.23, the bullish outlook remains valid and supports further upside.

Summary

Ralph Lauren maintains a strong bullish Elliott Wave structure, with wave ((3)) nearing completion and limited upside left in the near term. A pullback in wave ((4)) should follow and offer a buying opportunity within the broader uptrend. As long as price holds above 82.23, the outlook remains positive, with a potential long-term target near 1106.

Source: https://elliottwave-forecast.com/st...e-analysis-wave-iii-points-to-further-upside/
 
Lam Research Corporation (LRCX) designs, manufactures, markets, refurbishes & services semiconductor processing equipment used in the fabrication of integrated circuits in the US, China, Korea, Taiwan, Japan, Southeast Asia & Europe. It comes in Technology Semiconductor sector & trades as “LCRX” at Nasdaq.

LRCX favors Zigzag correction into $178.47 - $139.49 area in daily against April-2025 low. Buyers should enter there for next leg higher or at least 3 swings rally.

LRCX - Elliott Wave Latest Daily View:​

LRCX-D2.jpg

In weekly, it ended (I) of ((III)) at $113 high in July-2024 & (II) at $56.36 low in April-2025 within the rally from October-2022. Above $56.36 low, it ended rally in I of (III) at $256.68 high & favors corrective pullback in II. In daily, it ended ((1)) at $167.15 high, ((2)) at $135.50 low, ((3)) at $251.87 high, ((4)) at $204.57 low & ((5)) as I at $256.68 high. Within ((1)), it ended (1) at $108.02 high, (2) at $94.11 low, (3) at $153.69 high, (4) at $131.02 low & $167.15 high. Within ((3)), it placed (1) at $169.69 high, (2) at $153.60 low, (3) at $236.10 high, (4) at $213.87 low & (5) at $251.87 high.

LRCX - Elliott Wave Daily View From 3.02.2026:​

LRCX-D1.jpg

Below I high, it favors pullback in Zigzag correction & favors final push lower in daily blue box area. It ended ((A)) of II at $194.08 low, ((B)) at $241.37 high & favors lower in ((C)). Further weakness in ((C)) will confirm below $194.08 low of 3.09.2026. Below there, it can extend into $178.47 - $139.49 to finish II correction against April-2025 low. The buyers will enter there for next leg in III (confirms above February-2025 high) or at least 3 swings bounce. Do not like selling it as overall bias is bullish & trading above ((A)) low.

Source: https://elliottwave-forecast.com/st...analysis-buyers-eye-178-5-139-5-support-zone/
 
In this technical blog, we are going to take a look at the past performance of BABA 1-Hour Elliott wave Charts that we presented to our members. In which, the decline from 3.18.2026 high took place in an impulse sequence and showed a lower sequence calling for more downside to happen. Therefore, our members knew that selling the bounce in the direction of the right side tag remained the preferred path. We will explain the Elliott wave structure & selling opportunity our members took below:

BABA 1-Hour Elliott Wave Chart From 3.25.2026​

$BABA Confirms Elliott Wave with Spot-On Blue Box Reversal


BABA 1-Hour Elliott Wave Chart from 3.25.2026 update. In which, the stock made a bounce towards the blue box area. The internals of that bounce unfolded as zigzag structure where wave ((a)) ended at $127.27 high. Wave ((b)) pullback ended at $123.92 low. And wave ((c)) managed to reach the blue box area at $129.86- $133.58. From there, sellers were expected to appear looking for further downside or a minimum 3-wave reaction lower.

BABA Latest 1-Hour Elliott Wave Chart From 3.31.2026​

$BABA Confirms Elliott Wave with Spot-On Blue Box Reversal


This is the latest 1-Hour view from the 3.30.2026 update. In which the BABA is showing a reaction lower taking place from the blue box area. Allowing shorts to get into a risk-free position shortly after taking the position. However, a break below $121.70 low is needed to confirm the next extension lower & avoid double correction lower.

Source: https://elliottwave-forecast.com/bl...-elliott-wave-with-spot-on-blue-box-reversal/
 
Analysts expect AT&T (T) to deliver stable performance in the second quarter of 2026. First, the company continues to show solid execution in wireless and fiber growth. Moreover, recent earnings have consistently beaten expectations, which strengthens investor confidence. In addition, Wall Street recently raised price targets, reflecting improving sentiment and operational momentum. As a result, analysts maintain a moderate buy outlook, with targets near the 30 level.

From a fundamental perspective, analysts focus on fiber expansion and 5G integration as key growth drivers. Furthermore, AT&T expects low-single-digit revenue growth and steady EBITDA expansion through 2026. At the same time, the company guides EPS between 2.25 and 2.35, supported by cost savings and capital returns. However, revenue growth remains modest, which limits upside in the short term. Therefore, from a technical view, analysts expect consolidation below resistance, while maintaining a bullish bias if support holds.

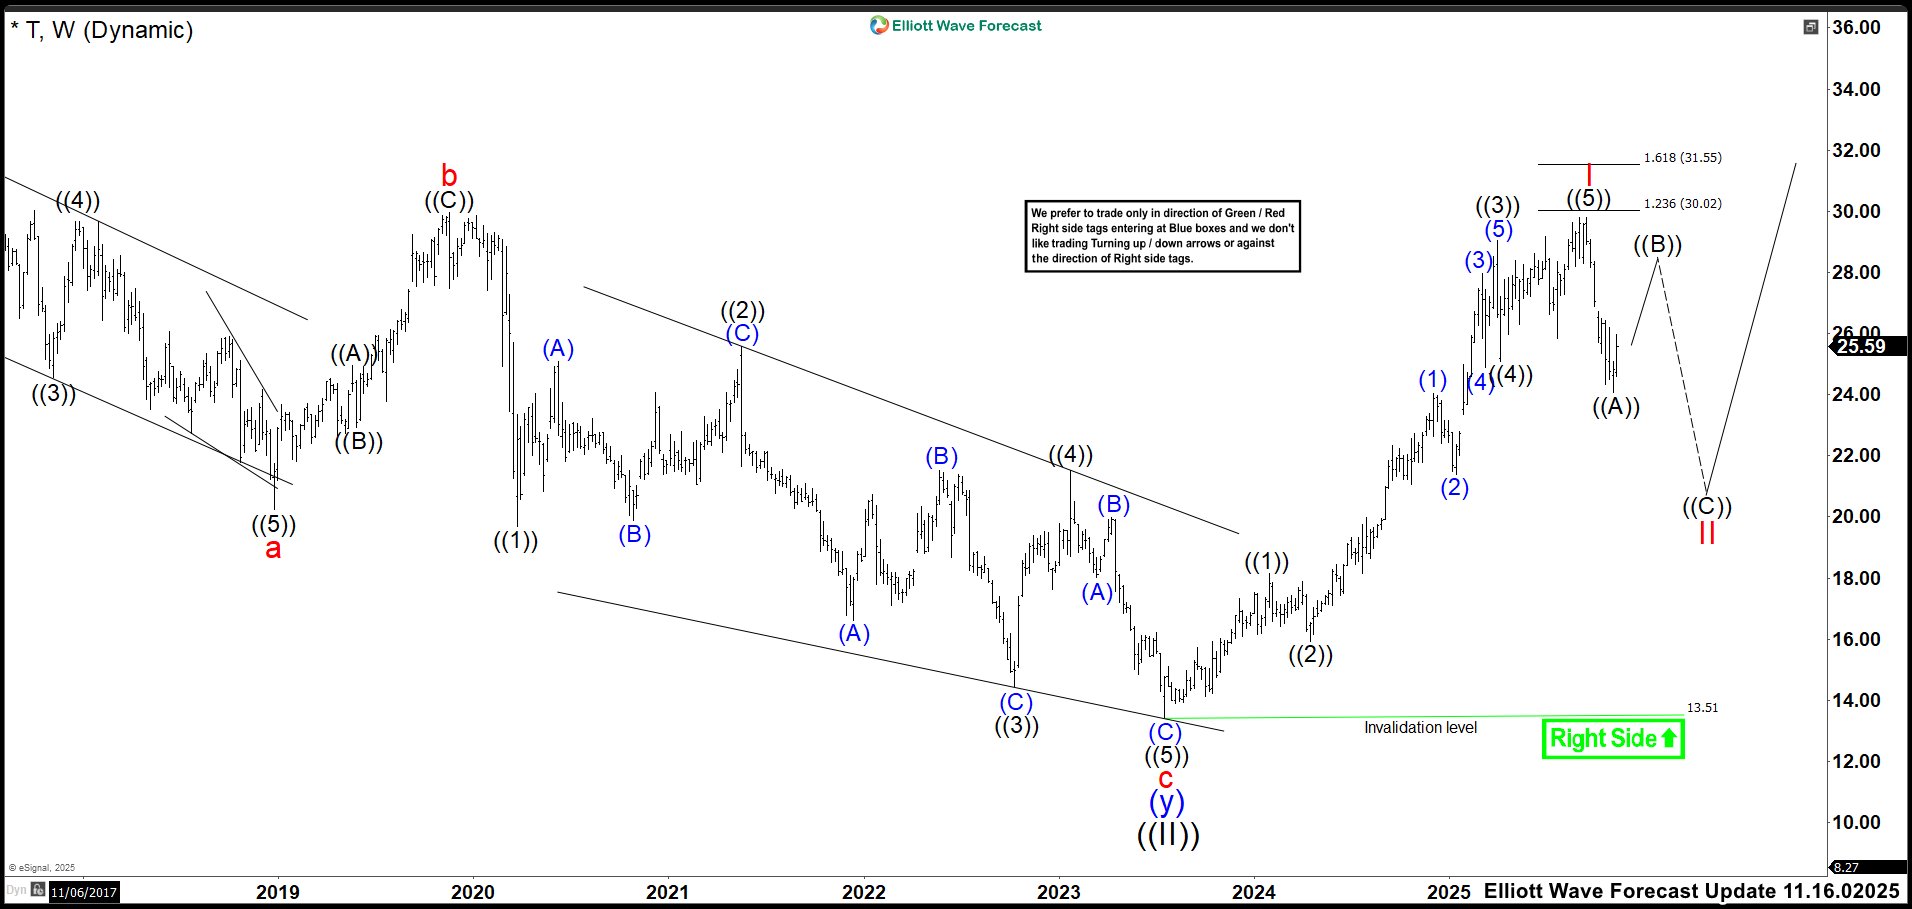
Elliott Wave Outlook: AT&T (T) Weekly Chart Noviembre 2025

Elliott Wave Outlook: AT&T (T) Weekly Chart Noviembre 2025

On September 15, 2025, T completed an impulse that began in 2023, reaching 29.79 per share. The price missed the ideal target zone by just a few cents. Wave ((5)) formed an ending diagonal, which finalized impulse wave I and triggered a reversal.

From that peak, the market declined into the expected 24 area. However, this drop represented only wave ((A)) of corrective wave II.

We expected a rebound in wave ((B)), with the recovery remaining capped below 29.79. Afterward, the market was expected to decline again in wave ((C)) of II. The ideal zone for the pullback to end was between 23.54 and 19.70. Within that range, we could look for new buying opportunities targeting a break above the wave I high of 29.79. (If you want to learn more about Elliott Wave Principle, please follow these links: Elliott Wave Education and Elliott Wave Theory.)

Elliott Wave Principle Behind the Market Structure​

Impulse

An impulse is a clean 5‑wave pattern that drives the trend forward.

  • Waves 1‑3‑5 are strong and directional.
  • No overlap between waves 1 and 4.
  • Wave 3 is usually the strongest.
  • Structure is clear, with increasing momentum.

Impulse

Elliott Wave Outlook: AT&T (T) Weekly Chart March 2026

Elliott Wave Outlook: AT&T (T) Weekly Chart March 2026


In this new update of T, we see that wave ((B)) produced a relatively short rebound to 26.20. Then, the market continued lower in wave ((C)), ending within the target zone at 22.95.

From that point, price has delivered a strong rally. However, it has not yet broken the 29.79 high. Therefore, we still cannot rule out a flat correction. This scenario means the market could revisit the 22.00 area before continuing higher.

At this stage, we label the high at 29.43 as wave ((1)). Next, we expect a pullback into the 26.96–25.43 zone. This area should act as support before the rally resumes. We also expect a reaction within this zone. However, if price breaks it easily, the market could extend lower toward the 22.00 area. After that, the rally could restart.

Source: https://elliottwave-forecast.com/st...port-holds-as-market-prepares-for-next-rally/