CrowdStrike Holdings, Inc. is an American cybersecurity technology company based in Austin, Texas. Providing cloud workload and endpoint security, threat intelligence, and cyberattack response services.
They have a market value of $51b. They generated sales of up to $1.5b within the last 12 months. We have noticed a huge demand of CrowdStrike due increase numbers of remote working which increased the demand for cloud computing.
CrowdStrike could reach $3 billion in annual revenue in 2023, a year earlier than the company’s guidance, according to a BI analysis.
Lets take a look at why we like this stock this quarter throughout to the end of the year.

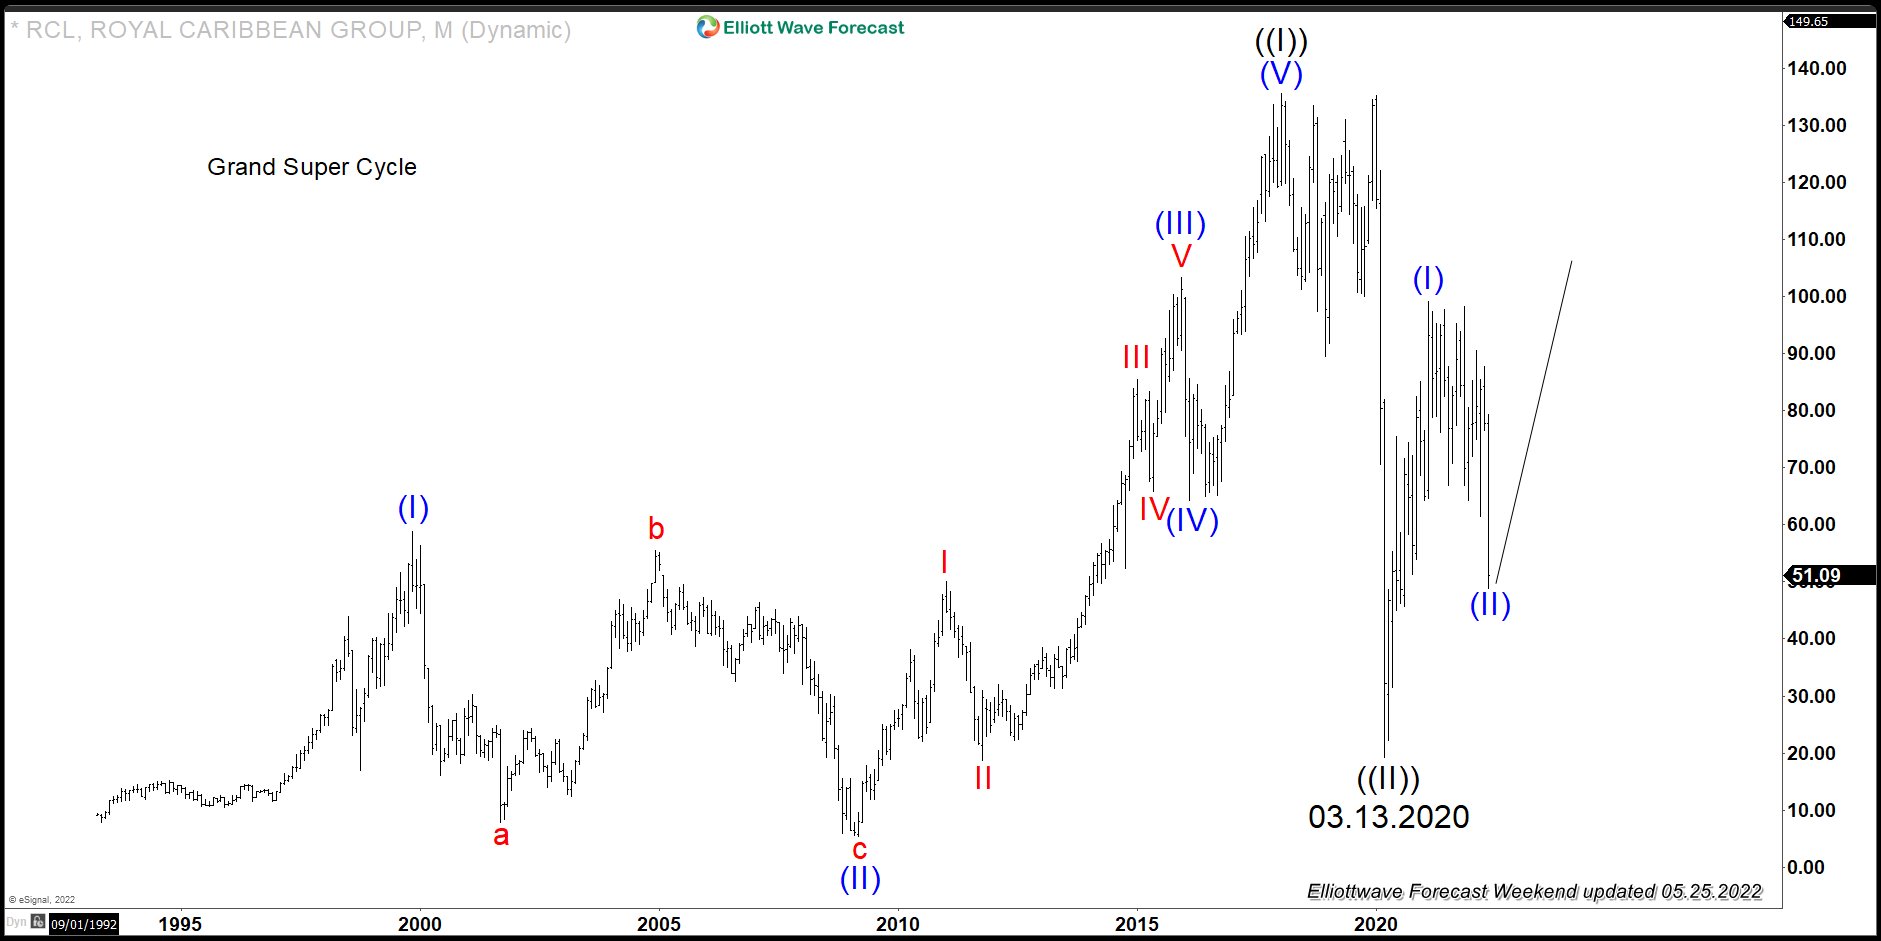
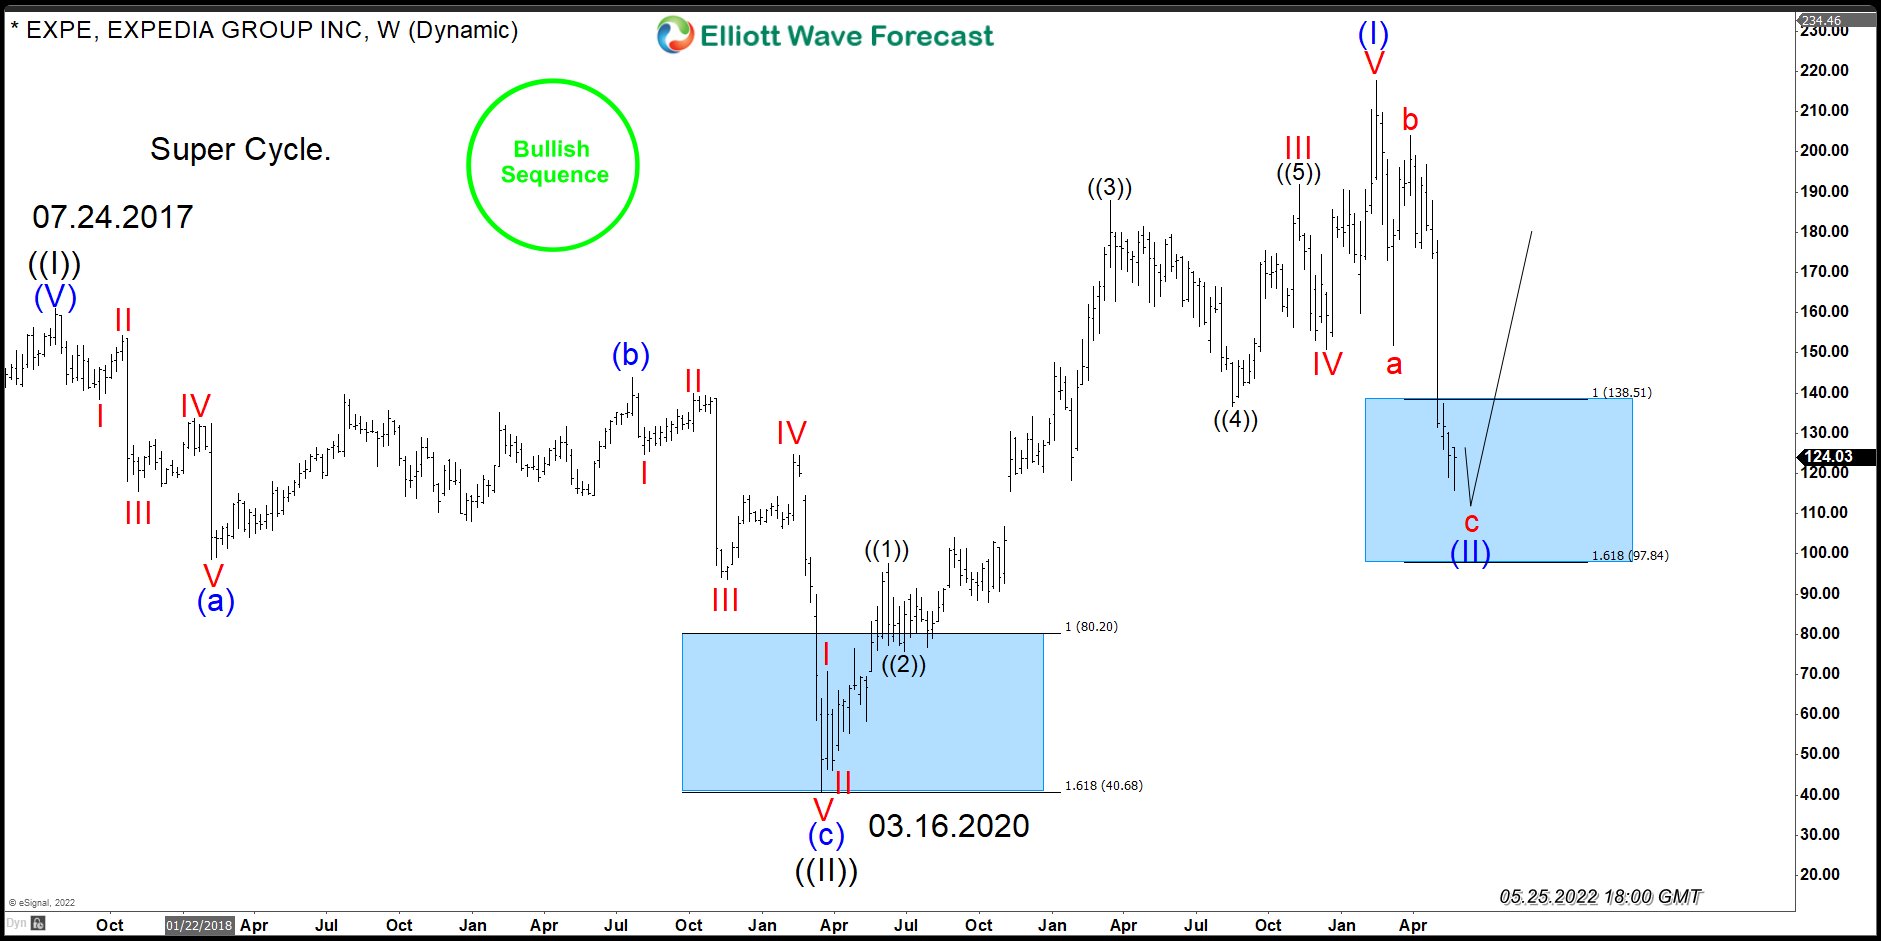
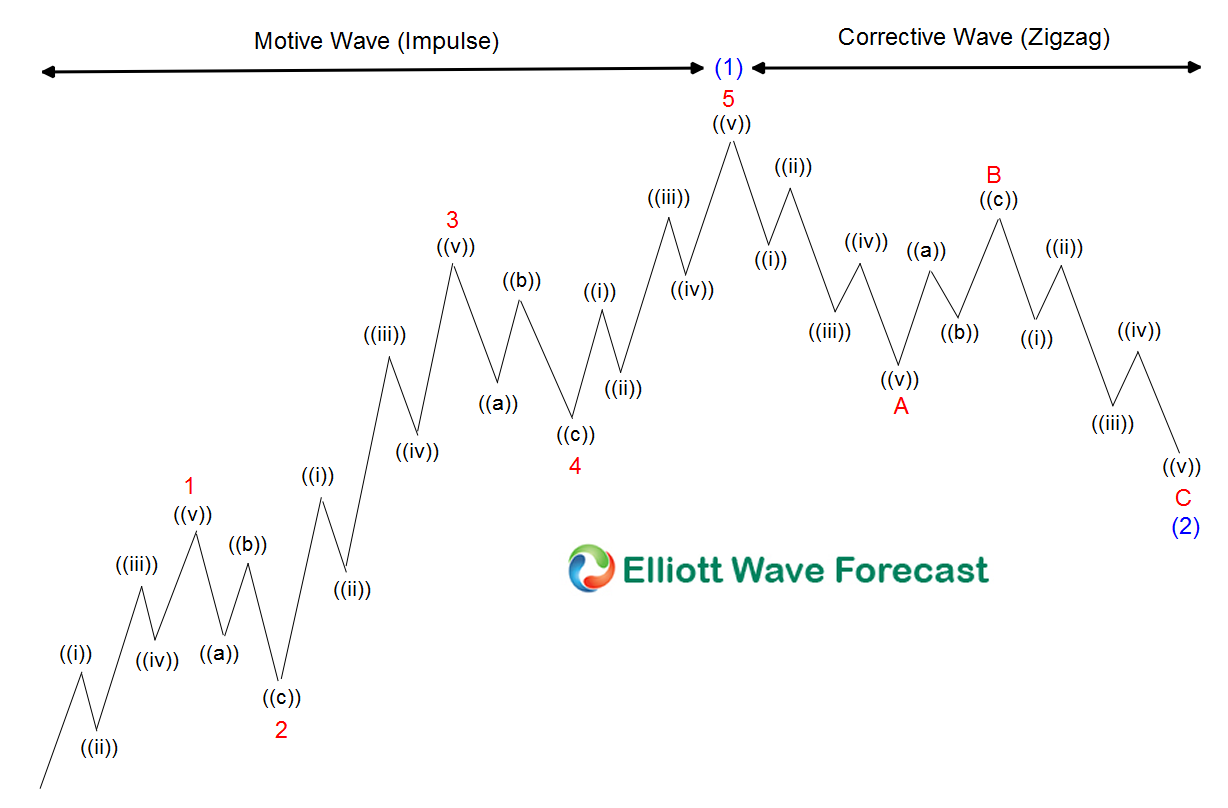
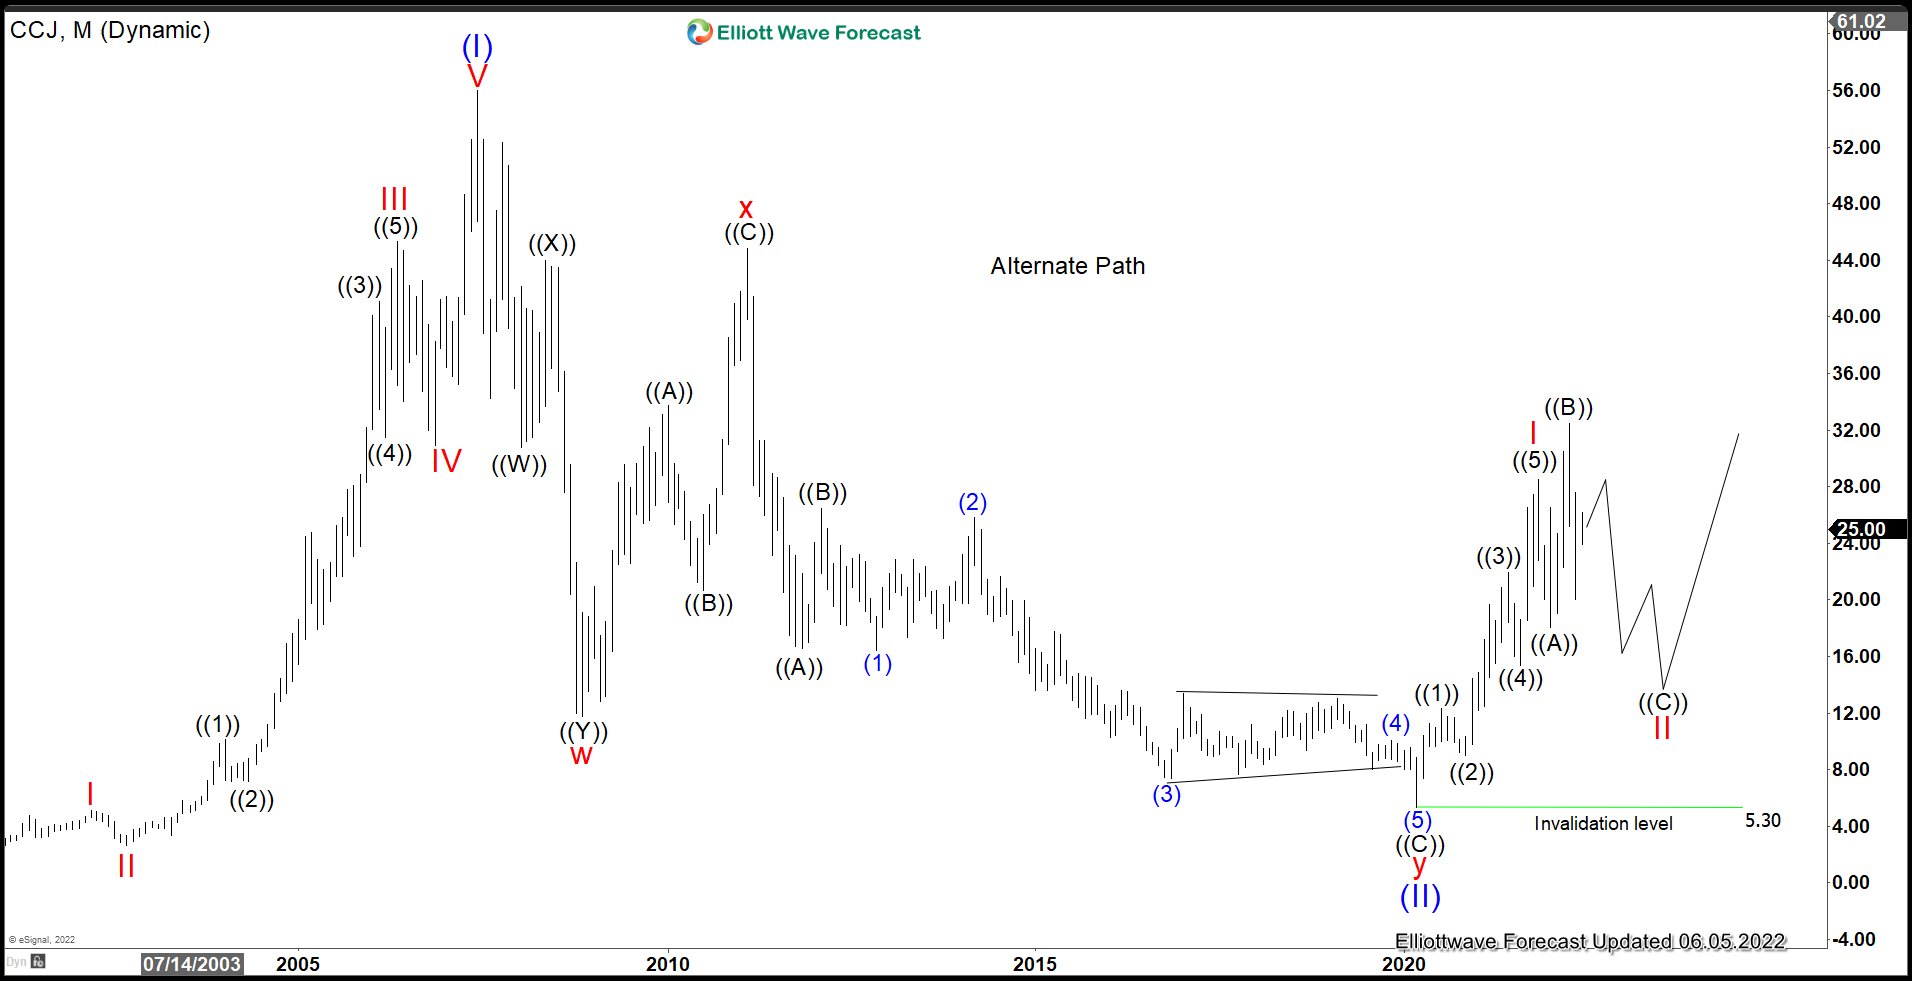
As you can see here, we completed a 5 wave sequence to complete wave I on a higher degree. Ever since November 2021 highs at $298, we have been correcting in a 7 swing structure to the downside with an invalidation level at $31.95.
Lets take a look at the correction we are unfolding at the moment.
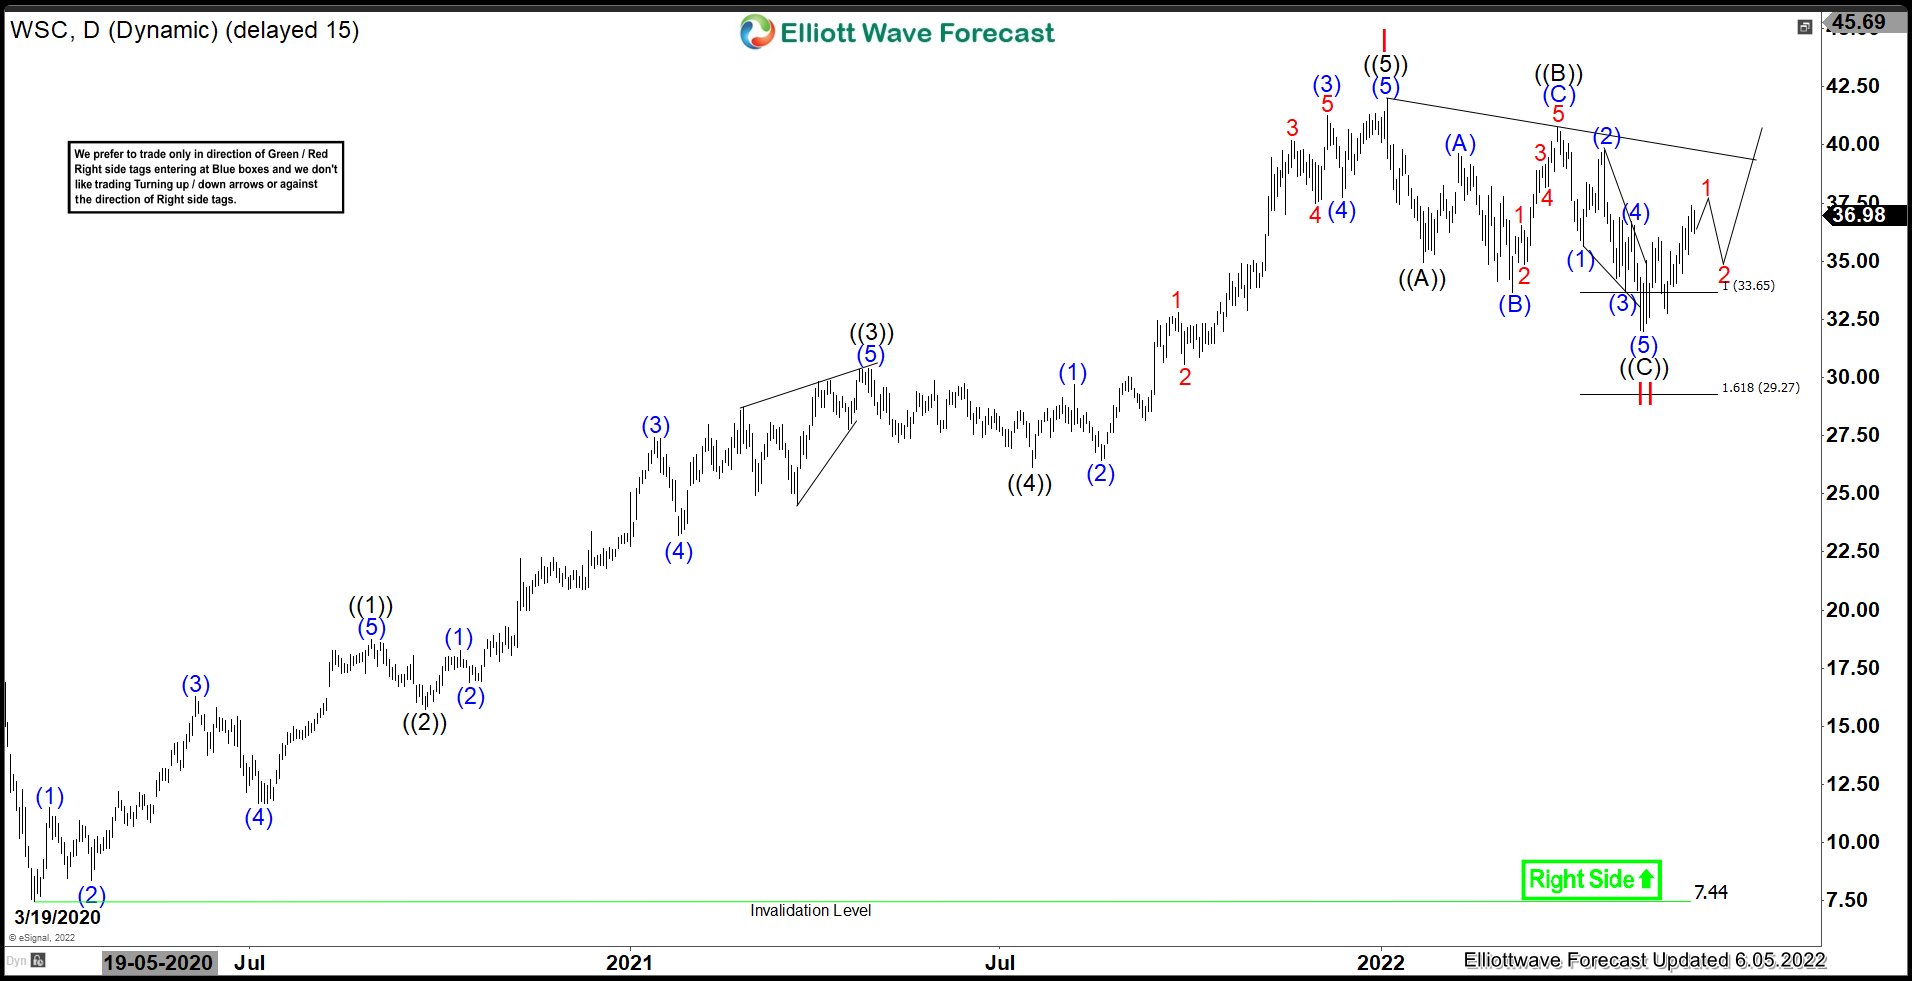
Daily Timeframe - 25th May 2022
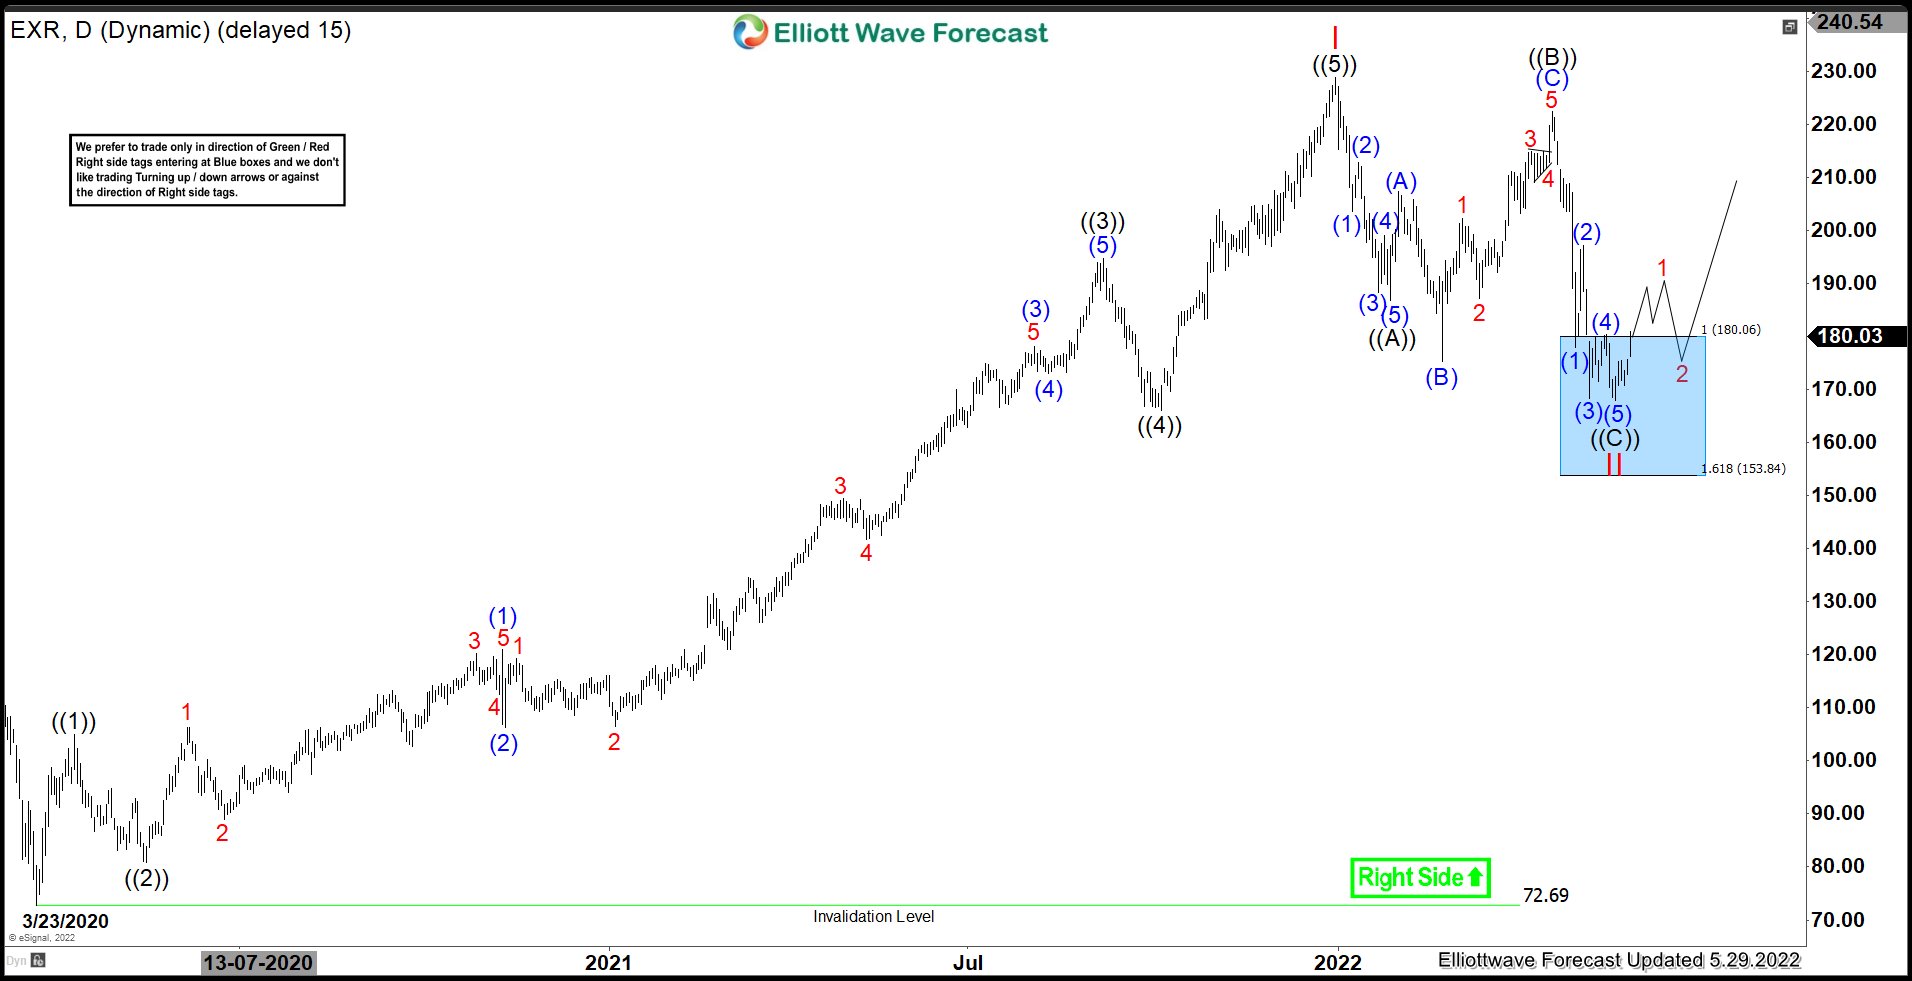
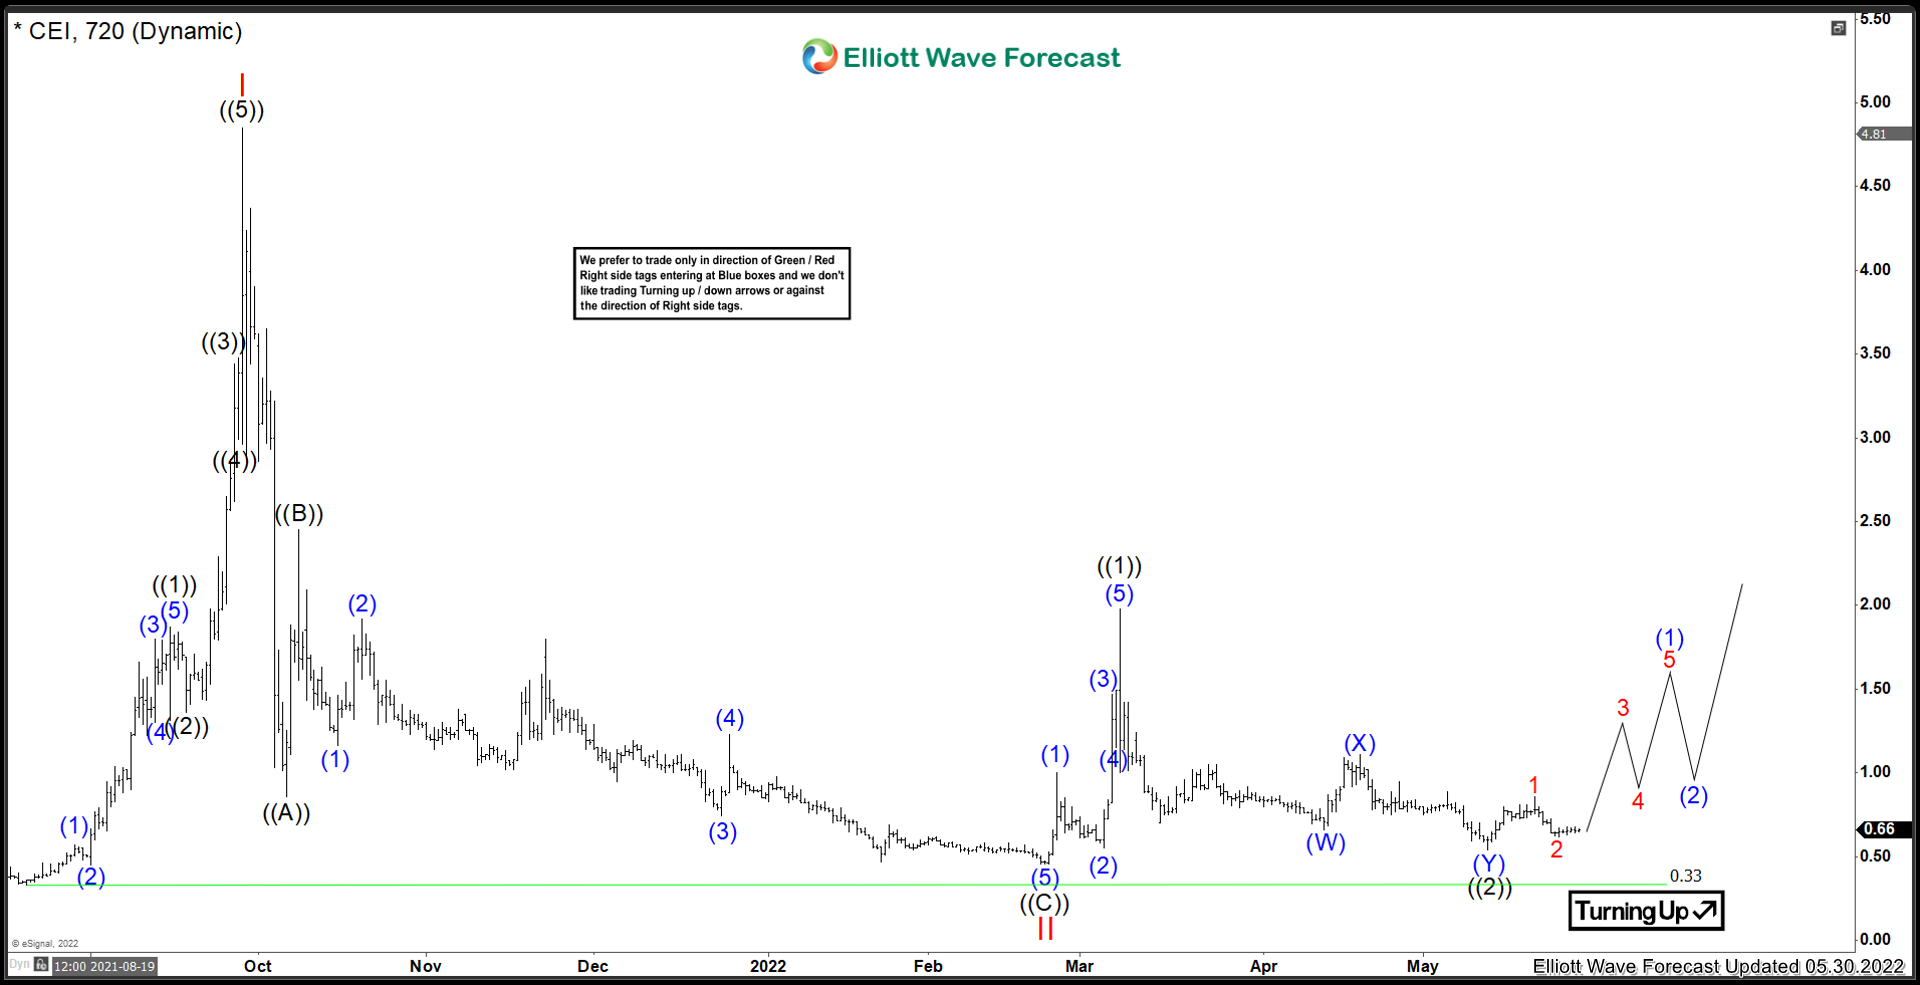
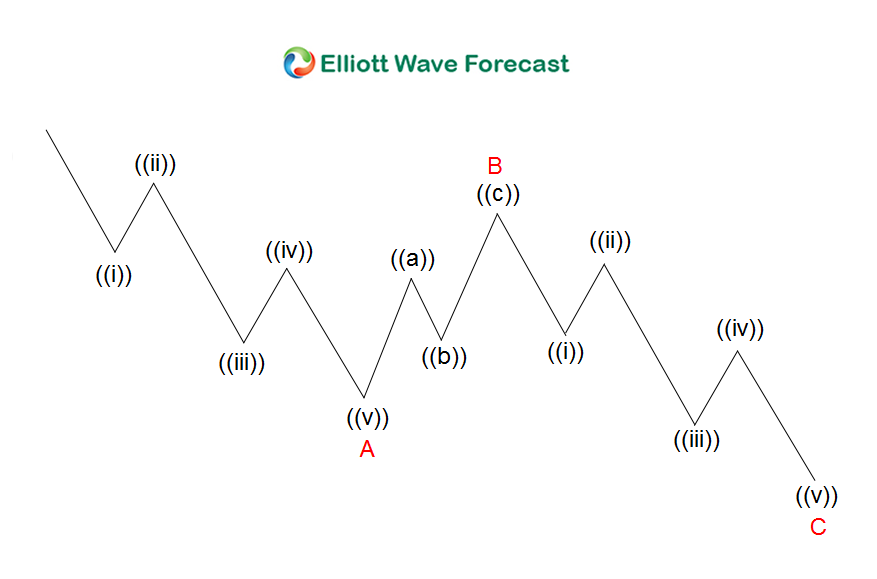
Daily timeframe, we are unfolding a double correction. This is a good sign considering that a WXY is more corrective in nature as opposed to a ZigZag - ABC. Currently within wave ((Y)) we are unfolding in wave (B) as a triangle and should be unfolding in a 5 wave sequence into wave (C).
In order to complete this corrective cycle, I would like to see a 5 wave sequence to the upside to confirm this correction is done.
I believe we will continue to see this climb in the near term future for a long time as more security would be required due to everything going into the cloud.
Source: https://elliottwave-forecast.com/elliottwave/crowdstrike-stock-watch-2022/
They have a market value of $51b. They generated sales of up to $1.5b within the last 12 months. We have noticed a huge demand of CrowdStrike due increase numbers of remote working which increased the demand for cloud computing.
CrowdStrike could reach $3 billion in annual revenue in 2023, a year earlier than the company’s guidance, according to a BI analysis.
Lets take a look at why we like this stock this quarter throughout to the end of the year.
Weekly Timeframe - 25th May 2022
As you can see here, we completed a 5 wave sequence to complete wave I on a higher degree. Ever since November 2021 highs at $298, we have been correcting in a 7 swing structure to the downside with an invalidation level at $31.95.
Lets take a look at the correction we are unfolding at the moment.
Daily Timeframe - 25th May 2022

Daily timeframe, we are unfolding a double correction. This is a good sign considering that a WXY is more corrective in nature as opposed to a ZigZag - ABC. Currently within wave ((Y)) we are unfolding in wave (B) as a triangle and should be unfolding in a 5 wave sequence into wave (C).
In order to complete this corrective cycle, I would like to see a 5 wave sequence to the upside to confirm this correction is done.
I believe we will continue to see this climb in the near term future for a long time as more security would be required due to everything going into the cloud.
Source: https://elliottwave-forecast.com/elliottwave/crowdstrike-stock-watch-2022/


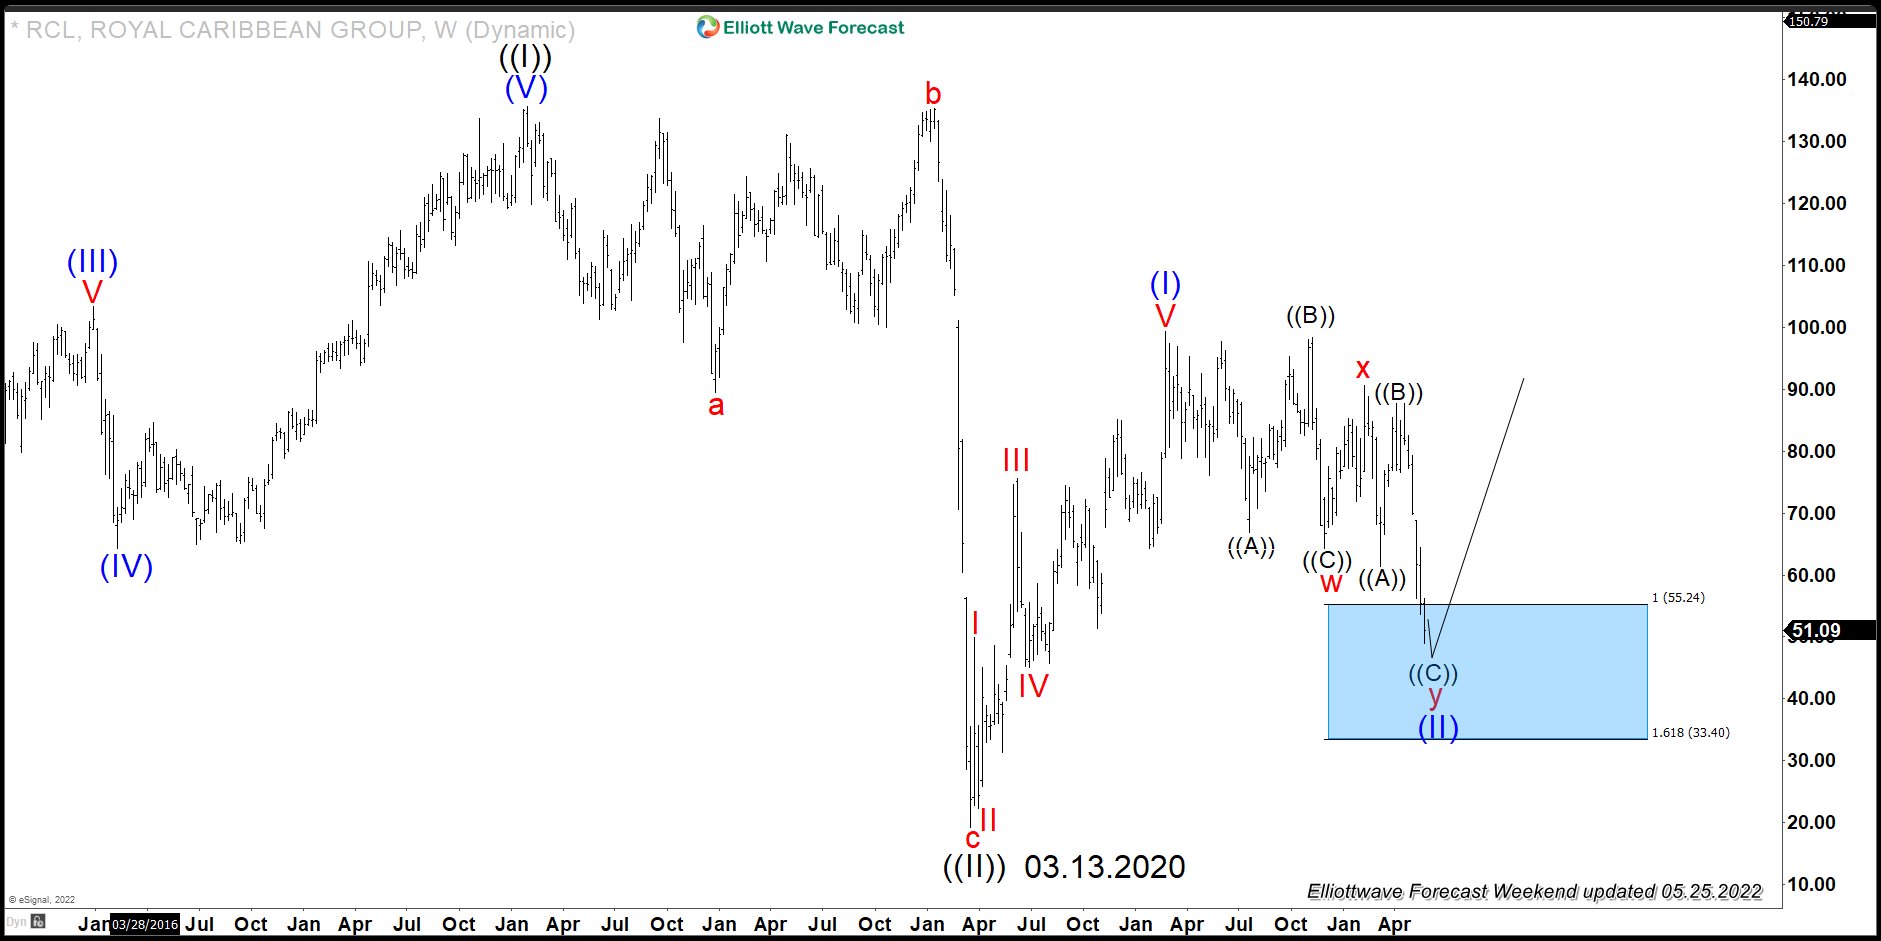


 Weekly Elliott Wave Chart")


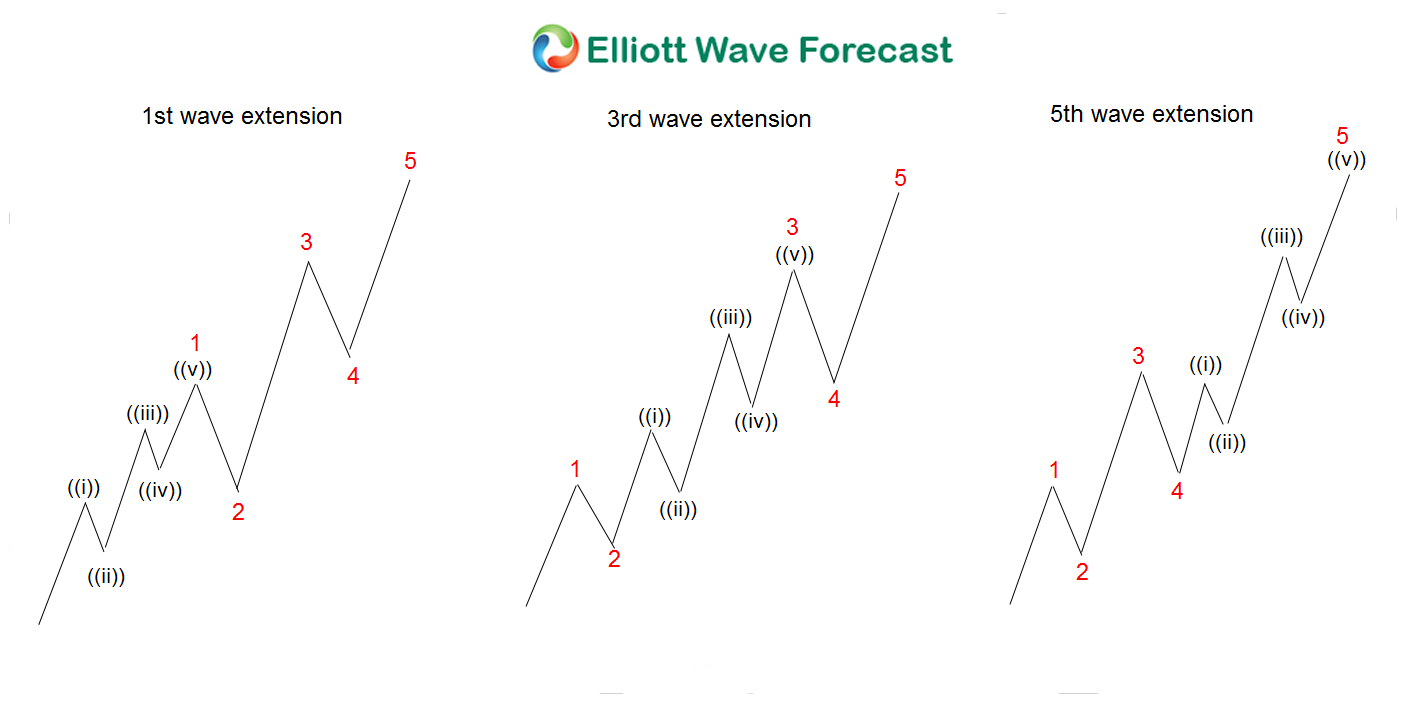
) Extension")