Elliottwave-Forecast

Master Trader
Feb 17, 2017
2,453
9
84
www.elliottwave-forecast.com
Mid-America Apartment Communities, Inc., (MAA) is a real estate investment trust (REIT), focused on delivering full-cycle & superior investment performance for shareholders through the ownership, management, acquisition, development & redevelopment of quality apartment communities in the southeast, southwest & mid-Atlantic regions of United states. It comes under Real Estate sector & trades as “MAA” ticker at NYSE.

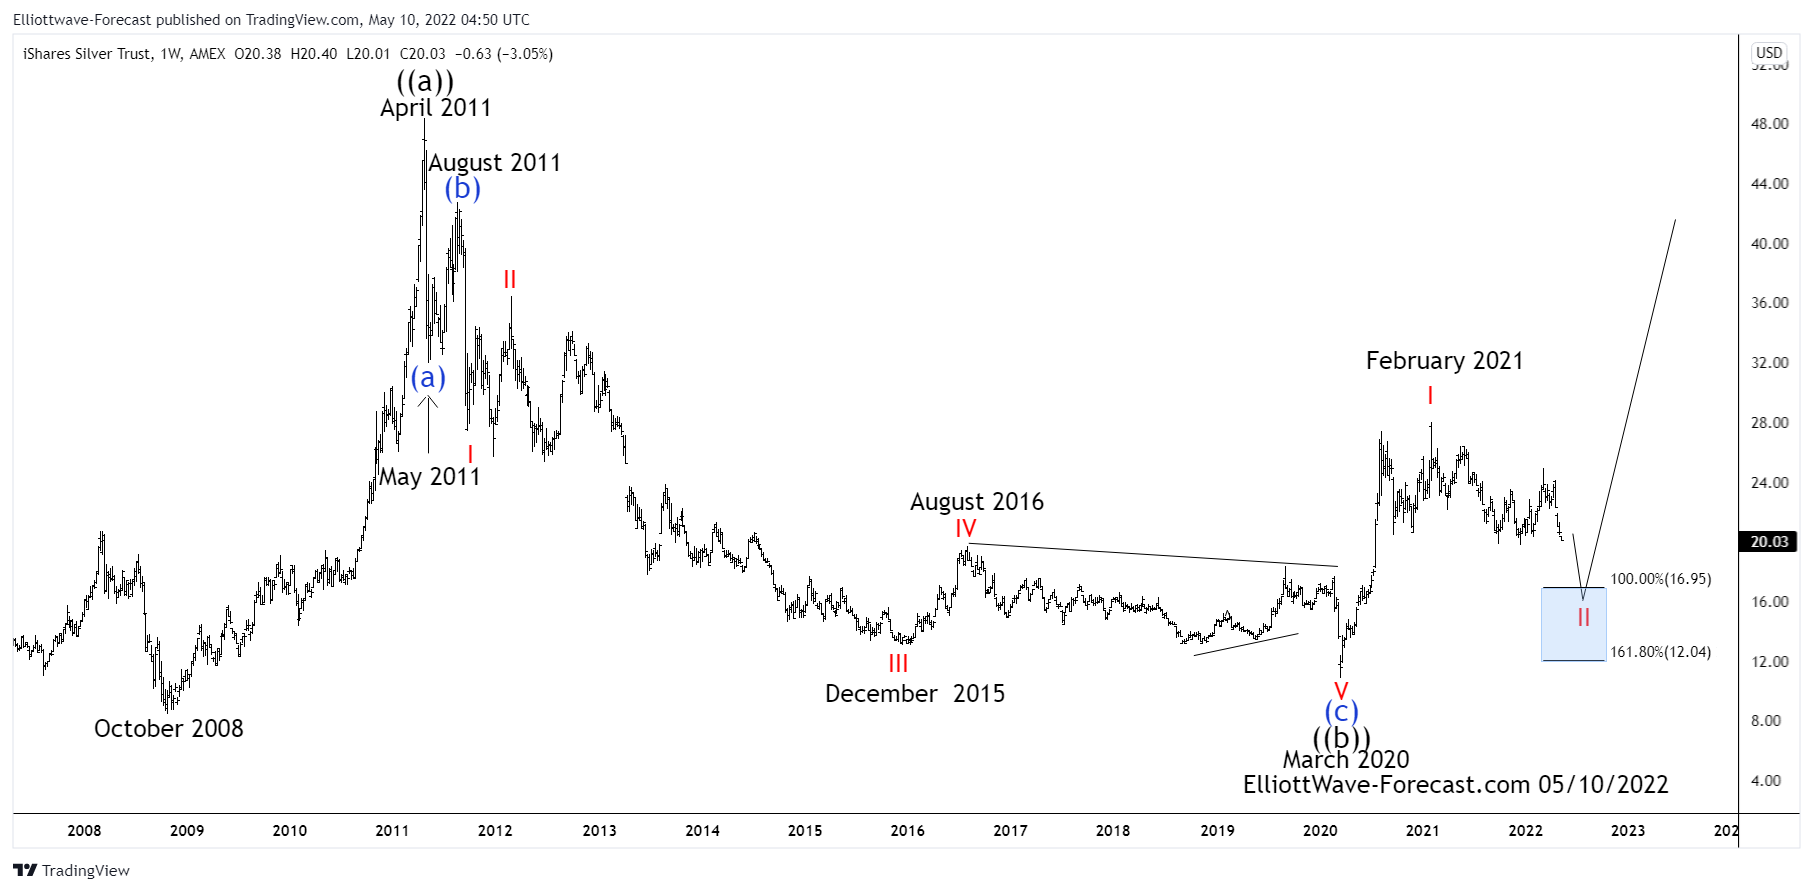
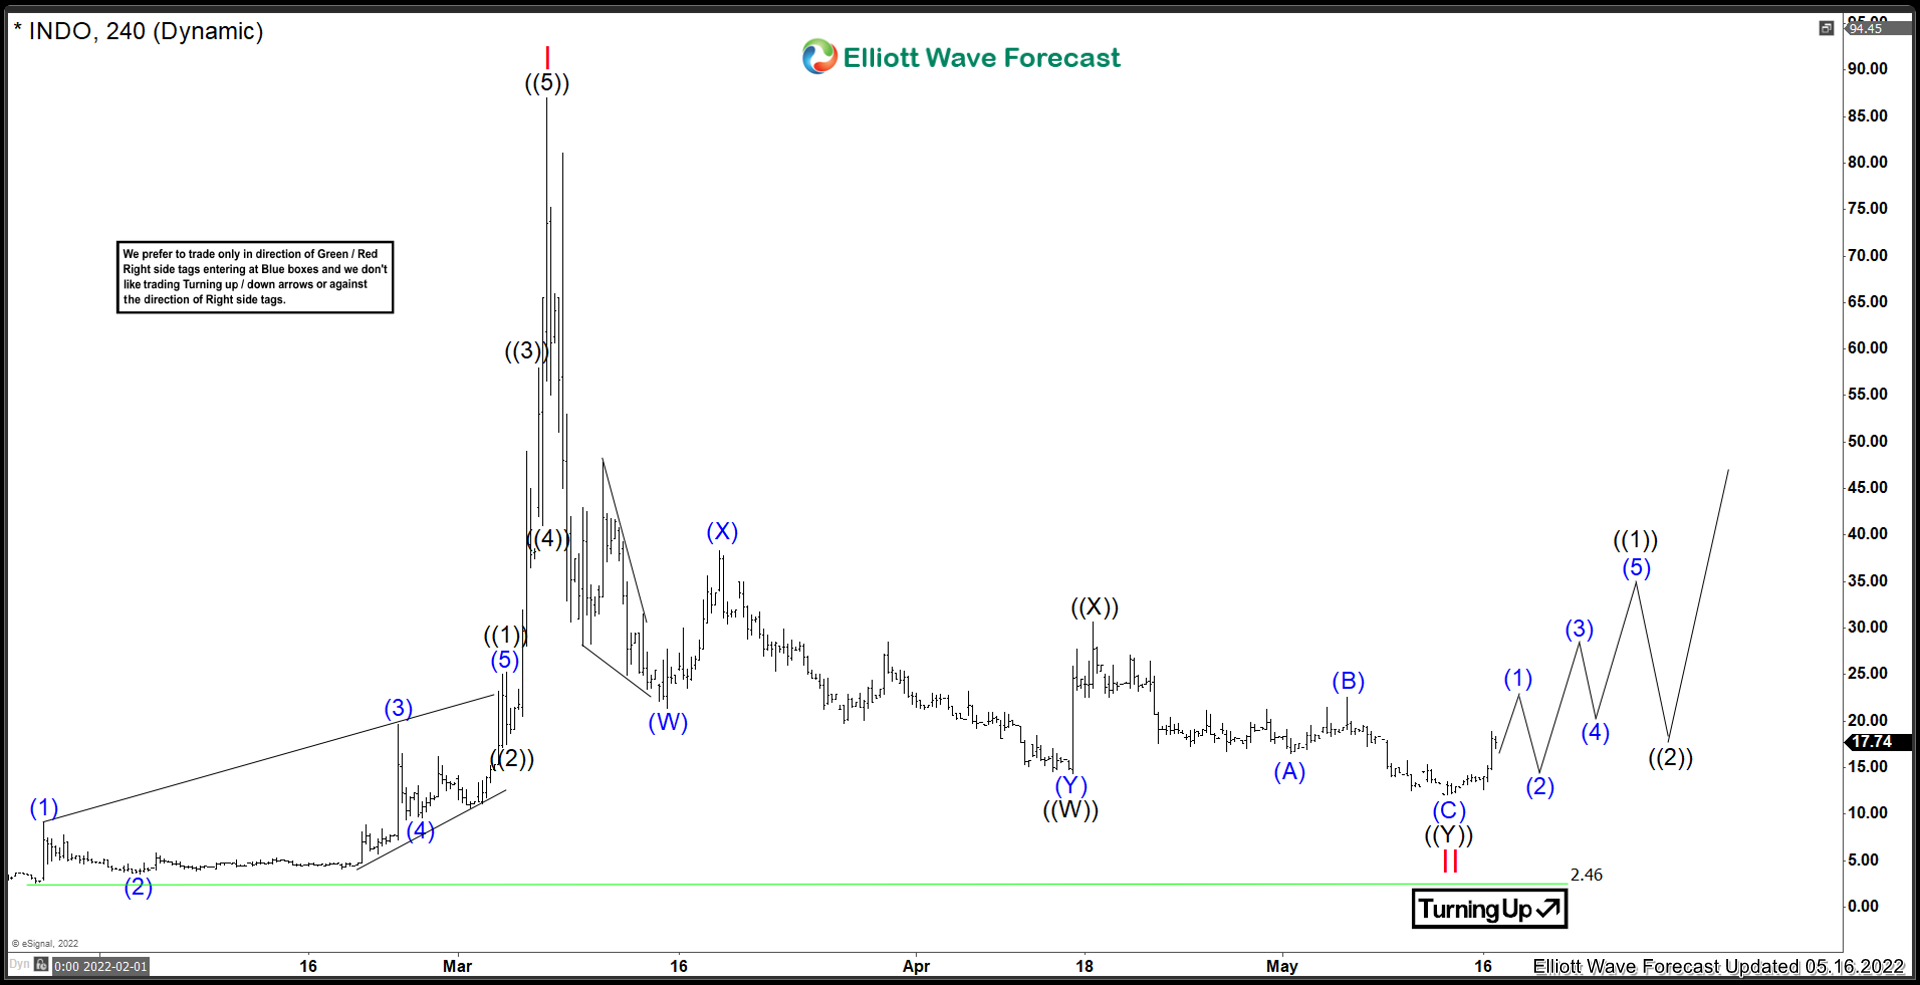
Since the 2009, MAA made a biggest pullback in March-2020 & made an intermediate low at $82.00. Thereafter it made all time high at $231.63 on 12/31/2021 as the part of a 5 swing impulse sequence. Currently, it favors a pullback in proposed 5-3-5 zigzag structure against the cycle from March-2020 low.

MAA - Elliott Wave Latest Daily View:​

It made an intermediate low of $82.00 on 3/23/2020 low during global selloff during early-2020. Thereafter, it placed ((1)) at $127.74 high on 6/08/2020 & ((2)) at $108.06 low on 6/24/2020 low. ((2)) was slightly below 0.382 retracement of previous cycle. While above there, it started third wave of third wave extension & ended ((3)) at $207.69 high on 10/28/2021. It favored ended ((4)) at $197.92 low as a very shallow correction. Finally, it finished ((5)) at $231.63 high on 12/31/2021 as wave I. While below there, it favors wave II correction in proposed zigzag correction towards $179.88 – $156.54 area before upside resumes.

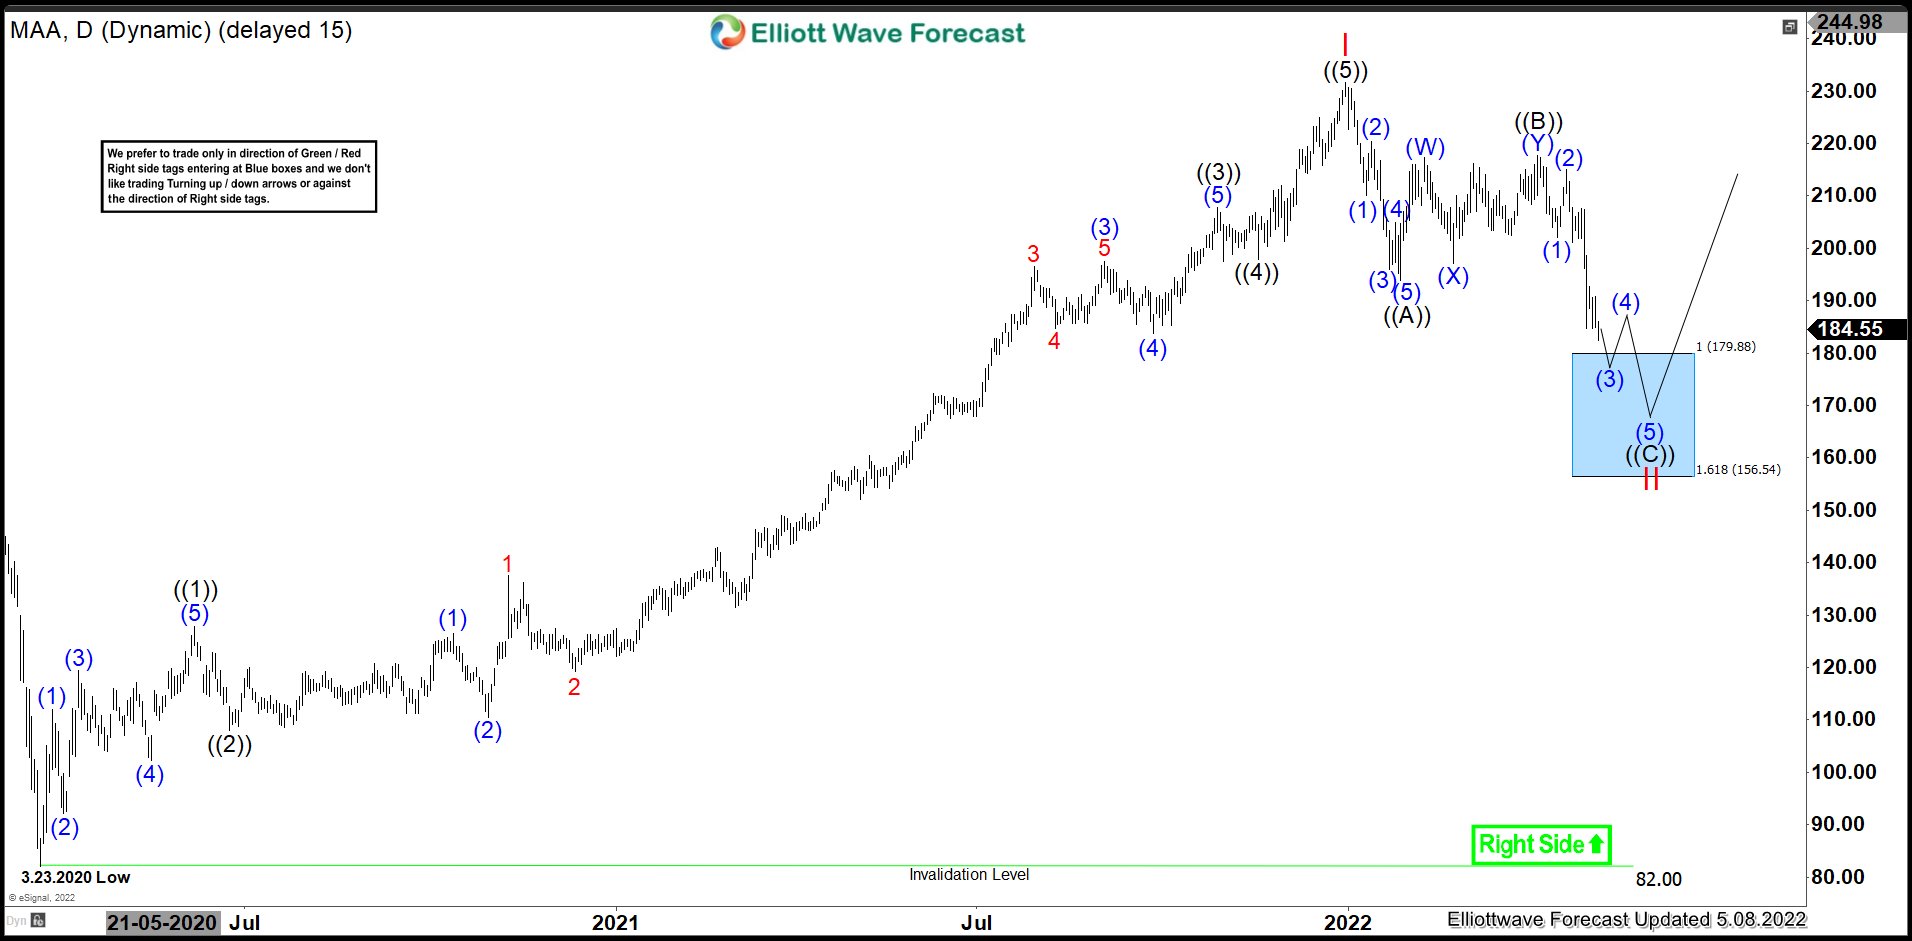
Below $231.63 high, it favored ended ((A)) at $193.91 low & ((B)) at $217.64 high on 4/06/2022. It already breaks below ((A)) low, calling for more weakness to continue towards $179.88 - $156.54 as blue box area. Currently, it favors lower (3) of ((C)) & expect a small bounce followed by new low to finish the correction of II before upside resumes or at least a 3 swing bounce. We expect it to extend higher from blue box area for next leg higher or at least a bounce.

Source: https://elliottwave-forecast.com/stock-market/maa-expect-pullback-before-rally-resumes/
 

Elliottwave-Forecast

Master Trader
Feb 17, 2017
2,453
9
84
www.elliottwave-forecast.com
In this blog, we will look at the strong rally in NZDJPY which took place this year, talk about the sequence, what it means for the pair and also what our trading strategy is going forward. We will look at a sequence chart and also a chart showing the extreme area down from April 20, 2022 peak and highlight the next extreme area where we can see buyers entering the market to resume the rally or produce 3 waves reaction higher at least.

NZDJPY Bullish Sequence Since January 28, 2022 Low​

Chart below shows NZDJPY ended a cycle from 03.2020 low at 10.2021 peak. This rally was in 5 waves as we can see a clear impulsive advance. This was followed by a 3 waves pull back which ended at 01.28.2022 low. Then pair resumed the rally and went on to make a new high above 10.2021 peak. Break above 10.2021 peak created an incomplete bullish sequence and opened extension higher. Sequence is bullish against 01.28.2022 low and as dips hold above this level, expect buyers to remain in control and appear in the dips in 3, 7 or 11 swings. While above 01.28.2022 low, next target area remains to be 98.31 - 103.74.

NZDJPY Bullish Sequence since January 28, 2022

NZDJPY: Elliott Wave Structure Down from April 20, 2022 Peak​

Decline from 04.20.2022 peak is unfolding as a Zigzag Elliott wave structure which is a 5-3-5 structure. In this structure, wave A is in 5 waves, wave B is in 3 waves and wave C is also in 5 waves. Wave B could be any corrective structure. We can see a clear 5 waves decline from 04.20.2022 peak to 04.26.2022 low which we have labelled as wave (A). This was followed by 3 waves bounce to 04.28.2022 peak and now pair has broken below 04.26.2022 low which creates a short-term incomplete bearish sequence. As bounces fail below 05.04.2022 (84.82) and more importantly below 04.28.2022 (85.00), expect more downside towards 81.29 - 78.74 where buyers should appear and resume the rally for next leg or produce 3 waves reaction higher at least. Alternative view is that bounce from the blue box will fail in 3 swings for another 3 swings extension lower to complete a double correction before higher again. Once the reaction from blue box reaches 50% Fibonacci retracement of the decline from 04.28.2022 (85.41), buyers from blue box should be able to eliminate risk on the trade and get into a risk free position and buy then buy again lower at next equal legs area in case of a larger double correction to the downside.

NZDJPY 4 Hour Elliott Wave and Blue Box

Source: https://elliottwave-forecast.com/forex/nzdjpy-bullish-sequence-trading-strategy/
 

Elliottwave-Forecast

Master Trader
Feb 17, 2017
2,453
9
84
www.elliottwave-forecast.com
LTCUSD has seen tremendous selling over the last few weeks. It recently hit 100% Fibonacci extension down from February 10, 2022 peak down to February 24, 2022 low projected lower from March 30, 2022 peak. In this article, we will look at how our members knew that rally from February 24, 2022 low to March 30, 2022 was a counter trend rally and we highlighted the selling area with a blue box for members. Members knew sellers should appear in the blue box to resume the decline for a new low below February 24, 2022 low or for 3 waves reaction lower at least.

LTCUSD 4 Hour Elliott Wave Analysis: 24 March, 2022​

Chart below shows decline from 11.10.2021 to be a 5 waves impulsive and it reached $120.49 reached on January 10, 2022. This was followed by a 3-3-5 running FLAT Elliott wave correction to complete at $144.13 on February 10, 2022. After this Litecoin resumed the decline and registered a new low at $91.74 on February 24, 2022.

LTCUSD started bouncing again and we highlighted $121.54 - $136.57 as 100 - 161.8% Fibonacci extension area with a blue box and as an area for 3 waves corrective bounce to complete. Our members knew a 3 waves advance should end in the mentioned and decline should resume while price stayed below 161.8% Fibonacci extension level at $136.57 or we should get 3 waves reaction lower at least.

Blue Boxes are High-Frequency areas which are based in a relationship of sequences, cycles and calculated using extensions. We refer to them as High Frequency trading areas, we prefer blue boxes to enter in direction of the trend because blue Boxes are areas where majority of the times, both buyers and sellers again in direction of next
move for 3 swings at least and hence why they present high probability / low risk areas to enter the market in direction of the trend.

LTCUSD 28 March 4 Hour

LTCUSD: 4 Hour Elliott Wave Analysis: 9 May, 2022​

Chart below shows sellers did appear in the blue box area and LTCUSD resumed the decline, it dropped to a new low below February 24, 2022 low and today it reached 100% Fibonacci extension target at $81.94 which means it dropped $57 (42%) from the blue box high within 6 weeks providing a nice move for the clients. It already reached the minimum target at $81.94 but structure from blue box high is not a complete 5 waves move yet and we expect the bounces to fail for more downside to complete the structure.

LTCUSD 9 May 4 Hour Elliott Wave Analysis

Source: https://elliottwave-forecast.com/trading/ltcusd-blue-box-shorts-reached-target/
 

Elliottwave-Forecast

Master Trader
Feb 17, 2017
2,453
9
84
www.elliottwave-forecast.com
$SLV Further Weakness Expected In The Larger Cycles

Firstly there is data back to when the ETF fund began in 2006 as seen on the weekly chart shown below. The fund made a low in 2008 at 8.45 that has not since been taken out in price. This analysis assumes from the October 2008 lows to the April 2011 highs was a larger degree impulse cycle up from the all time Silver lows.

Secondly, the decline from the April 2011 highs down to the May 2011 lows was five waves. Price held below the April 2011 highs during the bounce from the May 2011 lows to the August 2011 high.

The analysis continues below the weekly chart.


Thirdly, the cycle from the August 2011 high now appears complete. The red wave I, expanded flat wave II bounce & wave III decline to the December 2015 lows best looks as two Elliott Wave impulses. The bounce to the August 2016 high was strong enough to suggest it had corrected the cycle from the red wave II highs in February 2012. From the August 2016 high the sideways to lower decline appears to be an Elliott Wave triangle structure. This ended the wave “E” at the February 2020 highs. From this point in time the instrument printed another Elliott wave impulse lower into the March 2020 lows at 10.86.

In conclusion. Down from the April 2011 highs SLV exhibits qualities of an Elliott Wave zig zag structure that now appears complete. This is due to the bounce from the March 2020 lows. It was strong enough and apparently in a five wave impulse. This suggests the cycle lower from the 2011 highs had ended. Also the correction of the cycle up from the all time lows had completed at the March 2020 lows. While below the March 2022 highs the metal can see another low in the highlighted blue box area before a larger degree turn higher again.

Source: https://elliottwave-forecast.com/stock-market/slv-further-weakness-expected-in-the-larger-cycles/
 

Elliottwave-Forecast

Master Trader
Feb 17, 2017
2,453
9
84
www.elliottwave-forecast.com
Chewy.com is an e-commerce company that specializes in pet food. Along with many other stocks, prices started a new cycle higher in March 2020. Chewy is now correcting that cycle and currently going fairly deep, and threatening to make new all time lows. Lets take a look at the company profile and see what they do:

“Chewy, Inc. is an American online retailer of pet food and other pet-related products based in Dania Beach, Florida. In 2017, Chewy was acquired by PetSmart for $3.35 billion, which was the largest ever acquisition of an e-commerce business at the time. The company completed its initial public offering in 2019, raising $1 billion.

Following the acquisition, Cohen remained CEO and operated the business largely as an independent unit of PetSmart. Between 2017 and 2018, Chewy’s sales increased from $2.1 billion to $3.5 billion, with 66% of sales coming from customers signed up for automatic recurring shipments. In 2018, Chewy created Chewy Pharmacy, an online pharmacy providing pet-targeted prescription medications. Orders placed through the business are completed in coordination with a team of in-house veterinarians.”


Lets take a look at the view from January 2022.

Elliottwave view January 2022:

Chewy

At the time, I was still looking for more swings lower to complete the correction. However, prices are at the blue box where a bounce can take place. This is the area where we do not like to sell anymore. Lets take a look at the updated view from May 2022.

Elliottwave View May 2022:​

Chewy


This stock made new all time highs in February 2021. After that peak, a deep correction has taken place. From the all time low @ 20.54, the stock has rallied in 5 waves and peaked in February of 2021. Medium term term view from Feb 2021 peak set @ 120.00 . The pullback since the peak over a year ago, has been a fairly clean pullback. There is a clear 5 waves down into ((A)), bounce in ((B)). As a result, the stock is declining in the final leg before a larger bounce may take place. Currently, the momentum is suggesting that blue (3) and (4) are set and as long as the 20,54 low remains intact, this instrument can still be correcting that 20.54 low.

It should be noted that there is a blue box that is present, from the 41.92 to invalidation level at 20.54. The blue boxes are areas where algos and buyers typically enter for a bounce. Prices are very close do invalidtion the bullish thesis. For now, we like to wait for some other sectors and indices like $SPY, $XLK, $XLY to reach some equal leg before buying some of these names. It can be choppy sideways to lower in the near term.

Source: https://elliottwave-forecast.com/stock-market/chewy-com-chwy-can-lows-hold/
 

Elliottwave-Forecast

Master Trader
Feb 17, 2017
2,453
9
84
www.elliottwave-forecast.com
In this technical blog we’re going to take a quick look at the Elliott Wave charts of NZDUSD forex pair. As our members know, the pair shows bearish sequences in the cycle from the February 2021 peak. The pair has made 3 waves bounce recently, that has reached our selling zone and gave us good trading opportunities. In the further text we are going to explain the Elliott Wave Forecast and the trading strategy.

NZDUSD H1 Elliott Wave Analysis 05.11.2022​

NZDUSD is correcting the cycle from the 0.65682 peak. Recovery has already reached blue box at 0.63552-0.64021 area to complete 2 red recovery. We recommended members to avoid buying the pair while we're favoring the short side from the blue box. Strategy is selling the pair at the marked zone. Invalidation for the trade would be break above 1.618 fibs extension: 0.64021. As the main trend is bearish we expect sellers to appear at the blue box for 3 waves pull back at least. Once pull back reaches 50 Fibs against the ((b)) black low, we will make short position risk free ( put SL at BE) and take partial profits.

As our members know Blue Boxes are no enemy areas , giving us 85% chance to get a reaction.

Reminder: You can learn about Elliott Wave Rules and Patterns at our Free Elliott Wave Educational Web Page.

NZDUSD

NZDUSD H1 Elliott Wave Analysis 05.12.2022​

The pair found sellers at the blue box area: 0.63552-0.64021 and made turn lower from there. As a result , members who took short trades made positions risk free ( Put SL at BE) and took partial profits. We got a break toward new lows which makes the pair bearish against the 0.63802 peak in first degree. At this stage we see wave 2 red completed at the 0.6380 high. While mentioned pivot holds, the pair can keep finding intraday sellers in 3,7,11 swings for a further extension down.

Keep in mind market is dynamic and presented view could have changed in the mean time. You can check most recent charts in the membership area of the site. Best instruments to trade are those having incomplete bullish or bearish swings sequences.We put them in Sequence Report and best among them are shown in the Live Trading Room.


Elliott Wave Forecast
Source: https://elliottwave-forecast.com/trading/nzdusd-selling-rallies-blue-box-area/
 

Elliottwave-Forecast

Master Trader
Feb 17, 2017
2,453
9
84
www.elliottwave-forecast.com
In this technical blog, we will look at the past performance of 1 hour Elliott Wave Charts of NVDA. In which, the decline from 29 March 2022 high unfolded as an impulse sequence and showed a lower low sequence in a higher time frame charts. Therefore, we knew that the structure in NVDA is incomplete to the downside & should see more weakness. So, we advised members not to buy the stock & sell the bounces in 3, 7, or 11 swings at the blue box areas. We will explain the structure & forecast below:

NVDA 1 Hour Elliott Wave Chart​

NVDA Elliott Wave View: Selling The Extreme Blue Box Area

Here’s 1hr Elliott wave Chart from the 5/05/2022 Post-Market update. In which, the decline to $181.56 low ended 5 waves from 3/29/2022 high in wave ((A)) & made a bounce in wave ((B)). The internals of that bounce unfolded as an Elliott wave zigzag correction where wave (A) ended at $201.28 high. Then a pullback to $182.93 low ended wave (B) pullback and started the (C) leg higher towards $202.62- $214.82 blue box area from where sellers were expected to appear.

NVDA 1 Hour Elliott Wave Chart​

NVDA Elliott Wave View: Selling The Extreme Blue Box Area

This is the 1hr view from the 5/08/2022 Weekend update. In which the stock is showing a reaction lower taking place from the blue box area allowing shorts to get into a risk-free position shortly after taking the position. Since then, the stock managed to see a break below $181.56 low confirming the next extension lower. However, it's important to note that with further data we were able to adjust the structure of the bounce to a double three structure.

Source: https://elliottwave-forecast.com/stock-market/nvda-elliott-wave-selling-extreme-blue-box-area/
 

Elliottwave-Forecast

Master Trader
Feb 17, 2017
2,453
9
84
www.elliottwave-forecast.com
Hello fellow traders. Another instrument that we have been trading lately is $EURUSD. In this technical blog we’re going to take a quick look at the Elliott Wave charts of EURUSD and explain the trading strategy. As our members know, EURUSD has been showing incomplete bearish sequences. Recently he pair has made 3 waves bounce that has given us good selling opportunities. We recommended members to avoid buying the pair, while favoring the short side. In the further text we are going to explain the Elliott Wave Forecast and the trading strategy.

EURUSD H1 Elliott Wave Analysis 05.11.2022​

EURUSD is doing recovery against the 1.09367 peak which is unfolding as Elliott Wave Double Three Pattern. Recovery looks incomplete at the moment, looking for another push up toward 1.06080-1.0681 ( selling zone). We recommended members to avoid buying the pair in proposed push higher. Strategy is waiting for the price to make clear 7 swings and reach marked blue box zone before selling the pair. Invalidation for the trade would be break above 1.618 fibs extension: 1.0681. As the main trend is bearish we expect sellers to appear at the blue box for 3 waves pull back at least. Once pull back reaches 50 Fibs against the (x) blue low, we will make short position risk free ( put SL at BE) and take partial profits.

Reminder: You can learn about Elliott Wave Rules and Patterns at our Free Elliott Wave Educational Web Page.

EURUSD

EURUSD H1 Elliott Wave Analysis 05.05.2022​

The pair found sellers right at the blue box area: 1.06080-1.0681 and made decent reaction already. As a result , members who took short trades made positions risk free ( Put SL at BE) and took partial profits. At this stage we see wave ((iv)) completed at 1.06422 high. Decline from that peak shows impulsive sequences which increase chances of further extension down. Now we would like to see break of previous low : 04/28 in order to confirm next leg down is in progress.

EURUSD

EURUSD H1 Elliott Wave Analysis 05.13.2022​

Eventually the pair made break of 04/28 low confirming further extension down. We got 3 waves bounce that held below 1.06422 high and further decline as expected. As far as short term 1.0600 pivot holds, the pair can see more weakness in near term.

Keep in mind market is dynamic and presented view could have changed in the mean time. You can check most recent charts in the membership area of the site. Best instruments to trade are those having incomplete bullish or bearish swings sequences.We put them in Sequence Report and best among them are shown in the Live Trading Room.


Elliott Wave Forecast
Source: https://elliottwave-forecast.com/trading/eurusd-selling-blue-box/
 

Elliottwave-Forecast

Master Trader
Feb 17, 2017
2,453
9
84
www.elliottwave-forecast.com
Coinbase Global, Inc., branded Coinbase (COIN), is an American company that operates a cryptocurrency exchange platform. Coinbase is a distributed company; all employees operate via remote work and the company lacks a physical headquarters. It is the largest cryptocurrency exchange in the United States by trading volume. The company was founded in 2012 by Brian Armstrong and Fred Ehrsam.

COIN Daily Chart March 2022​

COIN Daily Chart March 2022

Last 2 months we built in COIN a flat structure "a", "b" and "c" from the peak to forecast a possible ending for wave (II). We were expecting the level of 94.70 as a bottom and then continue with the rally. Later, the stock made a bounce that damaged the proposed wave ((5)) of c. The new structure for time and value it is more likely to think that is a connector for a double correction from wave "b". (If you want to learn more about Elliott Wave Theory, follow these links: Elliott Wave Education and Elliott Wave Theory).

COIN Daily Chart May 2022​

COIN Daily Chart May 2022

We labeled again COIN, but now as a double correction w, x, y in red. Wave y is a 7 swings sequence that could end wave (II) pullback and the stock would be ready to resume the rally. Down from the peak of wave x, market made a impulse ending wave (A) at 231.77. Then bounce as wave (B) that finished at 281.99 and resume to the downside with another impulse to finish wave (C) and ((W)) at 162.20. After this, an irregular flat took place as a connector and wave ((X)) completed at 206.79. Market continued dropping in 3 swings and we are looking to complete wave ((Y)) of y of (II).

COIN 1 Hour Chart May 2022​

COIN 1 Hour Chart May 2022

Wave (A) of wave ((Y)) down ended at 111.80. Then COIN made a little bounce to end wave (B) at 132.81. From this level, we are looking to develop an impulse to complete wave (C) and the whole correction as wave (II). The wave 1 ended at 100.25 and wave 2 completed at 110.60. Market resumed the downtrend ending wave 3 at 40.83 and actually wave 4 rally could be done at 74.25. We cannot rule out a shy move to the upside to complete wave 4 before turning bearish again. In the last leg lower, we should see an impulse to complete the cycle. As minimum target we has marked 100% Fibonacci extension at 37.32 and as the worse case 123.6% Fibonacci extension at 14.88. Only a break of 100.00 from current levels we should call the bottom in and any pullback will be a buying opportunity.

This structure may be telling us that the cryptocurrencies should continue to fall and when COIN finds its low around 37.32 the cryptocurrencies could also start a new rally. Likewise, if COIN reached levels around 100.00, the cryptocurrencies could have their bottoms and any correction would be a good buying opportunity.

Source: https://elliottwave-forecast.com/stock-market/cryptos-crash-coin-answer/
 

Elliottwave-Forecast

Master Trader
Feb 17, 2017
2,453
9
84
www.elliottwave-forecast.com
The Fed has been very clear that their current mission is to reduce U.S inflation rate which is currently running at 8.3%. This is way over thier 2% target inflation rate. Two factors contribute to the high inflation rate: Demand and Supply. The Fed can only affect the demand by increasing the fed funds rate. This will result in the demand destruction, increasing the risk of economic recession. Supply however remains limited due to underinvestment in energy sector, war between Russia-Ukraine, and Covid-19 lockdown in China. Thus it's likely the Fed can trigger significant economic deceleration with their rate hikes if the supply side doesn't improve.

Already the market responding negatively to the Fed's plan. Both stocks and bonds have negative performance Year-to-Date. Crypto currency markets are also in turmoil with the latest collapse of algorithmic stablecoin TerraUSD (Luna). Below is Year to Date performance of various markets:


With the exception of energy and US Dollar, practically all markets are negative Year-to-Date. In this article, we will take a look at one energy stock Occidental Petroleum (ticker: OXY). Oxy is an American company engaged in oil and gas operations in three areas: the United States, the Middle East, and Columbia. Warren Buffet's Berkshire Hathaway has continued to buy the shares increasing its stake to 15.3% recently.

OXY Monthly Elliott Wave Chart​

OXY Elliott Wave Monthly Chart

Monthly chart of OXY above shows that the rally to 113.08 on May 2011 ended wave ((I)), and wave ((II)) pullback has ended at 8.52. Up from there, the stock has turned higher in wave ((III)). The rally from wave ((II)) low on October 2020 is unfolding as a 5 waves impulse Elliott Wave structure. Up from Wave ((II)), wave I ended at 33.50 and wave II ended at 21.62. Expect the stock to continue higher a few more times before finishing wave V. This should then also complete wave (I) before a larger pullback in wave (II) and higher again. As far as pivot at 8.52 low stays intact, expect dips to find support in 3, 7, 11 swing for further upside.

OXY Daily Elliott Wave Chart​


Daily Elliott Wave chart of OXY above shows the stock continues to rally from wave ((II)) low as a 5 waves impulse structure. Up from wave ((II)), wave I ended at 33.5 and wave II ended at 21.62. Wave III remains in progress with internal as a 5 waves in lesser degree. Up from wave II, wave ((1)) ended at 35.75 and pullback in wave ((2)) ended at 26.05. Wave ((3)) ended at 63.56 and wave ((4)) ended at 51.53. While above 51.53, and more importantly above 8.52, expect dips to find support in 3, 7, 11 swing for further upside.

Source: https://elliottwave-forecast.com/stock-market/energy-stock-continues-outperform-oxy-bullish-outlook/
 

Elliottwave-Forecast

Master Trader
Feb 17, 2017
2,453
9
84
www.elliottwave-forecast.com
Swatch Group is a Swiss manufacturer of watches and jewellery. Besides the product line Swatch, the group owns brands including Blancpain, Breguet, ETA, Glashütte, Omega, Longines, Tissot, Hamilton, Certina, Rado and Harry Winston. As a matter of fact, the Swatch company employs about 36000 people in over 50 countries. Founded 1983 and headquartered in Biel/Bienne, Switzerland, it can be traded under tickers $UHRN and $UHR at Six Swiss Exchange. After printing the all-time highs in April 2014, the stock price has lost about 3/4 of the price by March 2020. Currently, we see Swatch starting a new larger cycle higher.

In the initial article from March 2021, we have called for a new cycle up. We were right. Now, we see a pullback reseting part of the rise from March 2020 lows. In the current blog we analyze the consolidation pattern and provide a buying area for medium- and long-term investors.

Swatch Monthly Elliott Wave Analysis 05.15.2022​

The monthly chart below shows the Swatch stock $UHRN traded at Six Swiss. From the all-time lows, the stock price has developed a cycle higher in wave ((I)) of a grand super cycle degree. Swatch has printed the all-time highs in April 2014 at 108.00. Without any doubt, the advance is a textbook quality impulsive move up in 5 waves. Also, the subdivisions are motive waves, too. From April 2014 highs, a correction lower in wave ((II)) has unfolded as a double three pattern being 3-3-3 structure. It has reached the equal legs extension area towards 31.74-17.66. From that area, a strong reaction higher can be seen. Hereby, Swatch might be in the first stages of a new cycle in black wave ((III)) higher. While above 28.56, Swatch should extend towards the new all-time highs targeting the 135.96-202.34 area and even higher.

Swatch Elliott Wave Monthly

Swatch Daily Elliott Wave Analysis 05.15.2022​

The daily chart below shows the intial nest consisting of red waves I-II of blue wave (I). From the March 2020 lows, red wave I has developed an impuls higher. It has ended in June 2021 at 64.30. From there, a pullback in wave II is unfolding as an Elliott wave zigzag pattern. First, wave ((A)) has ended in October 2021 at 46.32. Then, a connector in wave ((B)) has printed a lower high at 58.95. From there, wave ((C)) is in progress and may develop an ending diagonal structure. Investors and traders can be looking to buy $UHRN from 40.95-29.82 area. There, a rally in wave III should take place or a bounce in 3 waves as minimum. The target for wave III will be 64.30 highs and even beyond.

Swatch Elliott Wave Daily

Source: https://elliottwave-forecast.com/stock-market/swatch-provides-entry-area/
 

Elliottwave-Forecast

Master Trader
Feb 17, 2017
2,453
9
84
www.elliottwave-forecast.com
Oz Minerals is an Australian mining company. The main products are gold and copper. Formed in 2008 after the merger of Oxiana Limited and Zinifex, it is based in Adelaide, Australia. One can trade it under the ticker $OZL at ASE.

Since 2020, we see a strong rally in all metals. Therefore, one should expect mining companies to profit substantially from the rising prices of the underlying assets. Indeed, we see Oz Minerals turning higher from 2013 lows. Without any doubt, the rising gold prices since 2015 have supported the $OZL stock. Then, from 2020 lows, a strong push higher in Copper has provided an additional effect to the company stock. Now, we expect more upside in both gold and copper. Therefore, Oz Minerals should remain profitable for both investors and traders as it offers a considerable upside in the next future.

In the original article from September 2021, we have expected a short term-pullback and more upside. As a matter of fact, the cycle from March 2020 has not ended yet at that time. Now, we see the cycle ended. In the current blog, we discuss the short-term pullback providing a medium-term buying opportunity.

Oz Minerals Monthly Elliott Wave Analysis 05.15.2022​

The monthly chart below shows the Oz Minerals stock $OZL at ASE. From the all-time lows, the stock price has developed a cycle higher in wave (I) of a super cycle degree. Hereby, $OZL has printed the all-time high on November 2007 at 43.20. From the 2007 highs, a correction lower has unfolded as a zigzag correction in the blue wave (II). It has ended correcting the previous super cycle by printing an important bottom in December 2013 at 2.11.

From the 2013 lows at 2.11, a new cycle in wave (III) has already started. Clear break above 43.20 highs would confirm that. Right now, the wave (III) might be within a red wave I. Hereby, initial nest comprising waves ((1)) and ((2)) of red wave I has been formed. It has ended on March 2020. From the March 2020 lows, waves ((3))-((4))-((5)) should accomplish the wave I. Then, one should expect a pullback in red wave II and an acceleration higher in red wave III of the blue wave (III). The target for the wave ((III)) will be 45.14-71.79 area and possibly higher.

Oz Minerals Elliott Wave Monthly

Oz Minerals Daily Elliott Wave Analysis 05.15.2022​

The daily view demonstrates the final stages of the advance from the March 2020 lows in black wave ((3)) and the pullback in wave ((4)). From the 5.83 lows in March 2020, an impulse in black wave ((3)) has ended in January 2021 at 29.75. From the highs, pullback in wave ((4)) is currently unfolding as an Elliott wave zizag pattern and should find support above 5.83 lows. First, wave (A) has ended in February 2022 at 24. Then, a connector in wave (B) has printed a lower high in April 2022 at 27.75. From there, blue wave (C) might be still in progress. It has reached the extension area lower, but may still see more downside.

Investors and traders can be looking to buy $OZL from 21.99-18.43 area. There, a rally to new highs in wave ((5)) or a bounce in 3 waves as minimum should be expected. The target for wave ((5)) will be 31.79-35.12 area and even beyond.

Oz Minerals Elliott Wave Daily

Source: https://elliottwave-forecast.com/stock-market/australian-oz-minerals-buying-area/
 

Elliottwave-Forecast

Master Trader
Feb 17, 2017
2,453
9
84
www.elliottwave-forecast.com
The Charles Schwab Corporation (SCHW), together with its subsidiaries, provides wealth management, securities brokerage, banking, asset management, custody & financial advisory services. The company operates through, investor services & Advisor services segments. It is based in Texas, comes under Financial services sector & trades as “SCHW” ticker as NYSE.

Since 2011 low, SCHW gave the biggest correction in March-2020 & made a low of $28.00. Thereafter, it made an all time high of $96.24 as impulse sequence ended on 2/09/2022. While below, there it correcting lower against the cycle form March-2020 low.

SCHW - Elliott Wave Latest Daily View :​


It started impulse sequence from $28.00 low on 3/16/2020. It ended ((1)) at $39.09 high on 4/29/2020 & ((2)) as flat correction at $31.63 low as 0.618 retracement against previous cycle. Above there, it started third wave extension & favored ended at $76.37 high on 6/04/2021 as around 2.618 extension of ((1)). It corrected in ((4)) at $65.73 low on 7/20/2021. Finally, it placed ((5)) as wave I red at all time high at $96.24 on 2/09/2022. Currently, it favors correcting lower against the cycle from March-2020 low.

It placed ((A)) at $74.63 low & ((B)) at $93.16 high. While below there, it favors ((C)) leg down as the part of zigzag structure in wave II. Currently, it appears ended (3) at 63.34 low & favors a corrective bounce of (4) of ((C)) followed by one more leg down in (5) to finish the corrective sequence. We like to buy the dips in proposed blue box area between $71.58 – $58.19 for the next leg higher or at least a 3 swing reaction higher.

Source: https://elliottwave-forecast.com/stock-market/schw-correcting-lower-next-cycle/
 

Elliottwave-Forecast

Master Trader
Feb 17, 2017
2,453
9
84
www.elliottwave-forecast.com
Bajaj has been on a bull run ever since it's 2018 to 2020 pandemic's correction. It has been climbing from 1790 to Feb 2021's 4350 high. We have been correcting ever since then. However, we should be expecting maybe just one more low prior to an advance.

Weekly Timeframe - 17th May 2022​

BAJAJ_AUTO_2022-05-17_10-18-05-1024x560.png


As you can see we unfolded a 5 wave sequence to complete I on a higher degree and correcting into wave II. Wave 2 seems be unfolding in a 7 swing structure and currently is in the 5th swing. Therefore we can be expecting wave ((Y)) of II to complete after one more low to the downside. This is subject to price remaining above 1788.65.

Lets break down on a daily timeframe on how we are seeing the correction to complete.

Daily Timeframe - 17th May 2022​

BAJAJ_AUTO_2022-05-17_10-12-40-1024x560.png


We are currently unfolding a complex correction which is a 7 swing structure. Currently unfolding 5th swing right now and we are looking at price to complete it's correction prior to an advance, which is subject to below 4361.40. This would complete II corrective cycle.

We would like to see a variety of things prior to calling this correction a complete. One of them being a 5 wave up and most importantly we want it to break the extreme of wave I to the upside.

Source: https://elliottwave-forecast.com/elliottwave/bajaj-auto-expecting-correction-prior-advance/
 

Elliottwave-Forecast

Master Trader
Feb 17, 2017
2,453
9
84
www.elliottwave-forecast.com
Hello fellow traders. In this technical blog we’re going to take a quick look at the Elliott Wave charts of EURJPY , published in members area of the website. As our members know, we’ve been favoring the long side in EURJPY due to incomplete bullish sequences the pair is showing in the cycles from the June 2016 and May 2020 lows. Recently EURJPY made a pull back that has had a form of Elliott Wave Zig Zag pattern that has given us good trading opportunities. We expected EURJPY to find buyers at the extreme zone from the 04/21 peak. In the further text we are going to explain the Elliott Wave Pattern and trading strategy.

Before we take a look at the real market example, let’s explain Elliott Wave Zigzag.

Elliott Wave Zigzag is the most popular corrective pattern in Elliott Wave theory . It’s made of 3 swings which have 5-3-5 inner structure. Inner swings are labeled as A,B,C where A =5 waves, B=3 waves and C=5 waves. That means A and C can be either impulsive waves or diagonals. (Leading Diagonal in case of wave A or Ending in case of wave C) . Waves A and C must meet all conditions of being 5 wave structure, such as: having RSI divergency between wave subdivisions, ideal Fibonacci extensions and ideal retracements.

EURJPY

EURJPY Elliott Wave 4 Hour Chart 05.11.2022​

Current view suggests EURJPY is doing black pull back against the 124.33 low. Decline from the peak looks like 5 waves structure, which means cycle from the peak is incomplete. Most likely we got only first leg of the pull back. Recovery against the 04/21 peak ended as truncated Zig Zag pattern - (B) blue. Current view suggests (C) leg is in progress toward 133.075-129.77 area ( Blue Box) .
We don't recommend selling the pair against the main bullish trend. Strategy is waiting for the price to reached marked blue box zone, before buying the pair again. As the main trend is bullish we expect buyers to appear at the blue box for 3 waves bounce at least. Once bounce reaches 50 Fibs against the ((x)) black high, we will make long position risk free ( put SL at BE). Invalidation for the trade would be break of marked invalidation level 129.77.

As our members know, Blue Boxes are no enemy areas , giving us 85% chance to get a bounce.

You can learn more about Elliott Wave Patterns at our Free Elliott Wave Educational Web Page.

EURJPY Elliott Wave 4 Hour Chart 05.12.2022​

Eventually EURJPY made proposed leg down as we expected. The pair has found buyers at the Blue Box area and we are getting good reaction from there. Pull back completed at 132.621 low as a Zig Zag pattern. The rally from the blue box reached and exceeded 50 fibs against the (B) connector. Consequently, members who have taken the long trades at the blue box now enjoying profits in a risk free trades. Now we would need to see break of April 21st peak in order to confirm next leg up is in progress. Once the pair breaks 04/21 high, the pair will become bullish again in near term and might offer some new buying opportunities in the short term dips against the 132.621 low.

Note: Some labeling have been removed in order to protect clients' privileges.

Keep in mind that market is dynamic and presented view could have changed in the mean time. You can check most recent charts in the membership area of the site. Best instruments to trade are those having incomplete bullish or bearish swings sequences. We put them in Sequence Report and best among them are shown in the Live Trading Room

EURJPY

Elliott Wave Forecast
Source: https://elliottwave-forecast.com/elliottwave/eurjpy-buying-dips-zig-zag/
 

Elliottwave-Forecast

Master Trader
Feb 17, 2017
2,453
9
84
www.elliottwave-forecast.com
The last time I covered Indonesia Energy Corp was back in March 2022. The instrument had already done a 3 waves pullback from the peak, and was looking like a bottom was under way. Before I get into the charts, lets again take a look at what this company does:

“Indonesia Energy Corp is an independent energy company in the oil and gas business with operations primarily in Indonesia.

Our strategy is to build an oil and gas assets portfolio with an optimum mix between medium-sized producing blocks and exploration blocks with significant potential resources.

Indonesia Energy producing asset, Kruh Block, located in Pendopo, is a stable and positive cashflow generating oil asset. Our exploration play, Citarum Block, located in the most populated province in Indonesia, only 16 miles south of the capital city of Indonesia, Jakarta, is a de-risked asset with proven presence of hydrocarbons that offers an immense growth opportunity and downstream integration possibilities.

We are also conducting a joint study program to acquire an area that we believe to hold large amounts of crude oil due to its proven petroleum system and location on the Northwest Java basin, the Rangkas Area.”


So lets take a look at the March 2022 view and see how it panned out.

Indonesia Energy Elliottwave View From March 2022:


As you can see above I was favouring the low was set. However the market had other plans and wanted to do a double correction. Instead, Indonesia Energy continued to extend lower in swings of 3 or 7. This is why it is important not to chase any reactions out of a low. If you chase, you risk getting caught in a drawdown situation. The only way to trade is the extreme areas where algos like to enter and exit.

So lets take a look at the current idea and see where things stand in this stock.

Indonesia Energy Elliottwave View May 2022


Medium term term view. As mentioned above, the correction in Red II took place as a double correction. The market was not ready to continue rallying higher back in March. After the (W) got taken in price, more choppy action continued to take place before bottoming in ((W)) and bouncing in ((X)). After that, another decline took place. This decline came in 3 waves (A) (B) (C) and the low comes without momentum divergence. This suggests that this has chance for a larger bounce in 3 swing at least. From the low set on May 12/2022, the stock appears to be rallying impulsively. It is imporant not to chase any price action. Any long trades are now trading against the lows of May 12, should that low get violated, there is greater potential for much more downside to take place.

In conclusion, the next leg higher is favoured to be underway. As long as Red II low holds. If that low gets invalided, then the stock can grind even lower before resuming higher.

Source: https://elliottwave-forecast.com/stock-market/indonesia-energy-corp-indo-bottom-set/
 

Elliottwave-Forecast

Master Trader
Feb 17, 2017
2,453
9
84
www.elliottwave-forecast.com
The last few weeks and months have been pretty hard for the market. Other than select commodities, everything else in the market has been selling off due to the Fed's tightening plan. The rate hikes and quantitative tightening plan cause a selloff in all asset classes including stocks, bonds, as well as precious metals. Gold has fared relatively well compared to other asset classes, but GDXJ (Gold Junior Miners) is not immune to the general risk off. In this article, we will update the current outlook for GDXJ.

GDXJ Monthly Elliott Wave Chart​


GDXJ Monthly chart above shows that it has formed a wave ((II)) / ((b)) pullback at 15.23. The rally from there so far is a 3 overlapping swing, but it's unlikely that it will break below January 2016 low (15.23) again. The rally from January 2016 low is in the form of a nesting 5 waves impulse. Up from wave ((II)), wave (I) ended at 52.50 and pullback in wave (II) ended at 19.52. Then the ETF rallied again in wave I towards 65.95. As long as wave II pullback holds above 19.52, expect the ETF to extend higher again.

GDXJ Daily Elliott Wave Chart​


Daily Chart of GDXJ above shows that the ETF is correcting cycle from 3/13/2020 low in wave II. The internal subdivision is unfolding as a double three ((W))-((X))-((Y)) where wave ((Y)) can see further downside to reach the blue box area of 18.91 - 33.02 before it ends wave II and turns higher. This blue box area is the 100% - 161.8% Fibonacci extension of the ((W)).

Source: https://elliottwave-forecast.com/stock-market/gold-miners-juniors-gdxj-support-area/
 

Elliottwave-Forecast

Master Trader
Feb 17, 2017
2,453
9
84
www.elliottwave-forecast.com
In this technical blog we’re going to take a quick look at the Elliott Wave charts of NZDJPY published in members area of the website. As our members knew, we’ve been favoring the long side in NZDJPY due to incomplete bullish sequences the pair is showing in the cycles from the March 2020 low against January 2022 low. NZDJPY cycle from January 2022 low ended at April 20, 2022 peak and it started pulling back. This pull back took the form of Elliott Wave Zig Zag pattern and members knew it was nothing more than another buying opportunity. In the remainder of the article, we are going to explain the Elliott Wave Pattern and talk about the blue box buying area.

Before we take a look at the real market example, let’s explain Elliott Wave Zigzag.

Elliott Wave Zigzag is the most popular corrective pattern in Elliott Wave theory . It’s made of 3 swings and is sub-divided as 5-3-5. Inner swings are labeled as A,B,C where A =5 waves, B=3 waves and C=5 waves. That means A and C can be either impulsive waves or diagonals. (Leading Diagonal in case of wave A or Ending in case of wave C) . Waves A and C must meet all conditions of being 5 wave structure, such as: having RSI divergence between wave subdivisions, ideal Fibonacci extensions and ideal retracements etc. Wave B could be a triangle, FLAT, Zigzag or a double three structure.

Zigzag Elliott Wave Structure for NZDJPY Blog

NZDJPY 9 May, 2022 4 Hour Elliott Wave Update​

Current view suggests NZDJPY is doing black pull back against the 75.21 low. First leg from the peak was in 5 waves which has been labelled as wave (A). Bounce was corrective and completed as wave (B). We have already seen a new low below wave (A) which makes it an incomplete sequence against April 28, 2022 peak. Current view suggests (C) leg is in progress toward 81.29 - 78.74 area (highlighted with a blue box).

We don’t recommend selling the pair against the main bullish trend. Strategy is waiting for the price to reached marked blue box zone, before buying the pair again. As the main trend is bullish we expect buyers to appear at the blue box for 3 waves bounce at least. Once bounce reaches 50 Fibs against blue (B) high, we will make long position risk free by either moving stop loss to entry position or taking partial profits and putting stop on remaining position below the low within the blue box. Invalidation for the trade would be break of marked invalidation level at 78.74. As our members know, Blue Boxes are no enemy areas , giving us around 80% or a higher chance to get 3 waves bounce at least from the blue box.

NZDJPY 9 May 4 Hour Elliott Wave Update

NZDJPY 23 May, 2022 4 Hour Elliott Wave Update​

Chart below shows NZDJPY made proposed leg down as we expected. The pair has found buyers at the Blue Box area and we are getting good reaction from there. Pull back completed at 79.45 low as a Zig Zag pattern. The rally from the blue box reached and exceeded 50 fibs against the (B) connector. Consequently, members who have taken the long trades at the blue box now enjoying profits in a risk free trades. Now we would need to see break of April 21st peak in order to confirm next leg up is in progress. Once the pair breaks April 20, 2022 high, the pair will become bullish again in near term and might offer some new buying opportunities in the short term dips against the 132.621 low. Until April 20, 2022 high doesn't break, a double correction lower still can't be ruled out in which case we would highlight the next blue box buying area for members.

Keep in mind that market is dynamic and presented view could have changed in the mean time. You can check most recent charts in the membership area of the site.

NZDJPY 23 May 4 Hour Elliott Wave Update

Source: https://elliottwave-forecast.com/trading/nzdjpy-buying-dip-elliott-wave-zigzag/
 

Elliottwave-Forecast

Master Trader
Feb 17, 2017
2,453
9
84
www.elliottwave-forecast.com
Savills, founded in 1855 is a British based real estate company that deal with variety of different services. Such as, commercial property management, residential sales and lettings, property management and land. They are internationally based and regarded as one of the largest real estate companies in the world. They are listed on the London Stock Exchange and FTSE 250 Index.

Since the beginning of Savills floating on the stock exchange, it has been in a strong bullish trend and we believe it is not done as of yet. United Kingdom's property market is thriving right now, despite our economy but people are still buying!

The most interesting part is that during Covid19 pandemic, despite all Estate Agencies being forced closed, Savills stock value was increasing.

Weekly Timeframe - 24th May 2022​

SVS_2022-05-24_11-04-51-1024x572.png


(IV) on a higher degree completed at March as we had that sudden shock of Covid19's infection rate increasing throughout the world including the United Kingdom. As soon as we entered into global lockdown i.e. all businesses to close down, Quantative Easing production pumping cash in all major Central Banks and grants being provided to small businesses.

Until December 2021, 2 years later, we witnessed a 5 wave bullish sequence into wave I of (V). This year, we mostly took out all those gains as the market is correcting deep into wave II and it seems like it is correcting as a Double Correction. This is subject to price remaining above 620 invalidation level.

Daily Timeframe - 24th May 2022​

SVS_2022-05-24_11-07-44-1024x572.png


Within wave II, as mentioned, we are unfolding as a Double Correction. Currently seems like we are unfolding the 7th swing into wave ((Y)). Wave ((Y)) can be expected to complete within the range of 815 - 696 prior to advancing into wave III.

Propert Market outlook of the United Kingodom​

According to Savills' research, within the next 5 years, house prices are expected to increase on average by 13.1%. Particularly within the north of England where currently the housing market is booming there.

Savills expects that demand for family homes will be more focused on the commuter belt and its fringes “as hybrid working patterns become more established”.

Seems like that the value of Savills' share price would increase as we progressively experience more success within the property market across the nation.

Source: https://elliottwave-forecast.com/un...y-going-advance-will-reflect-property-market/
 

Elliottwave-Forecast

Master Trader
Feb 17, 2017
2,453
9
84
www.elliottwave-forecast.com
Brookfield Asset Management (BAM) is an alternative asset manager & REIT/Real Estate Investment Manager firm focuses on real estate, renewable power, infrastructure & venture capital & private equity assets. It manages a range of public & private investment products & services for institutional & retail clients. It based in Toronto, Canada, comes under Financial services sector & trades as “BAM” ticker at NYSE.

As discussed in last article, BAM turned lower in ((C)) of II after ending ((B)) at $59.16 high. Currently, it favors further weakness in (5) of ((C)) towards $46.62- $38.87 area to finish II correction before next rally resumes.

BAM : Elliott wave analysis from 4/05/2022 :​

During global sell-off in March-2020, it made an intermediate low of $21.57 on 3/23/2020. While above there, it placed ((1)) at $37.73 high on 6/08/2020 and ((2)) at $29.09 low on 10/30/2020. ((2)) was 0.5 Fibonacci retracement against ((1)). Above there, it favors higher in third wave extension & finished ((3)) at $62.20 high on 11/08/2021. ((4)) favored ended at $50.87 low on 1/24/2022 as slightly above 0.382 retracement of ((3)). Finally, it favored ended ((5)) at $62.47 as minor high to end I red as impulse sequence started from March-2020 low.

BAM : Elliott wave Latest Daily view :​

Below $62.47 high, it favors II correction lower as zigzag. It placed ((A)) at $50.05 low & ((B)) at $59.16 high. While below there, it expect to extend lower in ((C)) towards $46.62- $38.87 area to finish II correction. Short term, it proposed ended (4) of ((C)) at $49.41 high & below there, it favors (5) of ((C)) lower. It expect at least one more low below (3) low to finish the correction of II. We like to buy the dips in blue box area for next leg higher or at least for 3 swing reaction upside.

Source: https://elliottwave-forecast.com/stock-market/bam-expect-more-downside-before-rally-resumes/