
Elliott Wave Analysis by EWF
- Thread starter Elliottwave-Forecast
- Start date
- Watchers 30
You are using an out of date browser. It may not display this or other websites correctly.
You should upgrade or use an alternative browser.
You should upgrade or use an alternative browser.
Nine Energy Services stock has had a remarkable rally in the first quarter of 2022. There are a few small companies that are making big moves with the swing in Crude Oil during the late Feb early March rally. But can this stock continue to rally to new highs? Today I’ll take a look at Nine Energy Services and see what the technical analysis has to say. Lets take a look at their company profile:
“Nine Energy Service, is a nimble completions company with experience in major North American basins and abroad, and a deep commitment to serving clients with smarter, customized answers and world-class resources. Nine is dedicated to qualifying what you want to accomplish, and then developing solutions that fit your project, your budget, and your goals. We believe in being a partner to our client, thinking outside the box and accomplishing what others cannot.
Nine is a leading completion services provider that targets unconventional oil and gas resource development across all North American basins and abroad. Nine brings years of experience into play with a new breed of a company dedicated to helping our clients reach their goals in the most efficient and cost-effective way.”
This is a highly speculative oilfield services company, lets take a look.

Medium term term view from the low set Dec 28/2021 @ $0.80. Nine is a technically clean chart off that low. Initially, the stock formed a nest in ((1)) ((2)) and blue (1) (2) off that low. After that, Nine broke out into a wave 3 of 3 advance. This took the stock from a low of $1.04 at (2), to a peak of $8.17 at the ((5)) of Red I high. After that, a sharp pullback has taken place while profit taking has occurred. Red II is favoured to have struck a low at 2.38 on March 16/2022. From there, a leading diagonal structure has rallied into (1), a pullback in (2) and now (3) of ((1)) is underway. As long as the recent low at blue (2) remains intact (at 2.60), the next leg higher is favoured to be underway
Source: https://elliottwave-forecast.com/stock-market/nine-energy-services-nine-next-leg-starting/
“Nine Energy Service, is a nimble completions company with experience in major North American basins and abroad, and a deep commitment to serving clients with smarter, customized answers and world-class resources. Nine is dedicated to qualifying what you want to accomplish, and then developing solutions that fit your project, your budget, and your goals. We believe in being a partner to our client, thinking outside the box and accomplishing what others cannot.
Nine is a leading completion services provider that targets unconventional oil and gas resource development across all North American basins and abroad. Nine brings years of experience into play with a new breed of a company dedicated to helping our clients reach their goals in the most efficient and cost-effective way.”
This is a highly speculative oilfield services company, lets take a look.
Nine Energy Services Elliottwave Wave View:

Medium term term view from the low set Dec 28/2021 @ $0.80. Nine is a technically clean chart off that low. Initially, the stock formed a nest in ((1)) ((2)) and blue (1) (2) off that low. After that, Nine broke out into a wave 3 of 3 advance. This took the stock from a low of $1.04 at (2), to a peak of $8.17 at the ((5)) of Red I high. After that, a sharp pullback has taken place while profit taking has occurred. Red II is favoured to have struck a low at 2.38 on March 16/2022. From there, a leading diagonal structure has rallied into (1), a pullback in (2) and now (3) of ((1)) is underway. As long as the recent low at blue (2) remains intact (at 2.60), the next leg higher is favoured to be underway
Source: https://elliottwave-forecast.com/stock-market/nine-energy-services-nine-next-leg-starting/
$MICEX Russia Index Longer Term Trend and Bullish Cycles
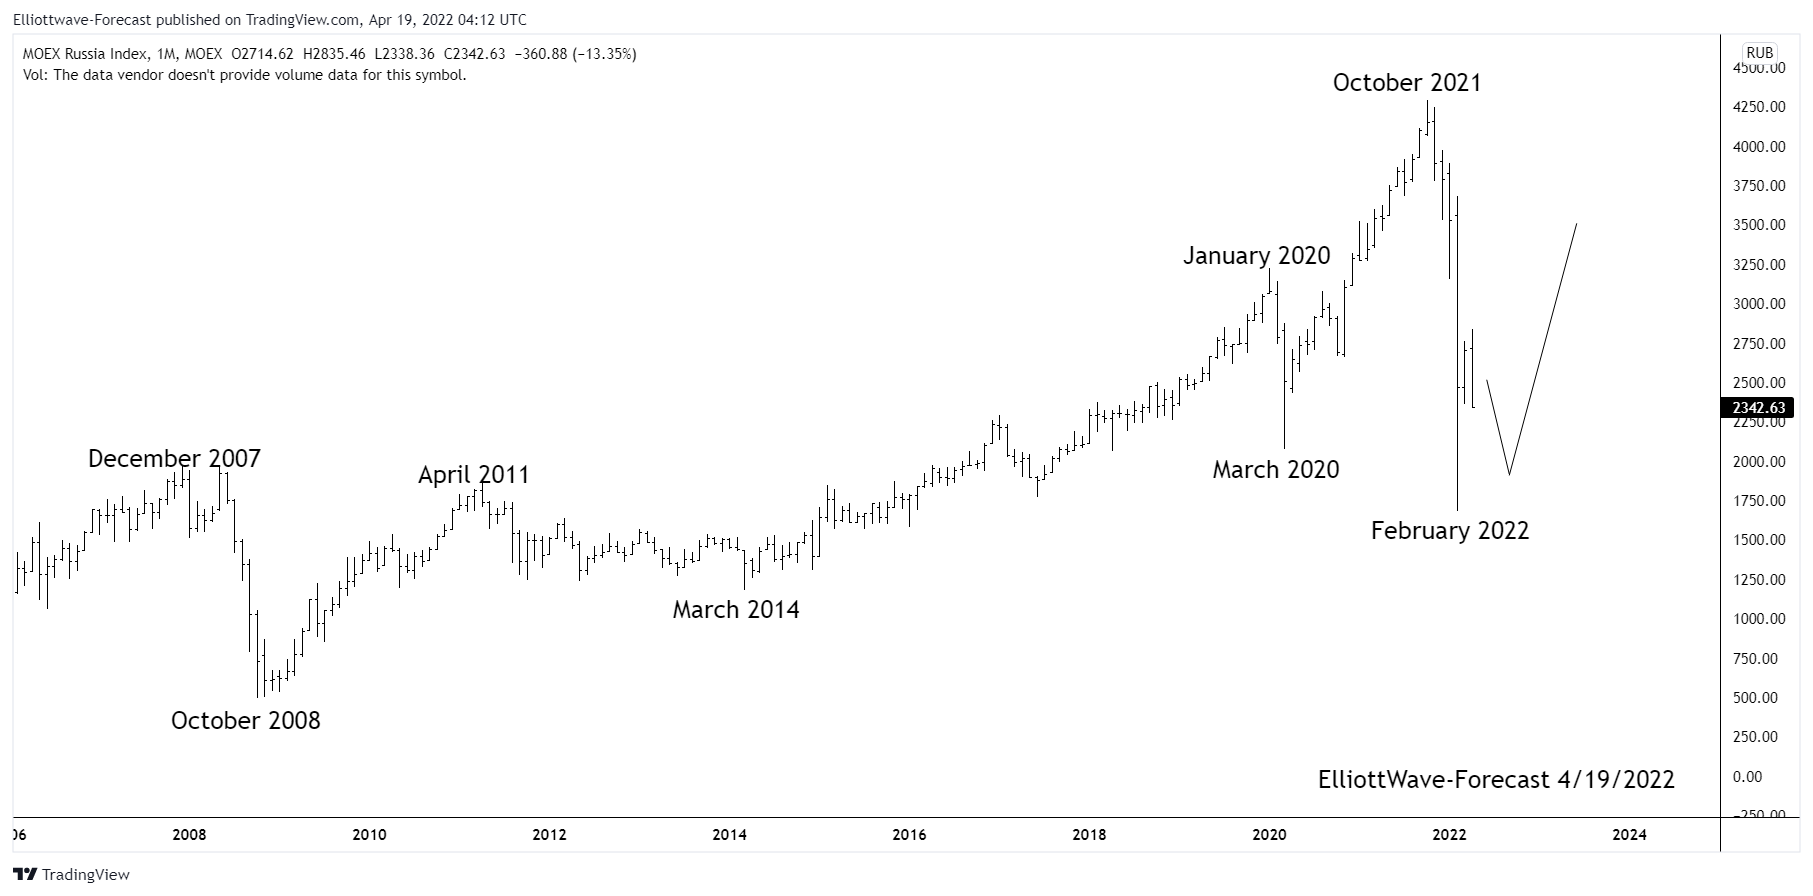
The Russian index has trended higher with other world indices since inception. The index remained in a long term bullish trend cycle into the December 2007 highs. It made a sharp correction lower in 2008 that lasted until October 2008 similar to other world indices. That is where the index corrected the whole decades long bullish cycle.
Firstly from the October 2008 lows the index rose into the April 2011 highs. Then the index saw an almost 3 year long correction of that cycle into the March 2014 lows. That pullback corrected the whole cycle up from the 2008 lows. From there to the January 2020 highs ended a cycle up from the March 2014 lows.
The analysis continues below the chart.
Monthly Chart

Secondly I would like to mention this overall price movement in the bullish cycles leaves the index in a couple of different scenarios. One way to view it from an Elliott wave perspective is the October 2021 highs was the end of a larger degree third wave. I do not prefer this because it suggests after another high back above there the index will suffer a huge correction bigger than ever seen before.
Thirdly in conclusion. The positive progression of mankind is generally reflected in equity indices. I do believe in the technical indicators that suggests I saw enough pain in the dips into the 2008 as well as the February 2022 lows that should eventually prove to be longer term cycle lows. I think the index has a longer term series of nested wave ones and twos. As suggested on the chart I think the cycle from the February 2022 lows should continue higher. In the near term whether if it further bounces toward the October 2021 highs or not, while below there a pullback can correct the cycle up from the February 2022 lows in 3, 7 or 11 swings. I expect the index will remain above there for a long time progressing higher.
Source: https://elliottwave-forecast.com/st...a-index-longer-term-trend-and-bullish-cycles/
The Russian index has trended higher with other world indices since inception. The index remained in a long term bullish trend cycle into the December 2007 highs. It made a sharp correction lower in 2008 that lasted until October 2008 similar to other world indices. That is where the index corrected the whole decades long bullish cycle.
Firstly from the October 2008 lows the index rose into the April 2011 highs. Then the index saw an almost 3 year long correction of that cycle into the March 2014 lows. That pullback corrected the whole cycle up from the 2008 lows. From there to the January 2020 highs ended a cycle up from the March 2014 lows.
The analysis continues below the chart.
Monthly Chart
Secondly I would like to mention this overall price movement in the bullish cycles leaves the index in a couple of different scenarios. One way to view it from an Elliott wave perspective is the October 2021 highs was the end of a larger degree third wave. I do not prefer this because it suggests after another high back above there the index will suffer a huge correction bigger than ever seen before.
Thirdly in conclusion. The positive progression of mankind is generally reflected in equity indices. I do believe in the technical indicators that suggests I saw enough pain in the dips into the 2008 as well as the February 2022 lows that should eventually prove to be longer term cycle lows. I think the index has a longer term series of nested wave ones and twos. As suggested on the chart I think the cycle from the February 2022 lows should continue higher. In the near term whether if it further bounces toward the October 2021 highs or not, while below there a pullback can correct the cycle up from the February 2022 lows in 3, 7 or 11 swings. I expect the index will remain above there for a long time progressing higher.
Source: https://elliottwave-forecast.com/st...a-index-longer-term-trend-and-bullish-cycles/
Hello fellow traders. In this technical article we’re going to take a look at the Elliott Wave charts charts of BTCUSD published in members area of the website. Recently Bitcoin made recovery against the 69097.5 peak that has unfolded as Elliott Wave Double Three Pattern. It made clear 7 swings from the lows and complete at the extreme zone. In further text we’re going to explain the Elliott Wave pattern and forecast
Before we take a look at the real market example, let’s explain Elliott Wave Double Three pattern.
Elliott Wave Double Three Pattern
Double three is the common pattern in the market , also known as 7 swing structure. It’s a reliable pattern which is giving us good trading entries with clearly defined invalidation levels.
The picture below presents what Elliott Wave Double Three pattern looks like. It has (W),(X),(Y) labeling and 3,3,3 inner structure, which means all of these 3 legs are corrective sequences. Each (W) and (Y) are made of 3 swings , they’re having A,B,C structure in lower degree, or alternatively they can have W,X,Y labeling.

You can learn more about Elliott WaveDouble Three and Zig Zag Patterns at our Free Elliott Wave Educational Web Page.

Keep in mind not every chart is trading recommendation. You can check most recent charts and new trading setups in the membership area of the site. Best instruments to trade are those having incomplete bullish or bearish swings sequences. We put them in Sequence Report and best among them are shown in the Live Trading Room.

Elliott Wave Forecast
Source: https://elliottwave-forecast.com/elliottwave/bitcoin-btcusd-elliott-wave-double-three/
Before we take a look at the real market example, let’s explain Elliott Wave Double Three pattern.
Elliott Wave Double Three Pattern
Double three is the common pattern in the market , also known as 7 swing structure. It’s a reliable pattern which is giving us good trading entries with clearly defined invalidation levels.
The picture below presents what Elliott Wave Double Three pattern looks like. It has (W),(X),(Y) labeling and 3,3,3 inner structure, which means all of these 3 legs are corrective sequences. Each (W) and (Y) are made of 3 swings , they’re having A,B,C structure in lower degree, or alternatively they can have W,X,Y labeling.

BTCUSD 4h Hour Elliott Wave Analysis 03.28.2022
Bitcoin is giving us ((X)) black recovery that is unfolding as Elliott Wave Double Three Pattern, with (X)(X)(Y) blue inner labeling. The price is correcting cycle from the all-time high: 69097.5 . If we take a close look , we can count clear 7 swings up from the 32969.3 low. All 3 waves have corrective subdivisions. Bitcoin has already reached extreme zone from the lows at 47159.9-55104.7. At that zone buyers should be ideally taking profits and sellers can appear again. Consequently , we expect to see reaction from the that area. From there we can get either decline toward new lows or larger 3 waves pull back at least.You can learn more about Elliott WaveDouble Three and Zig Zag Patterns at our Free Elliott Wave Educational Web Page.

BTCUSD 4h Hour Elliott Wave Analysis 04.19.2022
Sellers appeared right at the marked extreme zone : 47159.9-55104.7 and we got good reaction. ((X)) connector completed at 48241.3 high.The decline from that peak has a form of 5 waves- 1 red which increases chances of further extension down once 3 waves bounce in 2 red completes. Wave 2 recovery can see approximately 43460.5-44544.2 area before Bitcoin turns lower again in next leg down. Key pivot for presented short term view comes at 48241.3 high. If that pivot gets broken, it will invalidate the count.Keep in mind not every chart is trading recommendation. You can check most recent charts and new trading setups in the membership area of the site. Best instruments to trade are those having incomplete bullish or bearish swings sequences. We put them in Sequence Report and best among them are shown in the Live Trading Room.

Elliott Wave Forecast
Source: https://elliottwave-forecast.com/elliottwave/bitcoin-btcusd-elliott-wave-double-three/
Morgan Stanley has been considerably been climbing for the past decade without any financial crashes and economical issues affecting it to a point that it has interferred within it's bullish cycle. We have been eyeing this up recently, considering all stocks and indices have been correcting - this gave us a good opportunity to eye up Morgan Stanley as it may continue to appreciate within the near term future.

On a weekly timeframe we are currently within wave II of (III) to the upside. We believe alongside other stocks such as Bank of American, S&P500, it will form a new low within the corrective cyce of wave II. From the completion of that corrective cycle we can expect Morgan Stanley entering into wave III of (III). This is subject to price not breaching through 27.38 invalidation level at the extreme of wave (II).

Now looking at wave II a bit more closer. We are currently in sub-wave ((B)). It seems like ((B)) is unfolding as an expanded flat. Therefore we can expect wave (C) to unfold in a 5 wave sequence prior to ((C)) of II will be in play. Once ((B)) is done, we would want to breach wave ((A)) against ((B)) to measure our entry point of wave ((C)) based on equality. We would then like to see the breach of 109.82 - extreme of wave I to determine that price is currently in the next impulse wave, III.
Source: https://elliottwave-forecast.com/elliottwave/morgan-stanley-looking-buy-dips/
Weekly timeframe 22nd April 2022
On a weekly timeframe we are currently within wave II of (III) to the upside. We believe alongside other stocks such as Bank of American, S&P500, it will form a new low within the corrective cyce of wave II. From the completion of that corrective cycle we can expect Morgan Stanley entering into wave III of (III). This is subject to price not breaching through 27.38 invalidation level at the extreme of wave (II).
Daily timeframe 22nd April 2022
Now looking at wave II a bit more closer. We are currently in sub-wave ((B)). It seems like ((B)) is unfolding as an expanded flat. Therefore we can expect wave (C) to unfold in a 5 wave sequence prior to ((C)) of II will be in play. Once ((B)) is done, we would want to breach wave ((A)) against ((B)) to measure our entry point of wave ((C)) based on equality. We would then like to see the breach of 109.82 - extreme of wave I to determine that price is currently in the next impulse wave, III.
Source: https://elliottwave-forecast.com/elliottwave/morgan-stanley-looking-buy-dips/
Novavax, Inc. is an US American biotechnology company. Founded in 1987 and headquartered in Gaithersburg, Maryland, USA, it is a part of Russel1000 index. Investors can trade it under the ticker $NVAX at NASDAQ as well as $NVV1 at XETRA. Before 2020, the company has developed vaccines to counter such diseases like Ebola, influenza, respiratory syncytial virus (RSV) and others. During 2020, Novavax has redirected the efforts on development and approval of Nuvaxovid vaccine for COVID-19.
Even though the Novavax' engagement in the vaccine development is of high public attention, the stock price is in a steady decline from the highs of February 2021. Right now, we see the stock price entering the inflection area. In this article, we present our technical analysis and the outlook.
From the lows of November 2019, a new cycle in blue wave (III) has started. The first stages of that impulsive advance have been discussed in the initial article in April 2020. The price has broken within red wave I towards the new all-time highs. Hereby, red wave I has printed its top at 331.68 on February 2021. From there, pullback in red wave II is taking place. Investors and traders obtain a great opportunity to buy Novavax expecting an accelration higher within red wave III.
Investors and traders can buy the stock from 63.51-3.54 area. From there, $NVAX should accelerate in the red wave III of the blue wave (III) towards 331.68 and higher.

Source: https://elliottwave-forecast.com/stock-market/novavax-enters-buying-area/
Even though the Novavax' engagement in the vaccine development is of high public attention, the stock price is in a steady decline from the highs of February 2021. Right now, we see the stock price entering the inflection area. In this article, we present our technical analysis and the outlook.
Novavax Mobthly Elliott Wave Analysis 04.24.2022
The monthly chart below shows the Novavax stock $NVAX traded at Nasdaq. From the all-time lows, the stock price is showing a nesting price action. First, one can see an Elliott wave motive wave pattern within blue wave (I) of super cycle degree. It has ended on October 2001 at 311 highs. From there, a pullback in wave (II) has provided a slow consolidation ended in November 2019. During 18 years, the stock price has lost 99% of the value.From the lows of November 2019, a new cycle in blue wave (III) has started. The first stages of that impulsive advance have been discussed in the initial article in April 2020. The price has broken within red wave I towards the new all-time highs. Hereby, red wave I has printed its top at 331.68 on February 2021. From there, pullback in red wave II is taking place. Investors and traders obtain a great opportunity to buy Novavax expecting an accelration higher within red wave III.


Novavax Daily Elliott Wave Analysis 04.24.2022
The daily chart below shows in more detail the consolidation process within wave II. The red wave II unfolds as an Elliott wave double three pattern being 3-3-3 structure. Hereby, black waves ((W)) and ((X)) have already finished, wave ((Y)) is in progress and is reaching towards 100% extension area of the wave ((W)).Investors and traders can buy the stock from 63.51-3.54 area. From there, $NVAX should accelerate in the red wave III of the blue wave (III) towards 331.68 and higher.

Source: https://elliottwave-forecast.com/stock-market/novavax-enters-buying-area/
JPMorgan Chase & Co. (JPM) is an American multinational investment bank and financial services holding company headquartered in New York City and incorporated in Delaware. As of December 31, 2021, JPMorgan Chase is the largest bank in the United States, the world's largest bank by market capitalization, and the fifth-largest bank in the world in terms of total assets, with total assets totaling to US$3.831 trillion.

JPMorgan (JPM) completed a market cycle at 172.96 on October 2021 from March 2020 low. From the peak, the stock bank has been falling in the last 6 months and it was building a double correction according to the Elliott Theory. A double correction is a 7 waves structure. We can see the first wave which we call wave A, it ended at 151.84. Then the bounce went very high reaching 169.81 to complete wave B. Finally, JPM turned lower to complete wave C at 139.57, and the first set of 3 waves as wave (W). (If you want to learn more about Elliott Wave Theory, follow these links: Elliott Wave Education and Elliott Wave Theory).
Rally from wave (W) is a connector as wave (X) ended at 159.03. From here we need a new set of 3 swing to complete a double correction. Wave A ended at 127.27. Pullback as wave B ended at 143.93 and turn lower. This last swing down needs to be an impulse to complete wave C. As we can see wave ((i)) of the impulse ended at 125.02. Wave ((ii)) bounce completed at 133.51 and we are building wave ((iii)) continuing with the bearish momentum. We are calling more downside to come and it should target to 112.05 – 104.51 area before JPM rally again. Overall, the whole financial sector needs more downside in the market before rally.
Source: https://elliottwave-forecast.com/stock-market/jpmorgan-jpm-lose-10-rally/
JPM Daily Chart April 2022

JPMorgan (JPM) completed a market cycle at 172.96 on October 2021 from March 2020 low. From the peak, the stock bank has been falling in the last 6 months and it was building a double correction according to the Elliott Theory. A double correction is a 7 waves structure. We can see the first wave which we call wave A, it ended at 151.84. Then the bounce went very high reaching 169.81 to complete wave B. Finally, JPM turned lower to complete wave C at 139.57, and the first set of 3 waves as wave (W). (If you want to learn more about Elliott Wave Theory, follow these links: Elliott Wave Education and Elliott Wave Theory).
Rally from wave (W) is a connector as wave (X) ended at 159.03. From here we need a new set of 3 swing to complete a double correction. Wave A ended at 127.27. Pullback as wave B ended at 143.93 and turn lower. This last swing down needs to be an impulse to complete wave C. As we can see wave ((i)) of the impulse ended at 125.02. Wave ((ii)) bounce completed at 133.51 and we are building wave ((iii)) continuing with the bearish momentum. We are calling more downside to come and it should target to 112.05 – 104.51 area before JPM rally again. Overall, the whole financial sector needs more downside in the market before rally.
Source: https://elliottwave-forecast.com/stock-market/jpmorgan-jpm-lose-10-rally/
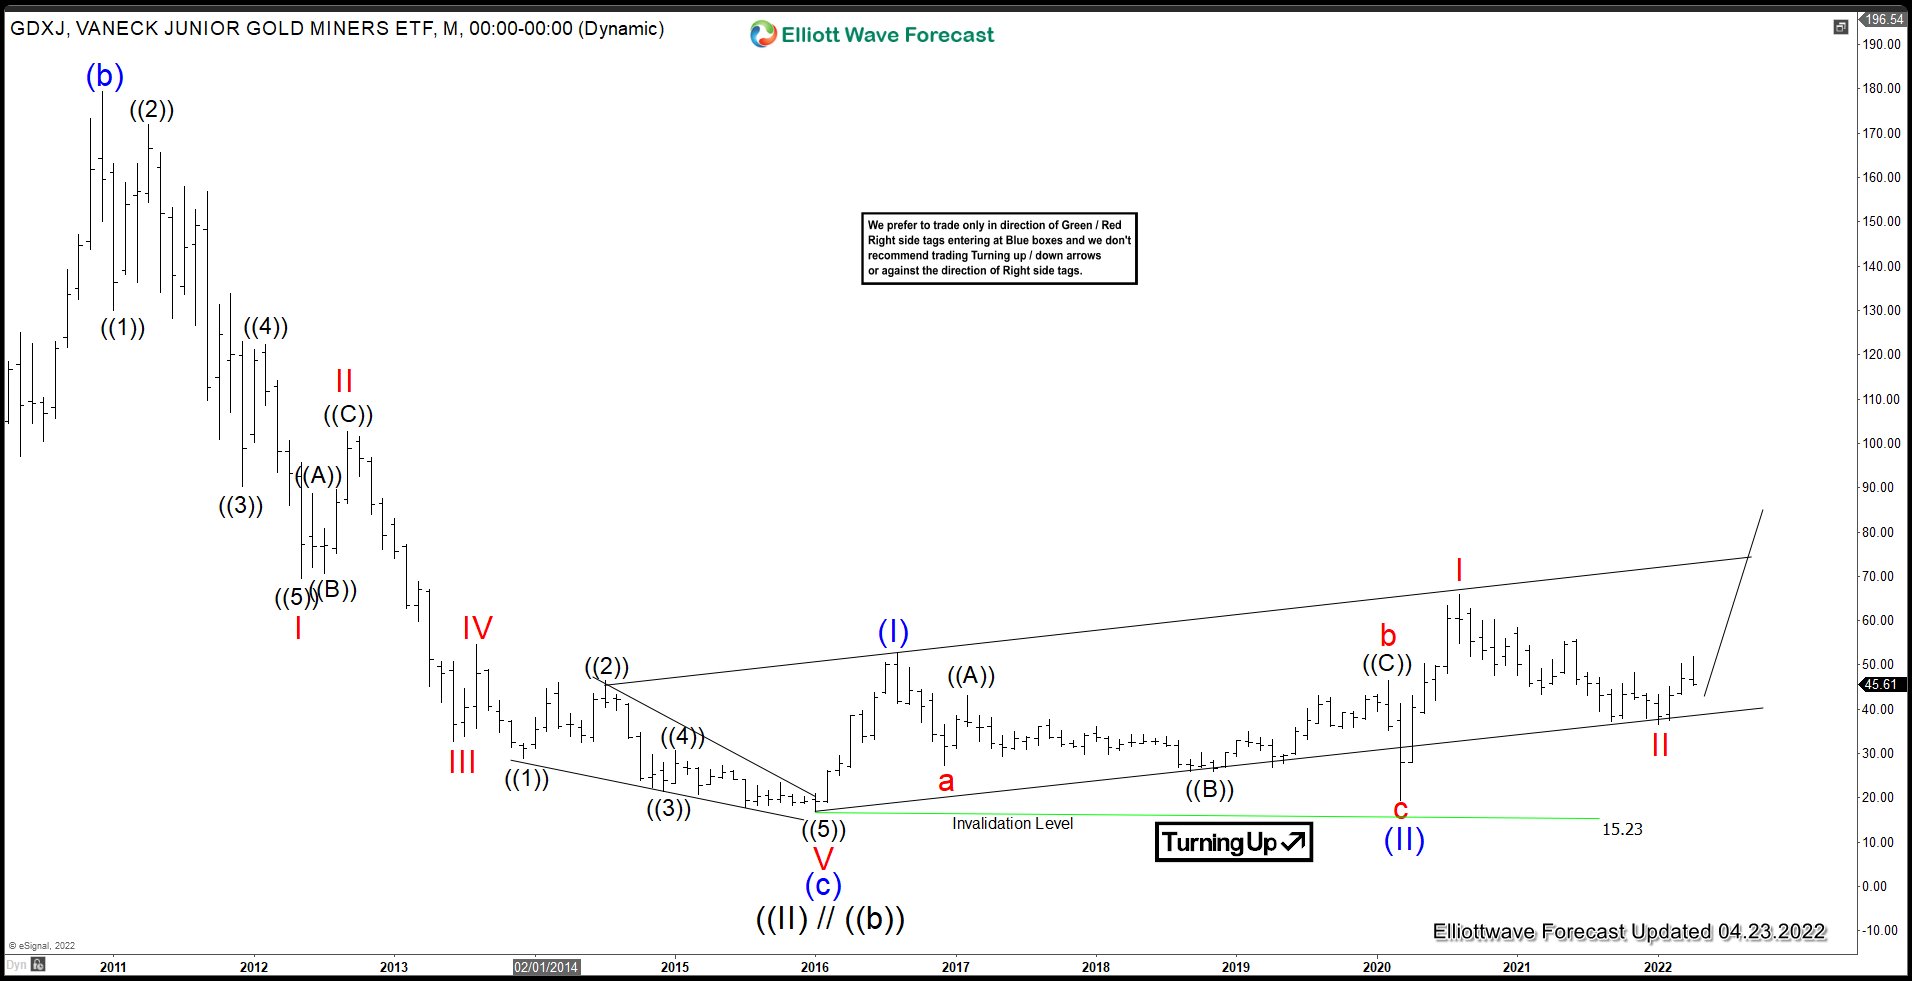
In our last update on GDXJ from November 2021, we mentioned that the ETF has already started the next leg higher. From the January 28 low of $36.55 to April 18 high of $51.92, it has rallied 42% higher. The ETF last week started to selloff and today we are going to update on the outlook for GDXJ.

GDXJ has completed grand super cycle wave ((II)) low on January 2016 at $16.87. Since then, the ETF has rallied as a nesting impulse. Up from wave ((II)), wave (I) ended at $52.50 and pullback in wave (II) ended at $19.52. The ETF then nested in wave (III). Above wave (II), wave I ended at $65.95 and pullback in wave II ended at $36.55. Expect the ETF to extend higher as long as it manages to stay above wave II at $36.55.

The Daily chart above shows the rally from wave II ended wave ((1)) as an impulse at $51.92. The ETF is now pulling back in wave ((2)) to correct the cycle from January 28, 2022 low in 3, 7, or 11 swing before the rally resumes. The pullback could unfold as a zigzag (A)-(B)-(C) and potential target is 50% - 76.4% retracement of wave ((1)) at $40.15 -$44.19 before it resumes higher again.
Source: https://elliottwave-forecast.com/stock-market/junior-gold-miners-gdxj-correction-in-progress/
GDXJ Monthly Chart
GDXJ has completed grand super cycle wave ((II)) low on January 2016 at $16.87. Since then, the ETF has rallied as a nesting impulse. Up from wave ((II)), wave (I) ended at $52.50 and pullback in wave (II) ended at $19.52. The ETF then nested in wave (III). Above wave (II), wave I ended at $65.95 and pullback in wave II ended at $36.55. Expect the ETF to extend higher as long as it manages to stay above wave II at $36.55.
GDXJ Daily Chart

The Daily chart above shows the rally from wave II ended wave ((1)) as an impulse at $51.92. The ETF is now pulling back in wave ((2)) to correct the cycle from January 28, 2022 low in 3, 7, or 11 swing before the rally resumes. The pullback could unfold as a zigzag (A)-(B)-(C) and potential target is 50% - 76.4% retracement of wave ((1)) at $40.15 -$44.19 before it resumes higher again.
Source: https://elliottwave-forecast.com/stock-market/junior-gold-miners-gdxj-correction-in-progress/
The Middleby Corporation (MIDD) designs, manufactures, markets, distributes & services a range of food services, food processing & residential kitchen equipment in the US, Canada, Asia, Europe, Middle East & Latin America. It is based in Elgin, Illinois, comes under Industrials sector & trades as “MIDD” ticker at Nasdaq.
Since February-2017, MIDD made finished larger correction at $41.73 low in early-2020 during global sell-off. After that it made ATH at $201.34 in February-2022 as impulse sequence started from $41.73 low. Currently, it favors correcting the cycle up from March-2020 low before resumes upside.
MIDD : Elliott Wave Latest Daily View:
It favored ended ((1)) at 108.26 high on 8/11/2020 started from $41.73 low on 3/23/2020. It placed ((2)) at $85.92 low as shallow correction against ((1)). While above there, it started third wave extension & favored ended ((3)) at $196.49 high on 8/05/2021 as 1.618 Fibonacci extension against ((1)). It placed ((4)) at $166.31 low as 0.236 fib retracement against ((3)). Finally, it favored ended ((5)) as ending diagonal at $201.34 high on 2/09/2022 as I red. While below there, it favors II correction as proposed zigzag structure before resumes higher.
Below $201.34 high, it placed ((A)) at $162.76 low & ((B)) at $175.34 high. While bounce fails below ((B)) high, it favors ((C)) of zigzag down towards $136.57 - $112.55 area to end II correction before upside resumes. It proposed ended (4) of ((C)) at $157.04 high. While below there, it expect further weakness towards blue box area before in (5). Alternatively, above $157.04 high, it can extend (4) before turning lower in (5). We like to buy the blue box area later for next leg higher or at least 3 swing bounce thereafter.
Source: https://elliottwave-forecast.com/stock-market/midd-expect-pull-back-rally-resumes/
Since February-2017, MIDD made finished larger correction at $41.73 low in early-2020 during global sell-off. After that it made ATH at $201.34 in February-2022 as impulse sequence started from $41.73 low. Currently, it favors correcting the cycle up from March-2020 low before resumes upside.
MIDD : Elliott Wave Latest Daily View:
It favored ended ((1)) at 108.26 high on 8/11/2020 started from $41.73 low on 3/23/2020. It placed ((2)) at $85.92 low as shallow correction against ((1)). While above there, it started third wave extension & favored ended ((3)) at $196.49 high on 8/05/2021 as 1.618 Fibonacci extension against ((1)). It placed ((4)) at $166.31 low as 0.236 fib retracement against ((3)). Finally, it favored ended ((5)) as ending diagonal at $201.34 high on 2/09/2022 as I red. While below there, it favors II correction as proposed zigzag structure before resumes higher.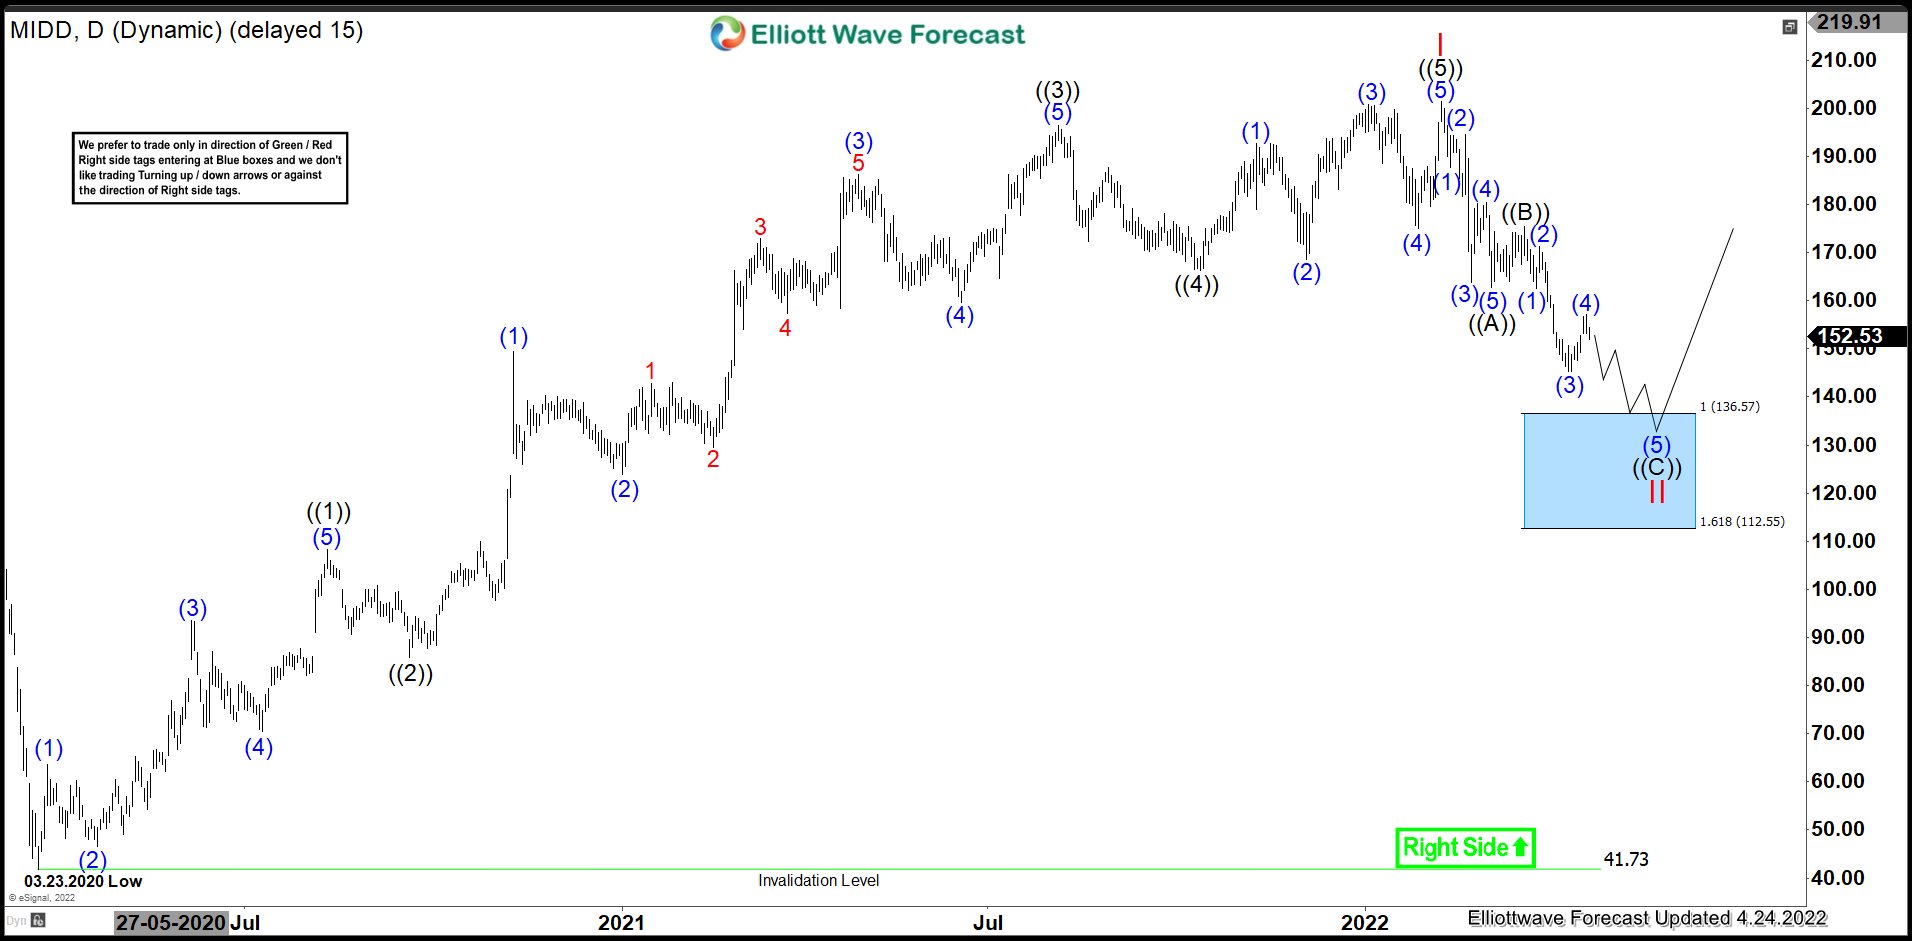
Below $201.34 high, it placed ((A)) at $162.76 low & ((B)) at $175.34 high. While bounce fails below ((B)) high, it favors ((C)) of zigzag down towards $136.57 - $112.55 area to end II correction before upside resumes. It proposed ended (4) of ((C)) at $157.04 high. While below there, it expect further weakness towards blue box area before in (5). Alternatively, above $157.04 high, it can extend (4) before turning lower in (5). We like to buy the blue box area later for next leg higher or at least 3 swing bounce thereafter.
Source: https://elliottwave-forecast.com/stock-market/midd-expect-pull-back-rally-resumes/
$UUP Can See Another High In The Longer Term Cycles
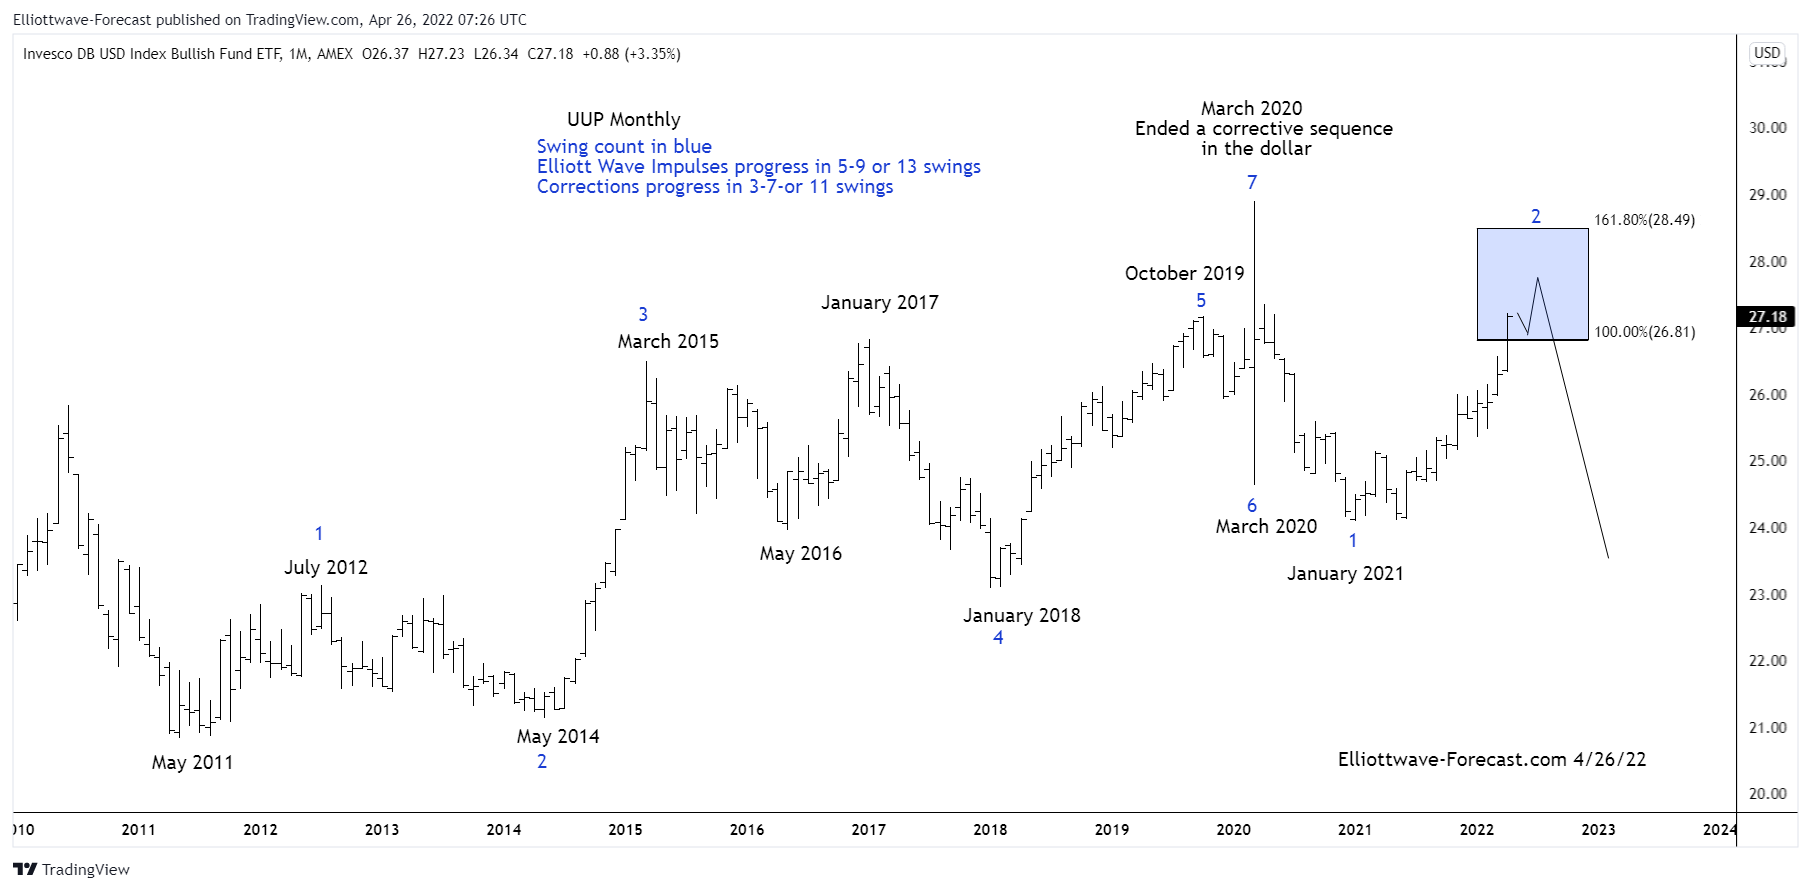
Firstly the dollar tracking ETF fund UUP inception date was 2/20/2007. Interestingly the dollar index has a low in March 2008. The UUP ETF fund shows a low in May 2011. The dollar index did make a pullback cycle low in May 2011 however it was well above the March 2008 lows. The cycle up from the May 2011 lows in UUP is the focus of this analysis where it begins on the monthly chart. It's expected to see some further downside relatively soon before any more larger bounces higher in the longer term cycles.
The analysis continues below the $UUP monthly chart.

Secondly the cycle up from the May 2011 lows in UUP appears to have advanced higher with some overlap in the cycles. From the May 2011 lows the dollar instrument appears to have 7 swings in place to the March 2020 highs. This cycle from the May 2011 lows to the March 2020 highs is a corrective sequence.
Thirdly and in conclusion. The decline from the March 2020 highs suggests further downside in the dollar for some time to come. March 2020 saw some fast 6th & 7th swings. The best reading of the cycles now suggests the price action from there to the January 2021 lows were an impulsive five waves of larger degree. The cycle from the January 2021 lows is mature however the dollar can see another high in the blue box extension area before resuming a larger downtrend.
Source: https://elliottwave-forecast.com/stock-market/uup-can-see-another-high-in-the-longer-term-cycles/
Firstly the dollar tracking ETF fund UUP inception date was 2/20/2007. Interestingly the dollar index has a low in March 2008. The UUP ETF fund shows a low in May 2011. The dollar index did make a pullback cycle low in May 2011 however it was well above the March 2008 lows. The cycle up from the May 2011 lows in UUP is the focus of this analysis where it begins on the monthly chart. It's expected to see some further downside relatively soon before any more larger bounces higher in the longer term cycles.
The analysis continues below the $UUP monthly chart.
Secondly the cycle up from the May 2011 lows in UUP appears to have advanced higher with some overlap in the cycles. From the May 2011 lows the dollar instrument appears to have 7 swings in place to the March 2020 highs. This cycle from the May 2011 lows to the March 2020 highs is a corrective sequence.
Thirdly and in conclusion. The decline from the March 2020 highs suggests further downside in the dollar for some time to come. March 2020 saw some fast 6th & 7th swings. The best reading of the cycles now suggests the price action from there to the January 2021 lows were an impulsive five waves of larger degree. The cycle from the January 2021 lows is mature however the dollar can see another high in the blue box extension area before resuming a larger downtrend.
Source: https://elliottwave-forecast.com/stock-market/uup-can-see-another-high-in-the-longer-term-cycles/
Houston American Energy Corporation stock enjoyed the impulsive rally the rest of the sector had in early 2022. After the pullback, can the rally continue? Lets take a look at their company profile:
“Houston American Energy Corp is an oil and gas exploration and production company. Our oil and gas exploration and production activities are focused on properties in the U.S. onshore Gulf Coast Region. Principally Texas and Louisiana, and on the development of concessions in the South American country of Colombia. We seek to utilize the contacts, experience, financial acumen and expertise in oil and gas geology, engineering and production provided by our management and Board of Directors to seek out and evaluate favorable drilling opportunities.
We generally seek to form partnerships and joint ventures to spread the cost and risks to us of drilling while maximizing our potential returns. The company’s fiscal discipline and debt-free capital structure offers investors a great deal of leverage and upside potential as revenue from new projects is realized."
This is a highly speculative energy producer, lets take a look at the charts!

Longer term view from the low set in September 2020 @ 0.84. After that, there was a large impulse into the peak at Red I at a peak of 6.36. Consequently, a very long and drawn out correction has taken place. After that, this correction ended on Feb 3 2022 @ a low of 1.09 in Red II. After that another very impulsive reaction took place to the upside again, which is favouring to have formed a nest in ((1)). Lets zoom into the 4H view.

Medium term term view from the low set Feb 2022 @ $1.09. After that, a large impulse has taken place in ((1)) which peaked on March 8/2022 at a high of 17.30. Consequently, a pullback has taken place to correct the cycle from the Feb 2022 low. It has unfolded as a double 3 correction. ((2)) is currently set on April 11 2022 low @ 3.19. In conclusion, this low needs to hold in order for this view to remain intact, or more grinding lower may take place before ((2)) is set.
Source: https://elliottwave-forecast.com/stock-market/houston-american-energy-husa-ready-rally/
“Houston American Energy Corp is an oil and gas exploration and production company. Our oil and gas exploration and production activities are focused on properties in the U.S. onshore Gulf Coast Region. Principally Texas and Louisiana, and on the development of concessions in the South American country of Colombia. We seek to utilize the contacts, experience, financial acumen and expertise in oil and gas geology, engineering and production provided by our management and Board of Directors to seek out and evaluate favorable drilling opportunities.
We generally seek to form partnerships and joint ventures to spread the cost and risks to us of drilling while maximizing our potential returns. The company’s fiscal discipline and debt-free capital structure offers investors a great deal of leverage and upside potential as revenue from new projects is realized."
This is a highly speculative energy producer, lets take a look at the charts!
Houston American Energy Elliottwave Daily View:

Longer term view from the low set in September 2020 @ 0.84. After that, there was a large impulse into the peak at Red I at a peak of 6.36. Consequently, a very long and drawn out correction has taken place. After that, this correction ended on Feb 3 2022 @ a low of 1.09 in Red II. After that another very impulsive reaction took place to the upside again, which is favouring to have formed a nest in ((1)). Lets zoom into the 4H view.
Houston American Energy Elliottwave 4H View:

Medium term term view from the low set Feb 2022 @ $1.09. After that, a large impulse has taken place in ((1)) which peaked on March 8/2022 at a high of 17.30. Consequently, a pullback has taken place to correct the cycle from the Feb 2022 low. It has unfolded as a double 3 correction. ((2)) is currently set on April 11 2022 low @ 3.19. In conclusion, this low needs to hold in order for this view to remain intact, or more grinding lower may take place before ((2)) is set.
Source: https://elliottwave-forecast.com/stock-market/houston-american-energy-husa-ready-rally/
In this blog, we will look at how we warned members that rally in ES_F (E-mini S&P 500 futures) last week from April 17 low to April 21 peak was nothing more than a corrective bounce because drop to a new low on April 17, 2022 was in 3 waves and Russell Futures didn't make a new low. Due to this we were convinced that we were in a 3-3-5 Expanded FLAT Elliott Wave Correction and we expected the decline to resume once 5 waves move from April 17, 2022 low had completed. Let's start by looking at what an expanded FLAT structure looks like.

Source: https://elliottwave-forecast.com/elliottwave/es_f-elliott-wave-flat-structure/
Elliott Wave Expanded FLAT Structure
Expanded FLAT can be of two types. Bullish Expanded FLAT and a bearish Expanded FLAT. Graphic below shows a bullish expanded FLAT structure which means once completed, market turns higher. If we turn the graphic below upside down, then wave A would be to the upside, wave B would be to the downside and wave C would be to the upside, this one is referred to as bearish expanded FLAT structure which means once completed, market turns lower.

ES_F 4.21.2022 1 Hour Elliott Wave Structure
Chart below shows decline from 3.29.2022 peak ended as 5 waves impulse structure at 4382.25 on April 12, 2022. This was followed by a reaction higher to 4466.75 and then a 3 waves drop reaching a new low at 4355.50 on April 17, 2022. Then ES_F started rallying again and rally appeared strong and impulsive. As drop to 4355.50 on April 17, 2022 was in 3 waves, we warned members that impulsive rally is nothing than part of a 3-3-5 expanded FLAT correction and should be ending soon resulting in a new low below April 17, 2022.

ES_F 4.24.2022 1 Hour Elliott Wave Structure
Chart below shows ES_F completed wave (v) of ((c)) of the expanded FLAT structure at 4509.09 on April 21, 2022 and went on to make a new low. Chart below shows we are in wave (( iii )) of C so we should see a bounce and 1 more low to complete 5 wave down from April 21, 2022 peak and should ideally end between 4254.85 - 4097.67 and result in a 3 waves bounce in wave (X) or in wave 4 at least correct the decline from 4509.09.
Source: https://elliottwave-forecast.com/elliottwave/es_f-elliott-wave-flat-structure/
Hello fellow traders. In this technical blog we’re going to take a quick look at the Elliott Wave charts of Nasdaq. As our members know, the Index shows bearish sequences in the cycle from the November 22. 2021 peak. Incomplete structure calls for a further decline, targeting 12181.4 area. Nasdaq has made 3 waves bounce recently, when it has reached our selling zone. We recommended members to avoid buying and keep selling rallies in 3,7,11 swings due to bearish sequences. In the further text we are going to explain the Elliott Wave Forecast and the trading strategy.
As our members know Blue Boxes are no enemy areas , giving us 85% chance to get a reaction.
Reminder:
Our charts are easy to trade and understand. When you see combination of right side stamp and blue box on the chart, the instrument can be traded. Quick explanation :
-Red bearish stamp+ blue box = Potential Selling Setup
-Green bullish stamp+ blue box = Potential Buying Setup
-Charts with Black stamps are not tradable.
You can learn about Elliott Wave Rules and Patterns at our Free Elliott Wave Educational Web Page.

Keep in mind market is dynamic and presented view could have changed in the mean time. You can check most recent charts in the membership area of the site. Best instruments to trade are those having incomplete bullish or bearish swings sequences.We put them in Sequence Report and best among them are shown in the Live Trading Room.

Elliott Wave Forecast
Source: https://elliottwave-forecast.com/trading/nasdaq-nq_f-forecasting-decline-blue-box/
Nasdaq H1 Elliott Wave Analysis 04.28.2022
Nasdaq correcting the cycle from the February 14303.5 peak. At this moment we believe recovery is still in progress as the price shows incomplete sequences. Consequently we are calling for more short term strength toward 13382.8-13663.1 area to complete (X) blue recovery. We recommended members to avoid buying the Index in proposed push up. Strategy is waiting for Blue Box to be reached before selling it. As the main trend is bearish we expect sellers to appear at the blue box for 3 waves pull back at least. Once pull back reaches 50 Fibs against the B red low, we will make short position risk free ( put SL at BE) and take partial profits. Invalidation for the trade would be break above 1.618 fibs extension:13663.1As our members know Blue Boxes are no enemy areas , giving us 85% chance to get a reaction.
Reminder:
Our charts are easy to trade and understand. When you see combination of right side stamp and blue box on the chart, the instrument can be traded. Quick explanation :
-Red bearish stamp+ blue box = Potential Selling Setup
-Green bullish stamp+ blue box = Potential Buying Setup
-Charts with Black stamps are not tradable.
You can learn about Elliott Wave Rules and Patterns at our Free Elliott Wave Educational Web Page.

Nasdaq H1 Elliott Wave Analysis 05.01.2022
Nasdaq reached equal legs ( blue box ) area at 13382.8-13663.1 and made turn lower from there. We got a decent reaction from the blue box. As a result , members who took short trades made positions risk free ( Put SL at BE) and took partial profits. At this stage we call wave (X) blue connector completed at 13543 high. We would like to see break of (W) blue low -04/26 to confirm next leg down is in progress.Keep in mind market is dynamic and presented view could have changed in the mean time. You can check most recent charts in the membership area of the site. Best instruments to trade are those having incomplete bullish or bearish swings sequences.We put them in Sequence Report and best among them are shown in the Live Trading Room.

Elliott Wave Forecast
Source: https://elliottwave-forecast.com/trading/nasdaq-nq_f-forecasting-decline-blue-box/
The Expanded Flat is one of trickiest structures in the Elliott Wave Theory. The structure comes with a strong reaction after new highs are made. But the idea is that the reaction comes in five waves, which confuse wavers. As a result, wavers often get trapped by the structure. When Mr. Elliott developed the theory back in the 1930s, he did not have the tools which we have today. We at EWF have developed a series of new rules. Some of those rules are explained in the article here. As we explained, the new set of rules allow us to identify the trap, so we can warn members and followers when it happens.
Correction in the market happens in the sequence of three, seven or eleven swings. The Expanded Flat always shows a divergence in the fifth swing but it is also showing five channels lower. It does not form a corresponding sequence in the momentum indicators however, which makes the sequence corrective. Here is what the Expanded Flat looks like in the Elliott Wave Theory:

As we can see the B wave trades above the beginning of the A wave. However, the market reacted lower, and pass the low of wave A. The reaction lower comes in five waves making all the wavers chase the wrong upside breakout. As we mentioned above, it is very tricky, and only having a new set of rules, and understanding of the market nature sequences will make traders avoid the traps.
Back in early March 2022, the $SPX makes new lows below the 01.24.2022. However, it never reached the 100% from the 01.04.2022 peak. The low comes with momentum divergence against the 01.24.2022. Back in the 1930s it was easy to get trapped by the market, but in 2022 it was easy for us to be able to see the trap. Here is the 4 Hour chart provided to members during 03.26.2022 update showing the proposed Flat taking place and the turn lower.

The Index ended the 5 waves structure and then we called lower early in the turn. Our members already knew at the moment that the sequences was incomplete. Consequently, a sell-off was coming into the ((Y)). Market turned lower as expected above. Now it is ending the seven swing structure by erasing the momentum divergence.

Source: https://elliottwave-forecast.com/stock-market/spx-expanded-flat-which-trick-buyers-last-month/
Correction in the market happens in the sequence of three, seven or eleven swings. The Expanded Flat always shows a divergence in the fifth swing but it is also showing five channels lower. It does not form a corresponding sequence in the momentum indicators however, which makes the sequence corrective. Here is what the Expanded Flat looks like in the Elliott Wave Theory:
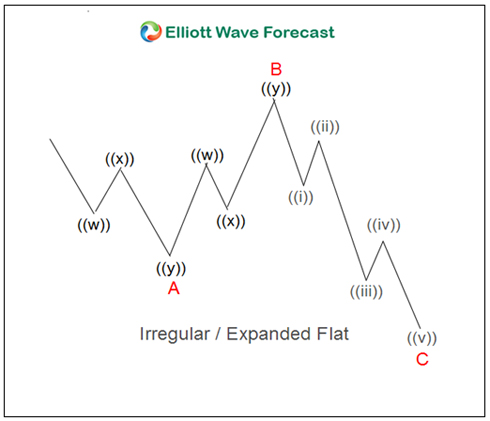
As we can see the B wave trades above the beginning of the A wave. However, the market reacted lower, and pass the low of wave A. The reaction lower comes in five waves making all the wavers chase the wrong upside breakout. As we mentioned above, it is very tricky, and only having a new set of rules, and understanding of the market nature sequences will make traders avoid the traps.
Back in early March 2022, the $SPX makes new lows below the 01.24.2022. However, it never reached the 100% from the 01.04.2022 peak. The low comes with momentum divergence against the 01.24.2022. Back in the 1930s it was easy to get trapped by the market, but in 2022 it was easy for us to be able to see the trap. Here is the 4 Hour chart provided to members during 03.26.2022 update showing the proposed Flat taking place and the turn lower.
$SPX - 4 hour update from 3.26.2022 :
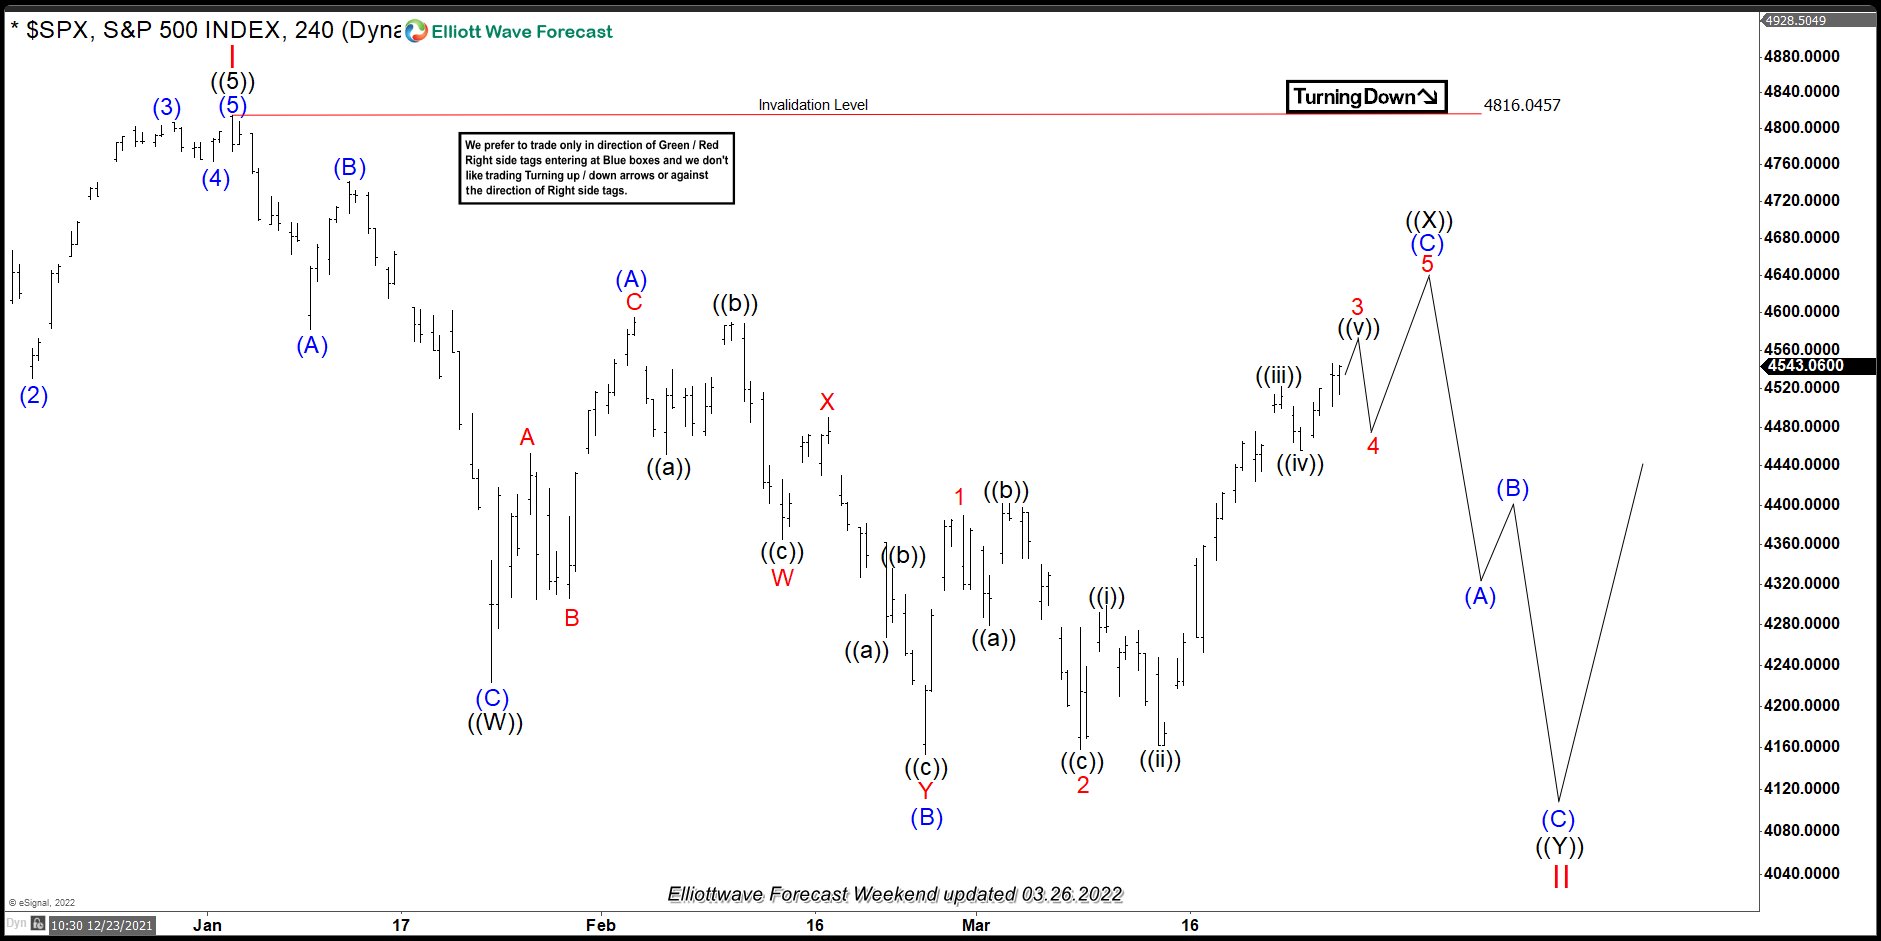
The Index ended the 5 waves structure and then we called lower early in the turn. Our members already knew at the moment that the sequences was incomplete. Consequently, a sell-off was coming into the ((Y)). Market turned lower as expected above. Now it is ending the seven swing structure by erasing the momentum divergence.
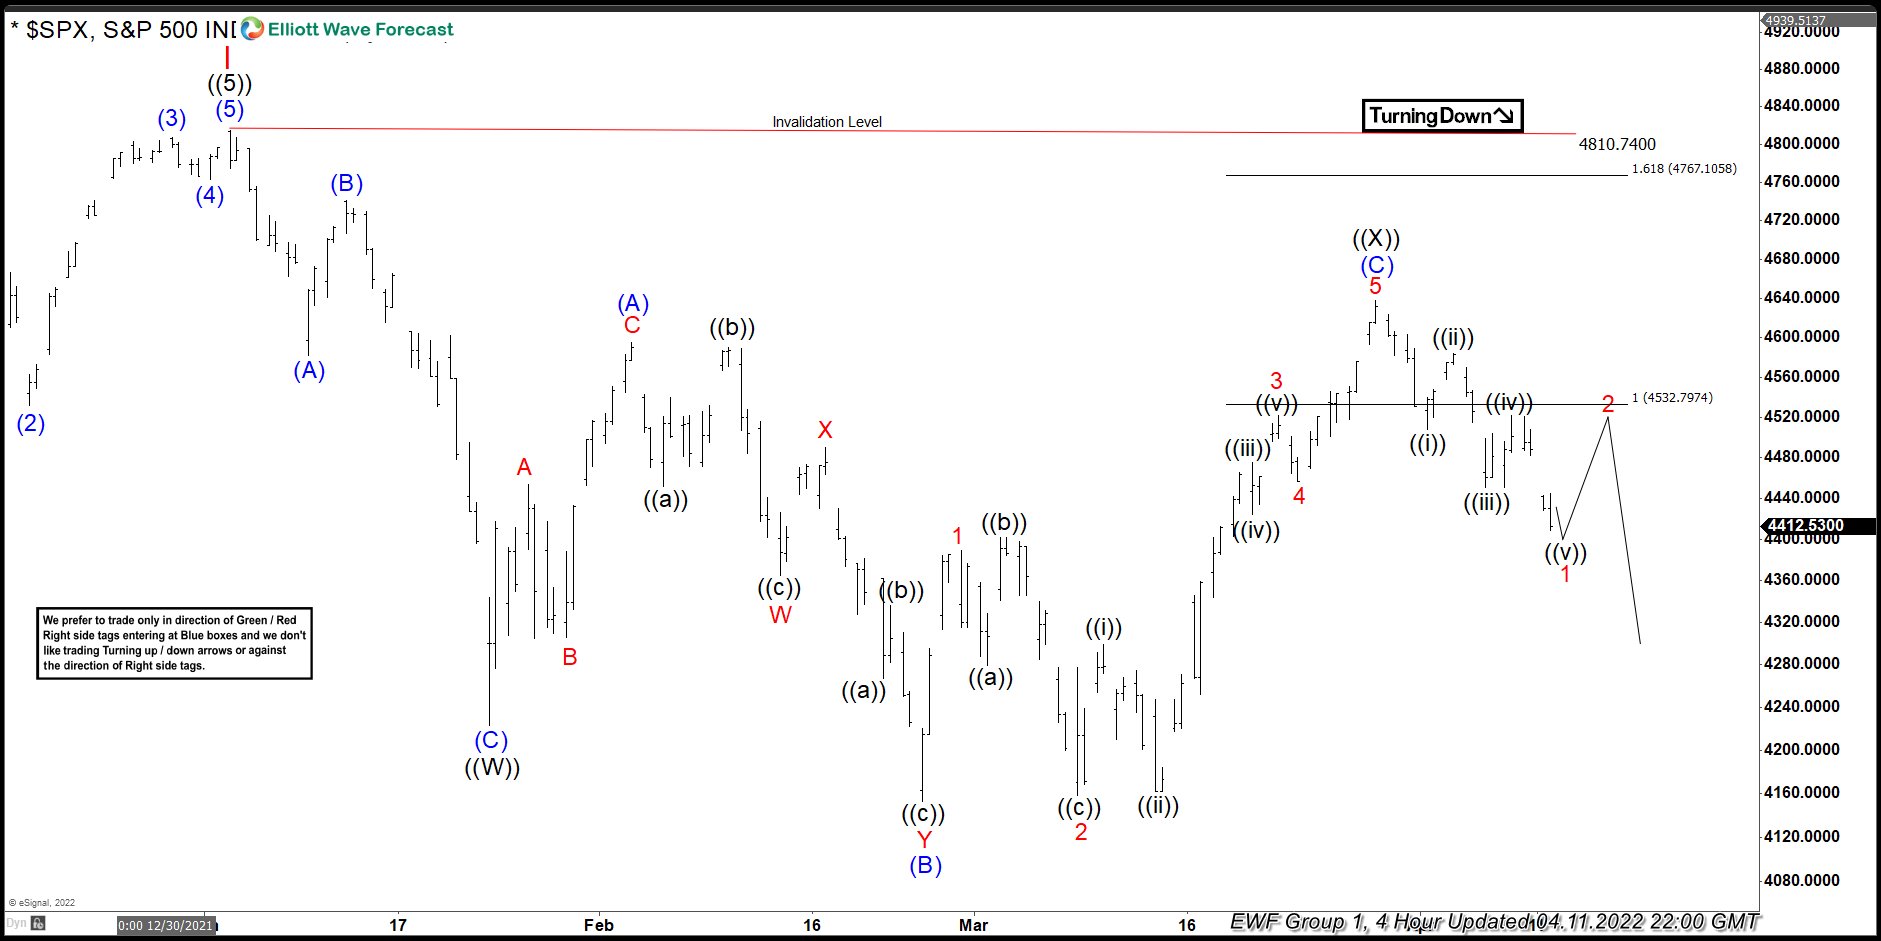
$SPX - 4 hour updates from 4.11.2022 :
Source: https://elliottwave-forecast.com/stock-market/spx-expanded-flat-which-trick-buyers-last-month/
$FXB British Pound ETF; Can it Bounce or Not?
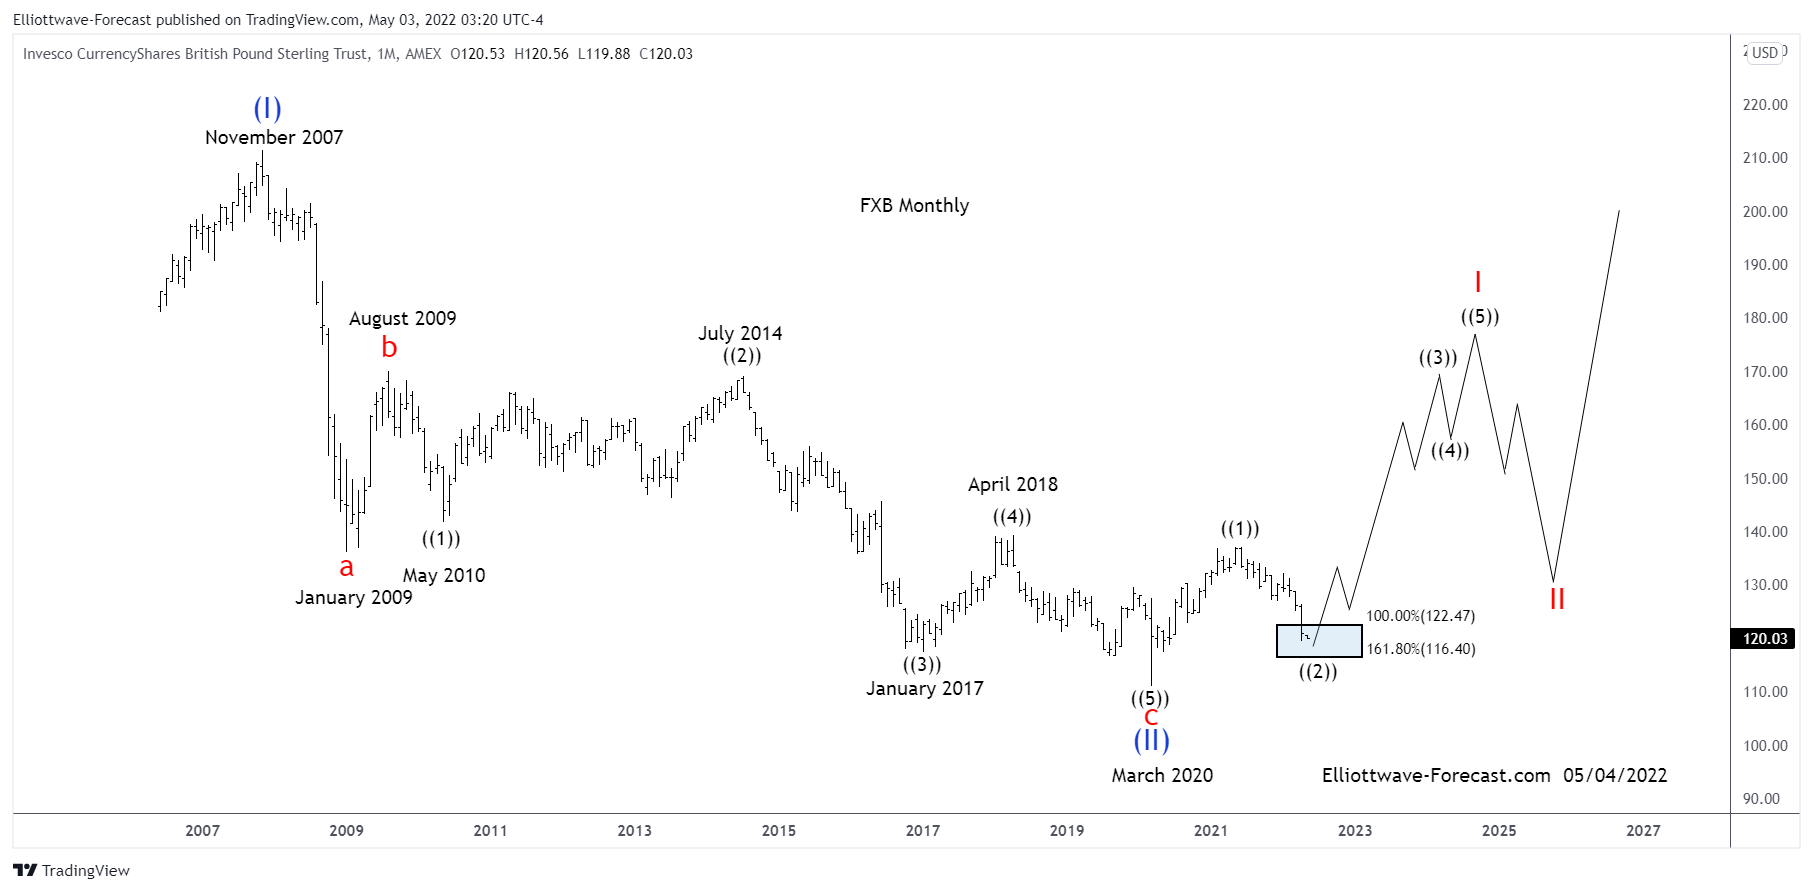
Firstly the British Pound Sterling tracking ETF fund FXB inception date was 6/21/2006. The bearish cycle lower from the November 2007 highs in FXB is favored ended in this analysis. The British Pound Sterling has been the currency of the Bank of England since 1694. Considering that date was back before there was a US Dollar to compare with and data readily available suggests price was at 2.6440 in 1972. Spot price in the GBPUSD foreign exchange was 1.0520 in 1995. Price was at 2.1161 in 2007 where it peaked and turned lower. This is where we will shift the focus to the FXB highs at 211.44 in November 2007.
Secondly the bearish cycle from the November 2007 into the January 2009 lows was clearly an Elliott Wave impulse in 5 waves. From there into the August 2009 highs appeared to be three waves. There into the May 2010 lows appeared best as an impulse wave. From there into the July 2014 highs appeared to be an Elliott Wave flat correction. The analysis continues below the monthly chart.

Thirdly the turn lower from the July 2014 highs appears to be an impulse lower into the January 2017 lows. Price appeared to print a double three into the April 2018 highs. From there it appears another impulse completed in March 2020.
In conclusion : As it appears right now the instrument completed a five wave cycle up from the March 2020 lows in May of 2021. The instrument can end a wave ((2)) pullback in the blue box area highlighted to correct the cycle up from the March 2020 lows. While above there the British Pound can continue a longer term cycle higher against the dollar.
Source: https://elliottwave-forecast.com/stock-market/fxb-british-pound-etf-can-it-bounce-or-not/
Firstly the British Pound Sterling tracking ETF fund FXB inception date was 6/21/2006. The bearish cycle lower from the November 2007 highs in FXB is favored ended in this analysis. The British Pound Sterling has been the currency of the Bank of England since 1694. Considering that date was back before there was a US Dollar to compare with and data readily available suggests price was at 2.6440 in 1972. Spot price in the GBPUSD foreign exchange was 1.0520 in 1995. Price was at 2.1161 in 2007 where it peaked and turned lower. This is where we will shift the focus to the FXB highs at 211.44 in November 2007.
Secondly the bearish cycle from the November 2007 into the January 2009 lows was clearly an Elliott Wave impulse in 5 waves. From there into the August 2009 highs appeared to be three waves. There into the May 2010 lows appeared best as an impulse wave. From there into the July 2014 highs appeared to be an Elliott Wave flat correction. The analysis continues below the monthly chart.
Thirdly the turn lower from the July 2014 highs appears to be an impulse lower into the January 2017 lows. Price appeared to print a double three into the April 2018 highs. From there it appears another impulse completed in March 2020.
In conclusion : As it appears right now the instrument completed a five wave cycle up from the March 2020 lows in May of 2021. The instrument can end a wave ((2)) pullback in the blue box area highlighted to correct the cycle up from the March 2020 lows. While above there the British Pound can continue a longer term cycle higher against the dollar.
Source: https://elliottwave-forecast.com/stock-market/fxb-british-pound-etf-can-it-bounce-or-not/
The last time I covered Chevron was in March 2022. And I was expecting a larger cycle to pull back in ((4)) before resuming higher. Lets take a look at the view I was presenting back then and compare to what the market gave us.

At the time, with the evidence the market was presenting, the wave count was favouring bottom set in ((4)). Black ((5)) was favoured to be underway, and Red III would peak, with a pullback in Red IV Against the March 2020 low. There is something we like to call "the middle zone", where buyers and sellers are deciding direction of the market. While price was below ((3)) and above ((4)), the market was deciding direction. Sometimes an instrument wants to do the double correction. In this case, CVX wasn't quite done with the ((4)). And in fact, it presented a great opportunity for long positions. Lets take a look at the current view.

After peaking in the wave ((3)), the market decided to have a textbook pullack. The blue blue box equal leg area presented itself from 154.83 to 143.65. And when priced dipped into the box, buyers have reacted. Again the market will be deciding if it wants to do further downside, or of the ((4)) low will be respected. Any buyers from the blue box should be taking partial profit at 50% back from the recent connector swing high to get risk free as soon as possible. We do not like to sell it, we prefer to look for pullbacks in 3, 7 or 11 swing to blue boxes where buyers can enter for a bounce in 3 swing at least. if $CVX wants to do more downside, we still like to look for blue boxes further down where buyers will enter for a bounce.
Source: https://elliottwave-forecast.com/stock-market/chevron-cvx-still-powering-higher/
Chevron Elliott Wave view March 2022:

At the time, with the evidence the market was presenting, the wave count was favouring bottom set in ((4)). Black ((5)) was favoured to be underway, and Red III would peak, with a pullback in Red IV Against the March 2020 low. There is something we like to call "the middle zone", where buyers and sellers are deciding direction of the market. While price was below ((3)) and above ((4)), the market was deciding direction. Sometimes an instrument wants to do the double correction. In this case, CVX wasn't quite done with the ((4)). And in fact, it presented a great opportunity for long positions. Lets take a look at the current view.
Chevron Elliott Wave view May 2022:

After peaking in the wave ((3)), the market decided to have a textbook pullack. The blue blue box equal leg area presented itself from 154.83 to 143.65. And when priced dipped into the box, buyers have reacted. Again the market will be deciding if it wants to do further downside, or of the ((4)) low will be respected. Any buyers from the blue box should be taking partial profit at 50% back from the recent connector swing high to get risk free as soon as possible. We do not like to sell it, we prefer to look for pullbacks in 3, 7 or 11 swing to blue boxes where buyers can enter for a bounce in 3 swing at least. if $CVX wants to do more downside, we still like to look for blue boxes further down where buyers will enter for a bounce.
Source: https://elliottwave-forecast.com/stock-market/chevron-cvx-still-powering-higher/
Twitter (TWTR) has been in the news later when the board agreed to sell the company to Elon Musk for $54.20 per share, around 44 billion dollars. The deal has not been completed, and it is pending to the best of our knowledge. We, at Elliottwave-Forecast looked at the symbol's technical side and the future looks promising.

The chart above is the Grand Super Cycle for Twitter. We can see there is a series of higher highs and higher lows. The idea in the Elliott Wave Theory can be in three different scenarios. Follow our view of World Indices, which are explained in the following Seminar https://elliottwave-forecast.com/video-blog/future-advance-series-of-wave-45-or-a-super-rally/. The idea of three waves into new highs makes the symbol bullish and new highs will happen. At this stage, we are labeling a nest into a wave (III) extension, which is a series of (I) (II), I-II. The idea makes II react off a perfect Blue Box area, which is from where the High-Frequency Computers enter the Market. As we always say, we are trading in 2022; consequently, computers are part of the market. The three possible scenarios are either extension in wave I, extension in wave III, or extension in wave V.

The chart above is a representation of the three possible extensions. These show how Twitter fix the criteria in each one of the extension and how the buyers should extend higher to a minimum new high of around $99.00. The Elliott Wave Theory is famous for sequences of five waves, as shown in the following chart:
At this stage, $TWTR is only showing three waves, so more upside should be happening to a minimum of complete five waves within an extended wave I.
Twitter chart shows a nice reaction higher in wave ((1)) and it is correcting now. We should see buyers around the $41.00 area if the market drop into the blue box. A dip into the $41.00-$36.00 area will make the board feel good, but they are misreading the price action. The selling will be a bad deal in a few years ahead and the buying will be fine. As we always say, trade the price action and avoid the news, then good times will be for Twitter buyers.
Source: https://elliottwave-forecast.com/video-blog/twitter-good-timming-buyer-bad-sellers/
Twitter Weekly Chart From May 2nd

The chart above is the Grand Super Cycle for Twitter. We can see there is a series of higher highs and higher lows. The idea in the Elliott Wave Theory can be in three different scenarios. Follow our view of World Indices, which are explained in the following Seminar https://elliottwave-forecast.com/video-blog/future-advance-series-of-wave-45-or-a-super-rally/. The idea of three waves into new highs makes the symbol bullish and new highs will happen. At this stage, we are labeling a nest into a wave (III) extension, which is a series of (I) (II), I-II. The idea makes II react off a perfect Blue Box area, which is from where the High-Frequency Computers enter the Market. As we always say, we are trading in 2022; consequently, computers are part of the market. The three possible scenarios are either extension in wave I, extension in wave III, or extension in wave V.

The chart above is a representation of the three possible extensions. These show how Twitter fix the criteria in each one of the extension and how the buyers should extend higher to a minimum new high of around $99.00. The Elliott Wave Theory is famous for sequences of five waves, as shown in the following chart:

At this stage, $TWTR is only showing three waves, so more upside should be happening to a minimum of complete five waves within an extended wave I.
Twitter 4 hour Chart From May 2nd

Twitter chart shows a nice reaction higher in wave ((1)) and it is correcting now. We should see buyers around the $41.00 area if the market drop into the blue box. A dip into the $41.00-$36.00 area will make the board feel good, but they are misreading the price action. The selling will be a bad deal in a few years ahead and the buying will be fine. As we always say, trade the price action and avoid the news, then good times will be for Twitter buyers.
Source: https://elliottwave-forecast.com/video-blog/twitter-good-timming-buyer-bad-sellers/
USDSGD is another instrument that has given us trading opportunity lately . Break of November 2021 peak made bullish sequence in the cycle from the January 2021 low. The price structure is suggesting further rally within that cycle. We recommended members to avoid selling the pair at this stage while favoring the long side. Recently the pair made clear 3 waves pull back and found buyers at the blue box as we expected. In this technical blog we’re going to take a quick look at the charts of USDSGD published in members area of the website and explain the Elliott Wave structure and trading strategy.
As our members know, Blue Boxes are no enemy areas , giving us 85% chance to get a bounce.
You can learn more about Elliott Wave Patterns at our Free Elliott Wave Educational Web Page.

Keep in mind that market is dynamic and presented view could have changed in the mean time. You can check most recent charts in the membership area of the site. Best instruments to trade are those having incomplete bullish or bearish swings sequences. We put them in Sequence Report and best among them are shown in the Live Trading Room

Elliott Wave Forecast
Source: https://elliottwave-forecast.com/trading/usdsgd-elliott-wave-buying-dips-blue-box/
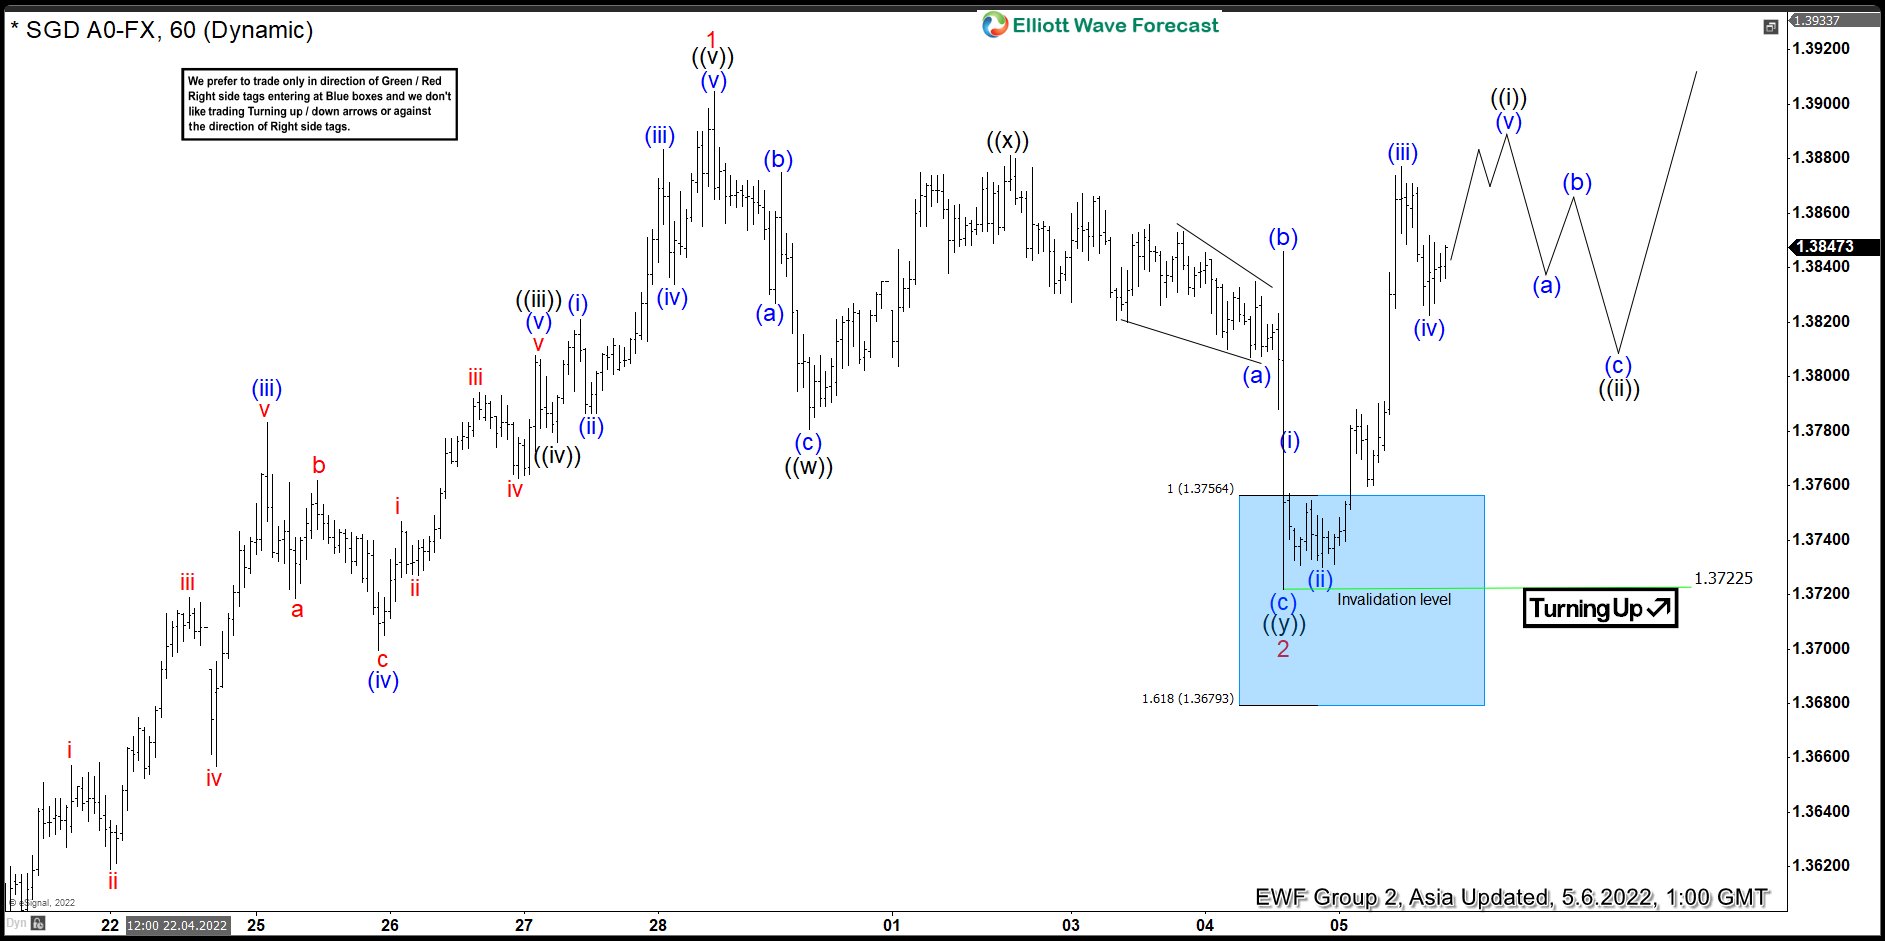
USDSGD Elliott Wave 1 Hour Chart 05.04.2022
Current view suggests USDSGD is doing 4 red pull back against the 1.35965 low. We believe correction can still be in progress. The price is showing incomplete lower low sequences in the short term cycle from ((x)) peak- 05.02 , suggesting more downside toward blue box area : 1.3756-1.3678 . As the main trend is bullish we expect buyers to appear at the blue box for 3 waves bounce at least. Strategy is the same as always, once bounce reaches 50 Fibs against the ((x)) black high, we will make long position risk free ( put SL at BE). Invalidation for the trade would be break of marked invalidation level 1.3678.As our members know, Blue Boxes are no enemy areas , giving us 85% chance to get a bounce.
You can learn more about Elliott Wave Patterns at our Free Elliott Wave Educational Web Page.

USDSGD Elliott Wave 1 Hour Chart 05.06.2022
USDSGD has found buyers at the Blue Box area and we are getting good reaction from there. Pull back made clear 7 swings and completed at 1.37225 low. The rally from the blue box reached and exceeded 50 fibs against the ((x)) connector. Consequently, members who have taken the long trades at the blue box now enjoying profits in a risk free trades. Now we would need to see break of 1 red peak in order to confirm next leg up is in progress. Once the pair breaks above 1 red peak ( 04/28), the pair will become bullish again in near term and might offer some new buying opportunities in the short term dips against the 1.37225 low.Keep in mind that market is dynamic and presented view could have changed in the mean time. You can check most recent charts in the membership area of the site. Best instruments to trade are those having incomplete bullish or bearish swings sequences. We put them in Sequence Report and best among them are shown in the Live Trading Room
Elliott Wave Forecast
Source: https://elliottwave-forecast.com/trading/usdsgd-elliott-wave-buying-dips-blue-box/
UK Brent Oil has been on a bullish trend since the lows of April 2020 - the start of the Covid19 pandemic. Despite the fears of UK Oil dropping in value we witnessed price climbed from 20.00 to 130.00 within the space of two years.
Ever since the highs we have been within a corrective nature in a bearish counter-trend. Nevertheless, we remain bullish on UK Oil from at least 10000 ft high.

We are essentially calling for another push within that corrective cycle of wave ((2)). This would be before seeing a continuation to the upside into wave ((3)) of (II). Wave 2 corrective cycles are more price based corrections. We ideally want to see some form of a deep correction such as Zigzag or a variant of a Zigzag such as a WXY double correction.
Lets have a deeper look at how wave ((2)) is unfolding.

So, this is developing as a double correction which therefore means we have two corrections i.e. ZigZag joined with an (X) connector in the middle. We are calling for another low into 80.00 potentially subject to remaining above 65.74 prior to seeing the next advance into wave ((3)).
As time is going on, we can see that the market sentiment according to our count is that overall there are more appreciation left as opposed to expecting a long term depreciation within the price. UK Oil prices are expected to increase based on the war we have been witnessing between Russia and Ukraine as the United Kingdom decided to slap sanctions on Russia. We can expect further set of sanctions also pushed from the EU by the end of 2022.
Source: https://elliottwave-forecast.com/uncategorized/uk-oil-brent-one-push-prior-advance/
Ever since the highs we have been within a corrective nature in a bearish counter-trend. Nevertheless, we remain bullish on UK Oil from at least 10000 ft high.
UK Oil - Weekly time frame 5th May 2022
We are essentially calling for another push within that corrective cycle of wave ((2)). This would be before seeing a continuation to the upside into wave ((3)) of (II). Wave 2 corrective cycles are more price based corrections. We ideally want to see some form of a deep correction such as Zigzag or a variant of a Zigzag such as a WXY double correction.
Lets have a deeper look at how wave ((2)) is unfolding.
UK Oil - Daily time frame 5th May 2022
So, this is developing as a double correction which therefore means we have two corrections i.e. ZigZag joined with an (X) connector in the middle. We are calling for another low into 80.00 potentially subject to remaining above 65.74 prior to seeing the next advance into wave ((3)).
As time is going on, we can see that the market sentiment according to our count is that overall there are more appreciation left as opposed to expecting a long term depreciation within the price. UK Oil prices are expected to increase based on the war we have been witnessing between Russia and Ukraine as the United Kingdom decided to slap sanctions on Russia. We can expect further set of sanctions also pushed from the EU by the end of 2022.
Source: https://elliottwave-forecast.com/uncategorized/uk-oil-brent-one-push-prior-advance/
Chevron Corporation (CVX) is an American multinational energy company. It is the second largest oil company in the United States and has operation in more than 180 countries. Chevron is involved in the entire spectrum of supply chain within the oil and natural gas industries from exploration, production, refining, marketing, transport, and sales. Due to the war between Russia and Ukraine, the U.S and European countries have tried to reduce dependency on Russia's oil and energy exports. Moreover, the West has pressured and threatened other countries with secondary sanction if they do business with Russia.
This has caused the reduction of supply in the energy market. As a result, energy price such as oil, diesel, and natural gas have spiked higher contributing to the high inflation data. This elevated price may remain here for a longer time as there doesn't seem to be an end in the war anytime soon. Moreover, even when the war ends, sanctions might still be intact and European countries will not go back to their previous relationship with Russia anytime soon. Despite the brutal selloff in high tech sector and general market, energy sector remains one of the bright sides. Below we look at the Elliott Wave outlook of Chevron Corporation.

Monthly Elliott Wave of CVX suggests the rally to $135.1 on July 2014 ended wave ((I)). Pullback in wave ((II)) ended at $51.60 on March 2020 low as a zigzag Elliott Wave structure. The stock has resumed higher in wave ((III)) with internal subdivision as a 5 waves impulse. Expect a few more highs to end wave (I) before it pullback in wave (II) and extends higher again.

Daily Chart of Chevron above suggests rally from wave ((II)) low is nesting as an impulse. Up from wave ((II)), wave I ended at $103.59 and pullback in wave II ended at $65.16. Wave III is currently in progress with internal subdivision as another impulse in lesser degree. Up from wave II, wave ((1)) ended at $113.11 and wave ((2)) ended at $92.86. Wave ((3)) ended at $174.76, and pullback in wave ((4)) ended at $151.36. Expect stock to continue higher within wave ((5)) of III as far as it stays above $151.36.
Source: https://elliottwave-forecast.com/st...ullish-market-despite-general-market-selloff/
This has caused the reduction of supply in the energy market. As a result, energy price such as oil, diesel, and natural gas have spiked higher contributing to the high inflation data. This elevated price may remain here for a longer time as there doesn't seem to be an end in the war anytime soon. Moreover, even when the war ends, sanctions might still be intact and European countries will not go back to their previous relationship with Russia anytime soon. Despite the brutal selloff in high tech sector and general market, energy sector remains one of the bright sides. Below we look at the Elliott Wave outlook of Chevron Corporation.
Chevron Monthly Elliott Wave Chart
Monthly Elliott Wave of CVX suggests the rally to $135.1 on July 2014 ended wave ((I)). Pullback in wave ((II)) ended at $51.60 on March 2020 low as a zigzag Elliott Wave structure. The stock has resumed higher in wave ((III)) with internal subdivision as a 5 waves impulse. Expect a few more highs to end wave (I) before it pullback in wave (II) and extends higher again.
Chevron Daily Elliott Wave Chart
Daily Chart of Chevron above suggests rally from wave ((II)) low is nesting as an impulse. Up from wave ((II)), wave I ended at $103.59 and pullback in wave II ended at $65.16. Wave III is currently in progress with internal subdivision as another impulse in lesser degree. Up from wave II, wave ((1)) ended at $113.11 and wave ((2)) ended at $92.86. Wave ((3)) ended at $174.76, and pullback in wave ((4)) ended at $151.36. Expect stock to continue higher within wave ((5)) of III as far as it stays above $151.36.
Source: https://elliottwave-forecast.com/st...ullish-market-despite-general-market-selloff/
Similar threads
- Replies
- 1
- Views
- 2K
- Replies
- 0
- Views
- 2K
- Replies
- 2
- Views
- 3K