Elliottwave-Forecast

Master Trader
Feb 17, 2017
2,426
9
84
www.elliottwave-forecast.com
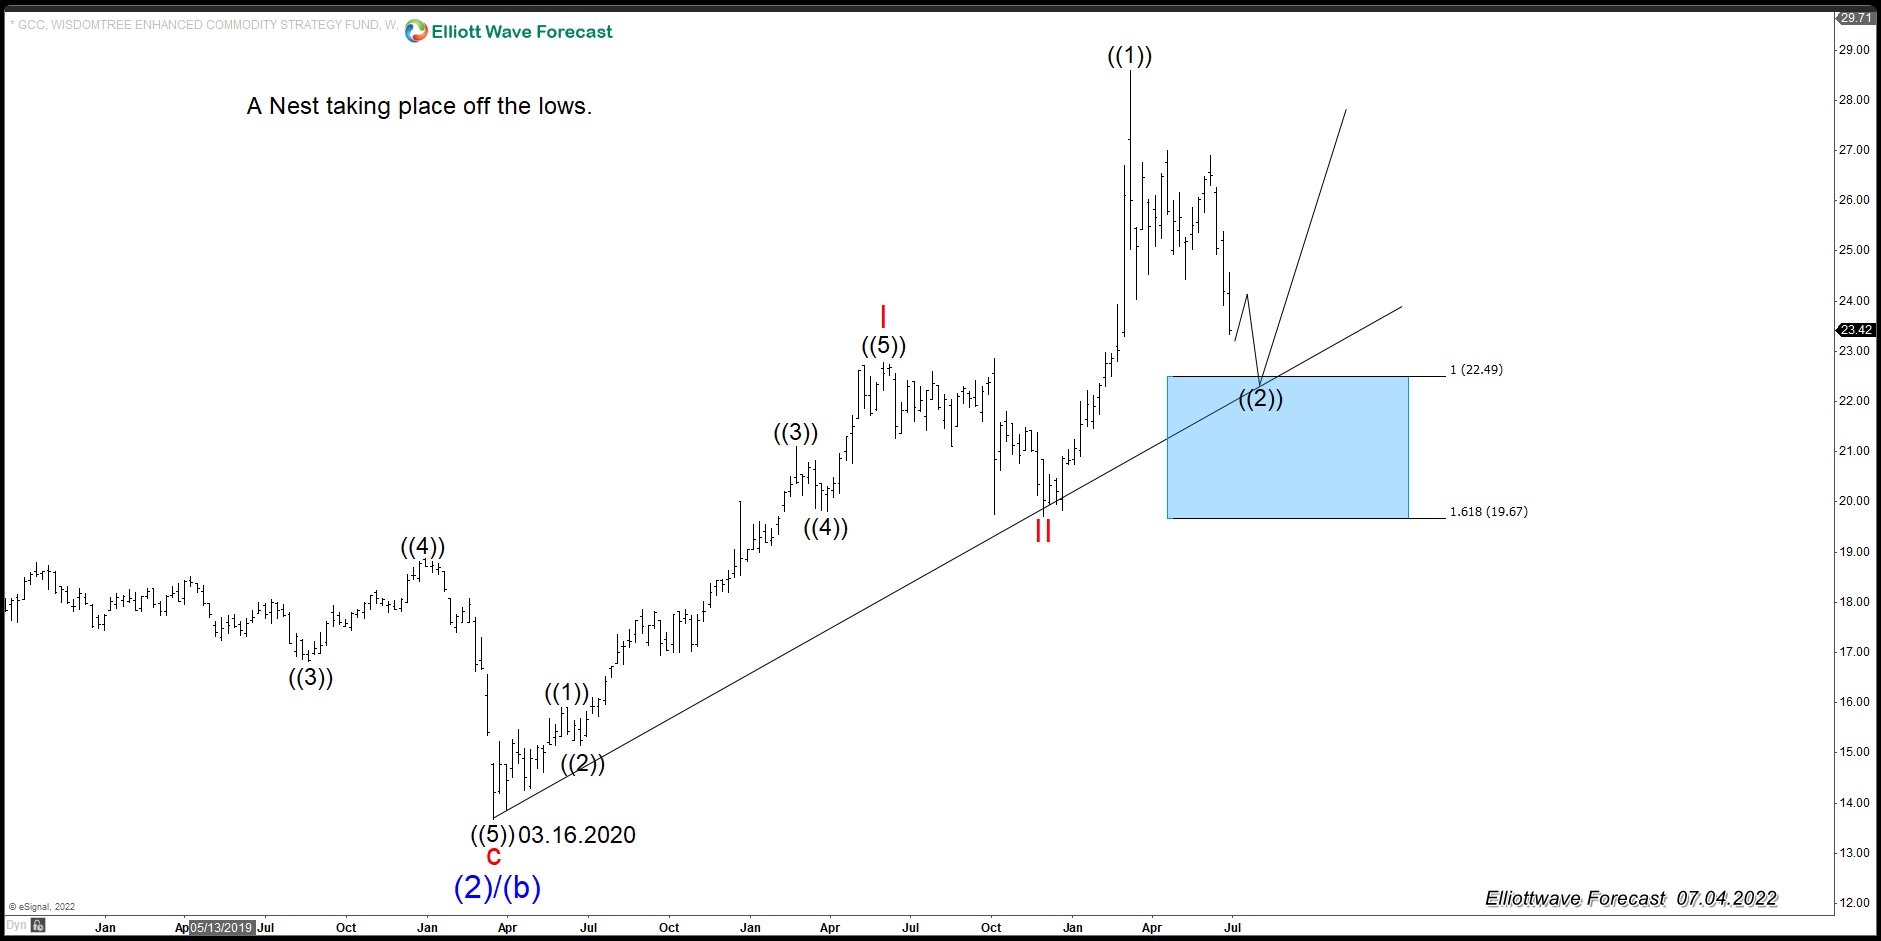
The Swiss Market Index (SMI) is one of the other Capital Markets worldwide that was building a motive wave from the lows of March 2020. That impulse we called wave I and we believe correction as wave II could be done already after reach a blue box in Daily chart.

SMI October 22nd Daily Chart

SMI October Daily Chart

In October last year, the SMI ended wave ((4)) at 11381.74 a little below from our buying area 11844 – 11395. Index bounced nicely and we expected to break wave ((3)) high to reach 12852 - 13312 to complete the impulse from March lows. Then, we look for a pullback to correct the whole cycle in 3 big swings as minimum before continue with the rally.

SMI December 04th Daily Chart

SMI ALT December Daily Chart

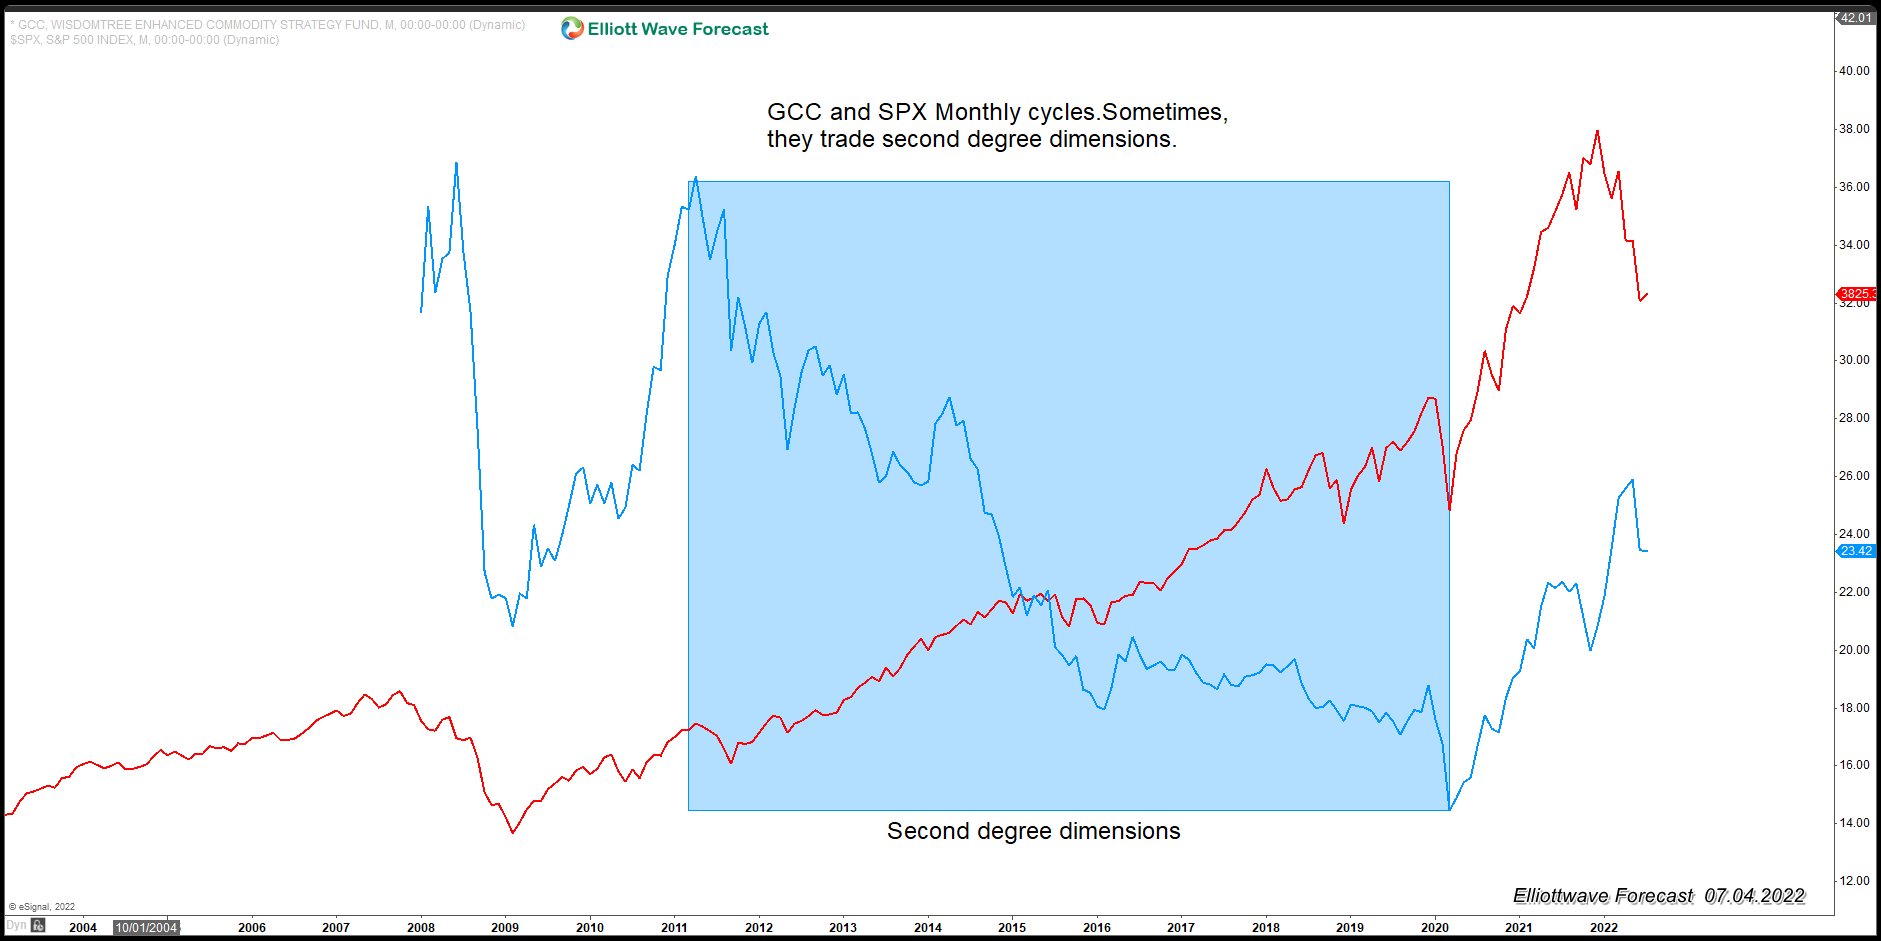
The chart above was an alternative view for SMI. As the index did not reach our minimum target at 12852.67, it was still possible to think in an ending diagonal to complete the cycle. For this we needed 2 more slighly highs to complete the pattern and hit our target. This kind of structures can turn the market very strongly; thus, keep in mind this in your future trades. (If you want to learn more about Elliott Wave Theory, please follow these links: Elliott Wave Education and Elliott Wave Theory).

SMI June 26th Daily Chart

SMI June 26th Daily Chart

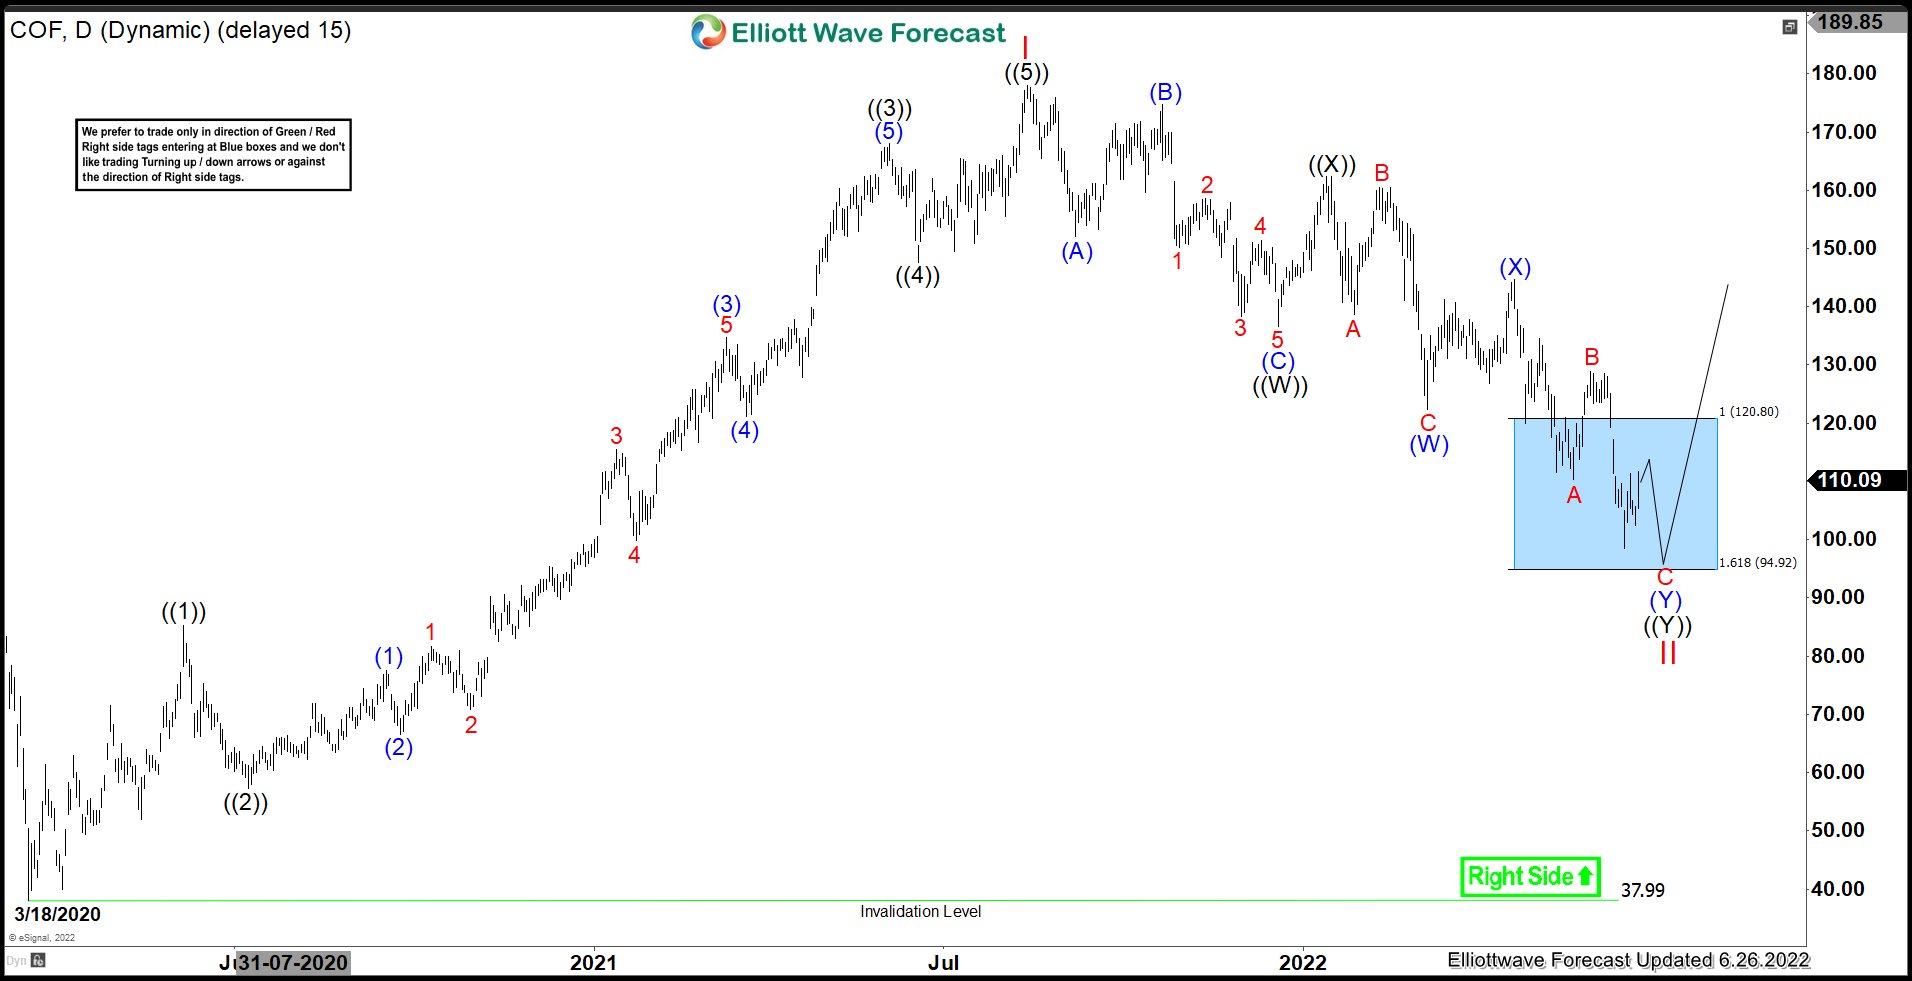
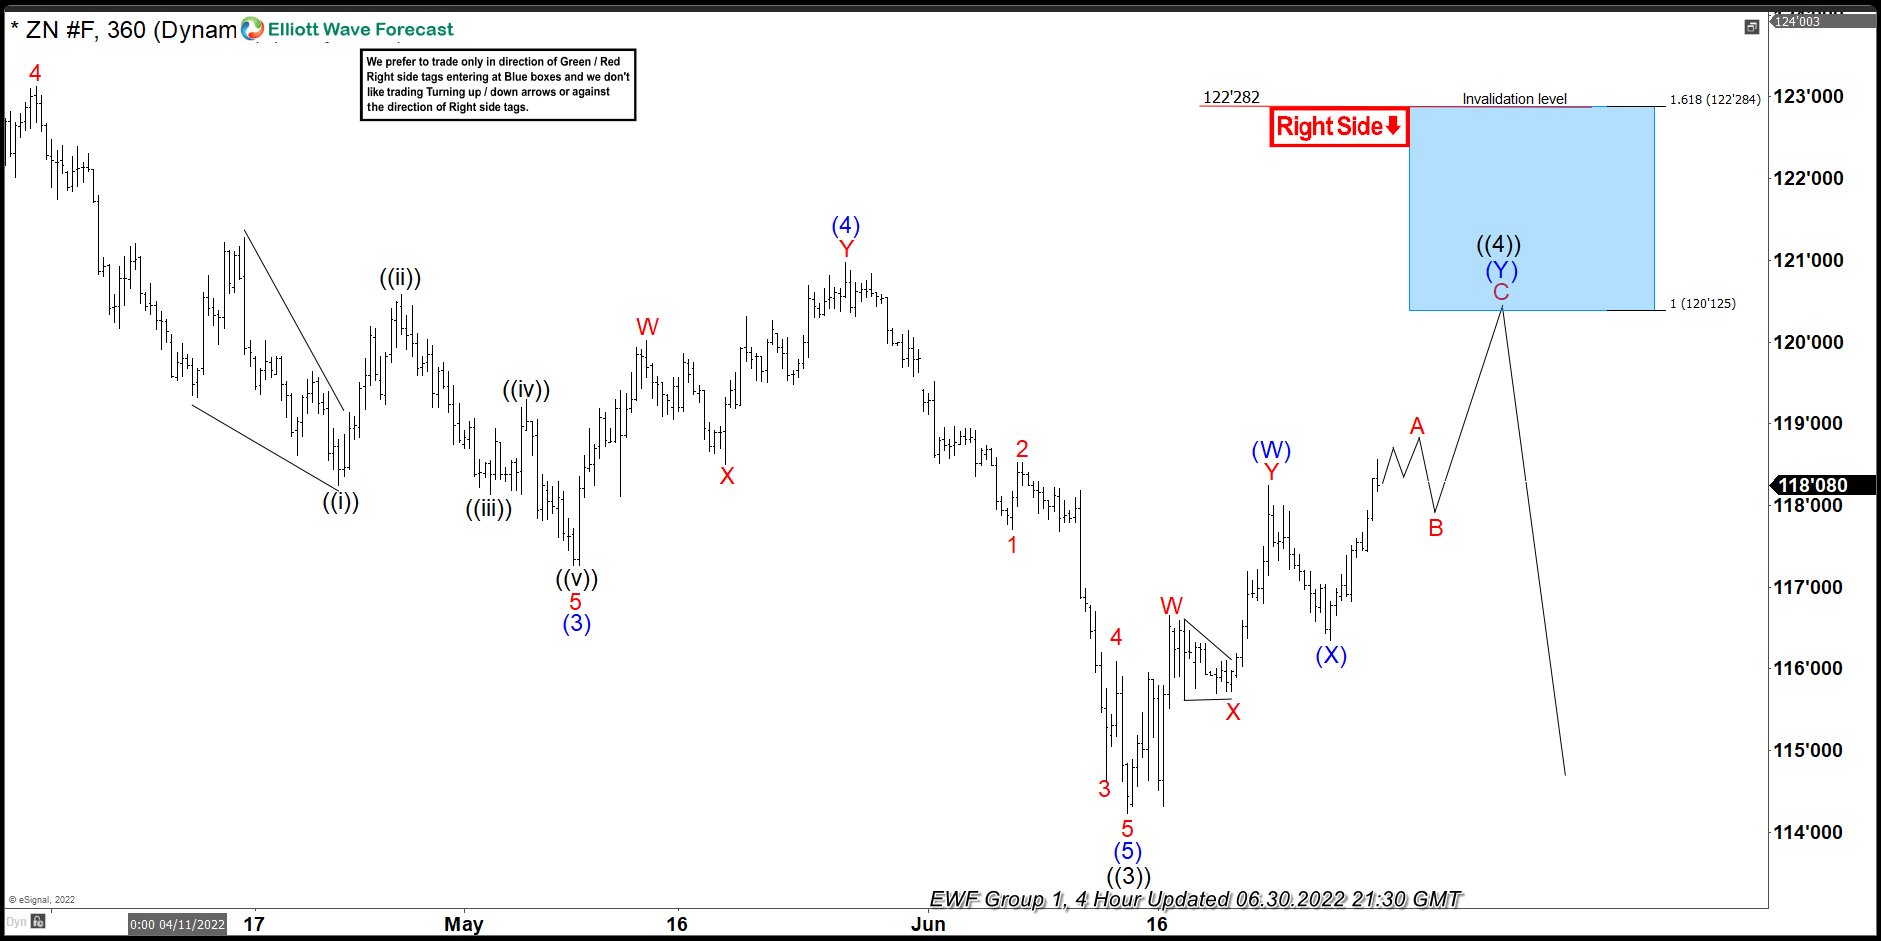
After more than 6 months, we can see SMI index ended wave I at 12997 and wave ((5)) as an ending diagonal structure. From here, market did a double correction structure as wave II. A double correction is a 7 swings structure which one join 2 three waves structures by a connector. For the chart above in this case is wave ((X)). The first group of 3 waves ended at 10823 as wave ((W)) and connector wave ((X)) rally to 12567. Last 3 waves structure ended at 10349 completed ((Y)) and the whole correction as wave II. The market dropped to 100% - 123.6% Fibonacci extension given us the idea that pullback could be over.

SMI June 26th 4 Hour Chart

SMI June 26th 4 Hour Chart

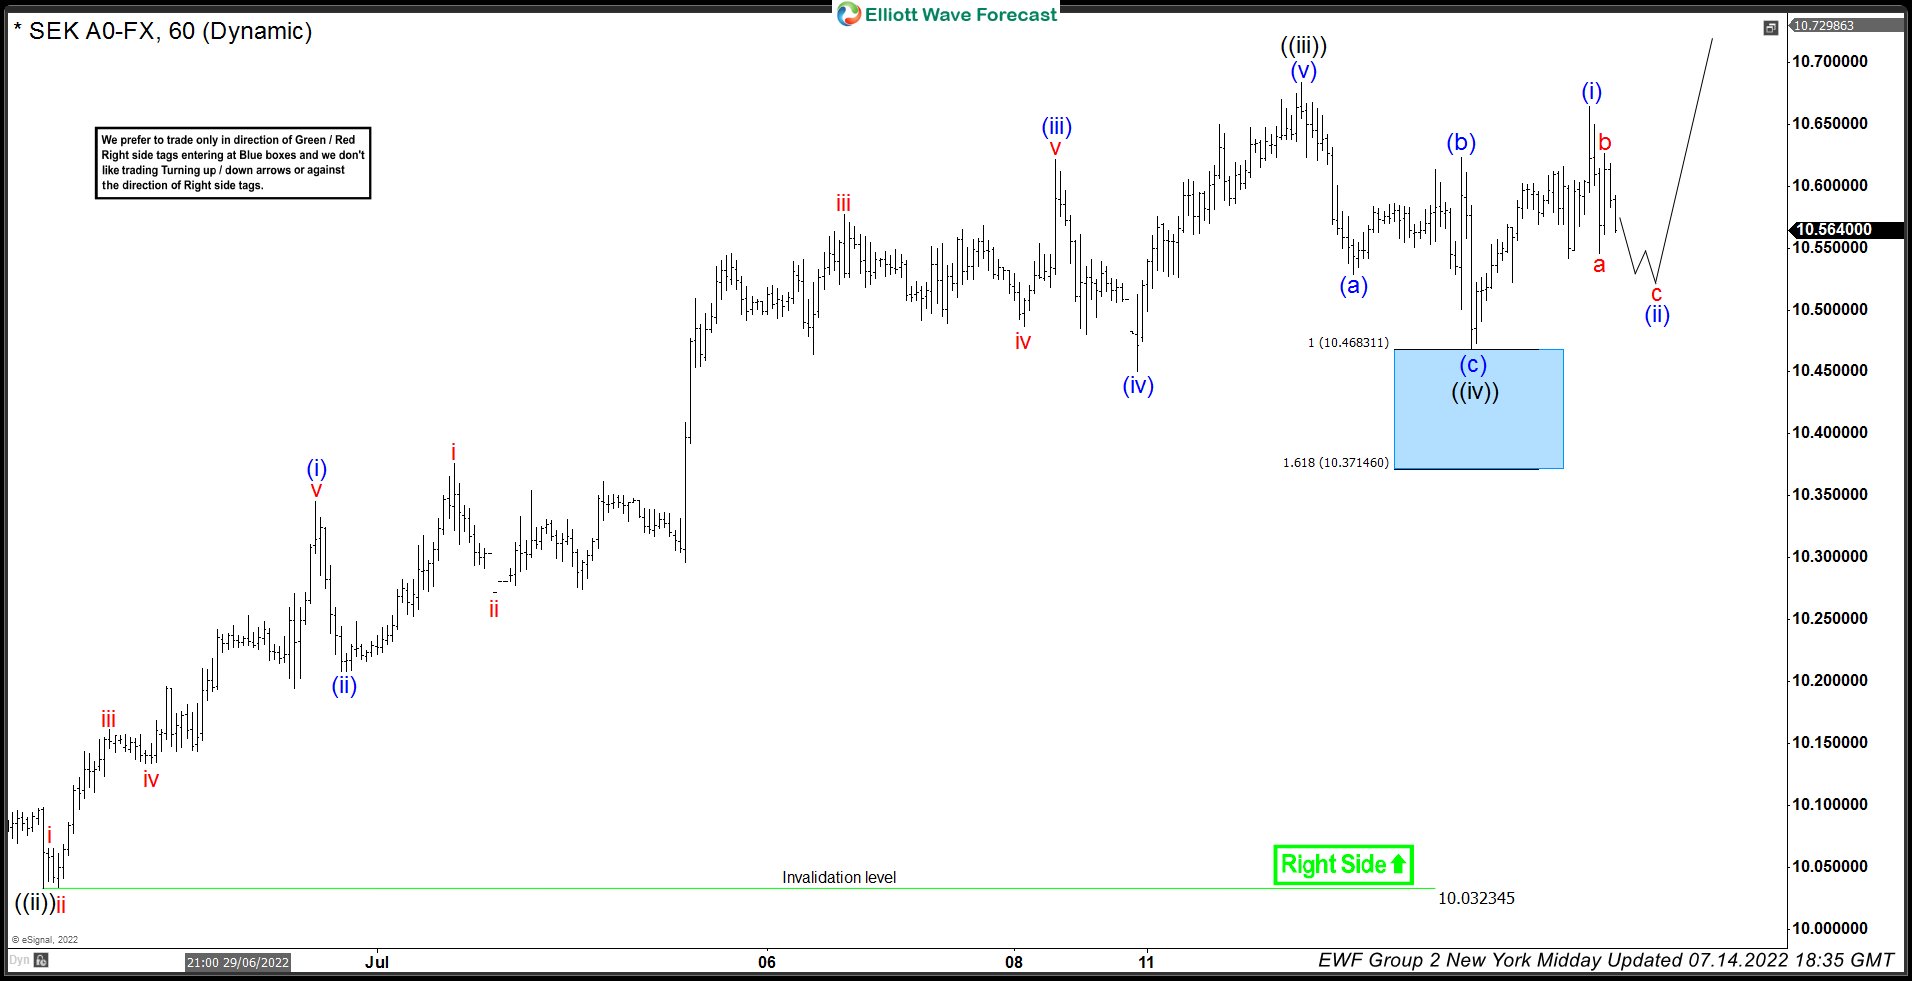
Here in the 4 hour chart, it is clear to watch 3 swings lower from wave ((X)) where wave (A) and (C) are impulses. After reach the blue box in the Daily chart, the market has had a nice reaction higher and this should continue higher until complete wave 1. Then we expect a 3, 7 or 11 swings as pullback to stay above 10349, in that case we could have a nice buying opportunity to continue with the rally in long term.

Source: https://elliottwave-forecast.com/stock-market/bull-market-arrived-swiss-index-smi/
 

Elliottwave-Forecast

Master Trader
Feb 17, 2017
2,426
9
84
www.elliottwave-forecast.com
Capital One Financial Corporation., (COF) operates as the financial services holding company for the Capital One Bank & National Association. Capital One & National Association provides various financial products & services in the US, Canada and UK. It operates through three segments, credit card, consumer banking & commercial banking. It comes under Financial services sector and trades as “COF” ticker at NYSE.

COF made intermediate low of $38.00 on 3/18/2020 during global sell off in early 2020. Later, it made all time high at $177.95 on 8/13/2021 in impulse sequence. Below there, it favors correcting lower in double three in II correction before upside resumes.

COF - Elliott Wave Latest Daily View :​

It placed ((1)) at $85.22 high on 6/05/2022 as diagonal structure. Below there, it favored ended ((2)) at $57.30 low as 0.618 Fibonacci retracement against ((1)). Later, it favors higher in third wave extension of third wave extension & placed ((3)) at $168.00 high. ((4)) was a shallow correction ended at $147.52 low on 6/18/2021. Finally, it favored ended ((5)) at $177.95 on 8/13/2021 as wave I. Below there, it favors lower in II correction in double three structure.

It placed ((W)) at $136.52 low & ((X)) at $162.40 high. Below there, it favors lower in ((Y)) leg as double correction. It placed (X) at 144.73 high & favors (Y) of ((Y)) lower between $120.80 – $94.92 area to finish II correction before upside resumes in III or at least 3 swing larger bounce. We like to buy the dips within blue box area for next leg higher.

Source: https://elliottwave-forecast.com/stock-market/cof-expect-short-term-weakness-before-upside/
 

Elliottwave-Forecast

Master Trader
Feb 17, 2017
2,426
9
84
www.elliottwave-forecast.com
Since bottoming on March 2020 low, Silver Miners ETF (SIL) has continued to extend lower to correct the cycle from March 2020 low. The correction looks to be in the form of a double Below is what a double three structure looks like:

A double three is a 3-3-3 structure, labelled as WXY. The first leg wave W and the third leg Y both subdivide into 3 corrective waves. The subdivision of each leg can be either zigzag, flat or another double three but in lesser degree. We can see the double three correction in the daily chart of Silver Miners ETF (SIL).

SIL Monthly Elliott Wave Chart​

SIL Monthly Elliott Wave

Silver Miners ETF (SIL) Monthly Elliott Wave chart above shows that the ETF is correcting cycle from 3/16/2020 low i wave ((2)) before it resumes higher. Further downside still can be seen in the near term but as far as pivot at 16 low stays intact, expect the ETF to extend higher again soon.

SIL Daily Elliott Wave Chart​


Daily Elliott Wave chart of SIL above suggests wave ((2)) is ongoing as a double three Elliott Wave structure. Down from wave ((1)) peak, wave A ended at 38.89 and rally in wave B ended at 51.35. The ETF then extends lower in wave C towards 34.21 which ended wave (W). Rally in wave (X) ended at 42.08 and the ETF extends lower again in wave (Y). Wave (Y) is unfolding as a double three where wave W ended at 31.54 and wave X rally ended at 40.29. Expect further downside in wave Y with potential target 100% - 123.6% of (W) at 19.1. $23.5. Then as far as pivot at 16 low stays intact, it should extend higher again.

Source: https://elliottwave-forecast.com/stock-market/silver-miners-sil-pullback-nearing-support/
 

Elliottwave-Forecast

Master Trader
Feb 17, 2017
2,426
9
84
www.elliottwave-forecast.com
In this technical blog, we will look at the past performance of 1 hour Elliott Wave Charts of XME ETF. In which, the decline from 08 June 2022 high unfolded as an impulse sequence and showed a lower low sequence within the cycle from the April peak. Therefore, we knew that the structure in XME is incomplete to the downside & should see more weakness. So, we advised members to sell the bounces in 3, 7, or 11 swings at the blue box areas. We will explain the structure & forecast below:

XME 1 Hour Elliott Wave Chart​

XME Reacting Strongly From The Blue Box Area

Here’s 1hr Elliott wave Chart from the 6/28/2022 Pre-Market update. In which, the decline to $42.32 low ended 5 waves from 6/08/2022 high in wave ((1)) & made a bounce in wave ((2)). The internals of that bounce unfolded as an Elliott wave zigzag correction where wave (A) ended at $46.60 high. Then a pullback to $42.76 low ended wave (B) pullback and started the (C) leg higher towards $47.04- $49.70 blue box area from where sellers were expected to appear looking for more downside or for a 3 wave reaction lower at least.

XME Latest 1hr Elliott Wave Chart​

XME Reacting Strongly From The Blue Box Area

This is the 1hr view from the 6/29/2022 Midday update. In which the ETF is showing a reaction lower taking place from the blue box area allowing shorts to get into a risk-free position shortly after taking the position. However, a break below $46.60 low is still needed to confirm the next extension lower & avoid double correction higher.

Source: https://elliottwave-forecast.com/stock-market/xme-reacting-strongly-blue-box-area/
 

Elliottwave-Forecast

Master Trader
Feb 17, 2017
2,426
9
84
www.elliottwave-forecast.com
Moët Hennessy Louis Vuitton, commonly known as LVMH, is a French multinational luxury goods company. Headquartered in Paris, LMVH was formed 1987 through a merger of the fashion house Louis Vuitton (founded in 1854) with Moët Hennessy (established in 1971). The company controls and manages 75 prestigious brands under the umbrellas of 6 branches: Perfumes and Cosmetics, Wine and Spirits, Watches and Jewelry, Fashion Group, Selective Distribution, and Other Activities. LVMH is a part of CAC40 index. Investors can trade it under the ticker $MC at Euronext Paris and under $LVMHF in US in form of ADRs.

From the first days on the stock exchange, $MC title is in a permanent growth. From the fundamental point of view, this behavior may demonstrate a steady need of luxury goods in the society. Even though the wealth in the world is unequally distributed, however, the growing demand in luxury products is obviously present. The latter should be rising even stronger in the coming years. This development should advance, without any doubt, the luxury giant LVMH to new highs.

In the initial article from October 2020, we have forecasted the break of January 2020 high to take place. We were right. $MC has not only broken 439.05 highs, but the stock price has printed an all-time high in January 2022 at 758.50. Here, we provide an update and outlook.

LVMH Monthly Elliott Wave Analysis 06.29.2022​

The monthly chart below shows the LVMH stock $MC listed at Euronext. From the all-time lows, first, the stock price has developed a cycle higher in wave (I) of a super cycle degree. It has ended in August 2000 at 98.70. From the top, a correction lower in wave (II) has unfolded as an Elliott Wave zigzag pattern. It has printed a bottom on September 2001 at 28.40.

From the September 2001 lows, LVMH has broken to new highs and is still within a strong rally. This rise shows an extension of more than 4.236 multiples in relation to the length of the wave (I). Without any doubt, one can qualify the cycle higher as the blue wave (III). From 2001 lows, it shows 7 swings higher. Currently, the 8th swing in red wave IV is unfolding as a double three structure. Once finished, the 9th swing within wave V should end the impulse in wave (III).

Indeed, motive sequences develop in 5 – 9 – 13 – 17 – … (5+4 x n) swings. Therefore, one should expect a new high above 758.50 which will provide the 9th swing from September 2001 lows. On the one hand, a new high and 9 swings may accomplish the 2001 cycle higher in blue wave (III). On the other hand, they dont have to. As mentionned above, 13, 17 and more swings within cycle in wave (III) are also possible.

LVMH Elliott Wave Monthly

LVMH Daily Elliott Wave Analysis 06.29.2022​

The daily chart below shows in more detail the 8th swing lower. From the all-time highs in January 2022 at 758.50, the pullback in red wave IV is unfolding as a double-three correction. First, 3 swings of black wave ((W)) have bottommed in March 2022 at 543.90. Then, a bounce in wave ((X)) has printed a connector at 675.20. Later, a new low below 543.90 has opened a bearish sequence. Therefore, more downside within black wave ((Y)) should take place. Currently, wave (C) of ((Y)) is in progress.

Investors and traders should be looking to buy LVMH in a pullback from 460.23-327.43 area targeting towards 828.89 and possibly higher.

LVMH Elliott Wave Daily

Source: https://elliottwave-forecast.com/stock-market/luxury-lvmh-opportunity-rally/
 

Elliottwave-Forecast

Master Trader
Feb 17, 2017
2,426
9
84
www.elliottwave-forecast.com
Hello fellow traders. USDCAD has given us another trading opportunity recently. As our members know, we’ve been favoring the long side in USDCAD and buying the dips in 3,7,11 swings. Reason for expecting further rally is incomplete bullish structure the pair is showing in the weekly cycle from the 05.30. low . In this technical blog we’re going to take a quick look at the Elliott Wave charts of USDCAD, published in members area of the website.

USDCAD Elliott Wave 1 Hour Chart 06.28.2022​

USDCAD ended 5 waves up in the cycle from the 1.2515 low as wave ((i)) black . Currently we are getting wave ((ii)) black pull back. Correction is unfolding as Elliott Wave Double Three pattern. First leg of the pull back looks like 3 waves structure,then we got 3 waves bounce (x) and now looking for another leg down to have 3 waves in (y) blue leg as well. .
We don’t recommend selling the pair against the main bullish trend. Strategy is buying the dips at the marked blue box zone : 1.28401-1.2729 once it gets reached. As the main trend is bullish we expect buyers to appear at the blue box for 3 waves bounce at least. Once bounce reaches 50 Fibs against the (x) blue high, we will make long position risk free ( put SL at BE).

As our members know, Blue Boxes are no enemy areas , giving us 85% chance to get a bounce.

You can learn more about Elliott Wave Double Three Pattern at our Free Elliott Wave Educational Web Page.

USDCAD

USDCAD Elliott Wave 1 Hour Chart 06.30.2022​

Buyers appeared at the Blue Box area and we are getting reaction from there. The rally from the blue box already reached and exceeded 50 fibs against the (x) connector so,we booked partial profits and made trades risk free ( put SL at BE). Pull back ((ii)) is counted completed at 1.2816 low as Elliott Wave Double Three pattern. Now we need to see break of June 17th peak to confirm next leg up is in progress.

Keep in mind that market is dynamic and presented view could have changed in the mean time. You can check most recent charts in the membership area of the site. Best instruments to trade are those having incomplete bullish or bearish swings sequences. We put them in Sequence Report and best among them are shown in the Live Trading Room

USDCAD

Elliott Wave Forecast
Source: https://elliottwave-forecast.com/forex/usdcad-showing-reaction-blue-box/
 

Elliottwave-Forecast

Master Trader
Feb 17, 2017
2,426
9
84
www.elliottwave-forecast.com
Hello fellow traders. In this technical blog we’re going to take a quick look at the Elliott Wave charts of EURAUD, published in members area of the website. As our members know, we’ve been favoring the long side in EURAUD due to incomplete bullish structure the pair is showing in the cycle from the April 5th low. Consequently, we recommended members to avoid selling the pair, while keep favoring the long side. Recently the pair made a short term pull back that has given us good trading opportunities. In the further text we are going to explain the Elliott Wave Forecast and trading strategy.

EURAUD Elliott Wave 1 Hour Chart 06.30.2022​

Short term cycle from the 1.4857 ended as 5 waves structure - ((i)) black. Currently the pair is giving us correction that is unfolding as Elliott Wave Double Three Pattern. Wave ((ii)) Pull back looks incomplete at the moment. We expect to see another leg down toward 1.51269-1.50088 area ( Blue Box – buying zone) .We don’t recommend selling the pair against the main bullish trend. Strategy is waiting for the price to reached marked blue box zone, before entering the long trades. As the main trend is bullish we expect buyers to appear at the blue box for 3 waves bounce at least. Once bounce reaches 50 Fibs against the (x) blue high, we will make long position risk free ( put SL at BE). Invalidation for the trade would be break of marked invalidation level 1.50088.

As our members know, Blue Boxes are no enemy areas , giving us 85% chance to get a bounce.

You can learn more about Elliott Wave Double Three Patterns at our Free Elliott Wave Educational Web Page.

EURAUD

EURAUD Elliott Wave 1 Hour Asia Chart 07.01.2022​

EURAUD made leg down as expected. The pair found buyers at the Blue Box area and we are getting good reaction from there. We see Pull back completed at 1.50568 low. The rally from the blue box already reached 50 fibs against the (x) connector. Consequently, we made long trades risk free (put SL at BE). Now we need to see break of 06/23 peak to confirm next leg up is in progress.

EURAUD

EURAUD Elliott Wave 1 Hour London Chart 07.01.2022​

The pair resumed trading higher and broke 06/23 peak as we expected. EURAUD should ideally remain bullish against the 1.50568 low and resume trading higher toward 1.593 area ideally.

Keep in mind that market is dynamic and presented view could have changed in the mean time. You can check most recent charts in the membership area of the site. Best instruments to trade are those having incomplete bullish or bearish swings sequences. We put them in Sequence Report and best among them are shown in the Live Trading Room

EURAUDElliott Wave Forecast

Source: https://elliottwave-forecast.com/trading/euraud-buying-dips-blue-box/
 

Elliottwave-Forecast

Master Trader
Feb 17, 2017
2,426
9
84
www.elliottwave-forecast.com
The S&P/TSX is a major stock market index which tracks the performance of largest companies by market capitalization on the Toronto Stock Exchange in Canada. It is a free float market capitalization weighted index. The index covers approximately 95 percent of the Canadian equities market. The S&P/Toronto Stock Exchange Composite Index has a base value of CAD1000 as of January 1, 1975.

TSX Daily Chart July 1rt 2022​

TSX Daily Chart July 1rt 2022

The Canadian TSX index ended an impulse from the March 2020 lows and It is correcting this cycle. The pullback has taken the form of a double correction. This means that the market must make 7 swings to complete the whole structure. (If you want to learn more about Elliott Wave Theory, please follow these links: Elliott Wave Education and Elliott Wave Theory).

From 22219 peak, TSX index fell forming an impulse ending wave (A) at 20453. Wave (B) bounced back and ended at 21223. Then we had another push down to complete wave (C) and the first 3 swings as ((W)) at 19471. The fourth swing or connector wave ((X)) rallied in 3 waves ending at 21046.

From wave ((X)) we need 3 more swings to complete the double correction. We had another impulsive structure as wave (A) ending at 18657. Then a short bounce as wave (B) ending at 19497 and continued down.

Currently, we are in the last swing to complete the double correction. We expect to build an impulse or ending diagonal to complete the structure. The ideal zone to end the cycle is given in 18306 – 17129 area. From here, we expect to continue with the rally that breaks 22219 peak or see 3 swings upwards at least.

Source: https://elliottwave-forecast.com/stock-market/index-tsx-double-correction/
 

Elliottwave-Forecast

Master Trader
Feb 17, 2017
2,426
9
84
www.elliottwave-forecast.com
Eastman Chemical Company (EMN) operates as specialty materials company globally. It serves transportation, personal care, wellness, food, feed, agriculture, building & construction, water treatment, energy, consumables, durables & electronic markets. It is based in Kingsport, Tennessee, US, comes under Basic Materials sector & trades as “EMN” ticker at NYSE.

EMN favors a flat correction since 6/01/2021 high & yet favors further weakness for one more low before, it should resume next leg higher or bounce for a larger 3 swing reaction from the blue box area.

EMN - Elliott Wave Latest Daily View :​

It started impulse sequence from 3/18/2020 low & placed ((1)) at $64.19 on 5/01/2020. Below there, it favored ended ((2)) at $57.30 low as 0.236 Fibonacci retracement against ((1)). Then, it placed ((3)) at $119.01 high on 3/11/2021 as third wave extension. It finished ((4)) correction at $106.11 low on 3/23/2021 as 0.236 retracement. Finally, it favored ended ((5)) at $130.47 high on 6/01/2021 as I red impulse. Below there, it favors II flat correction against March-2020 low.

Below $130.47 high, it placed ((A)) at $98.24 low & proposed ended ((B)) at $129.47 high on 1/19/2022. It placed (4) of ((C)) at $93.87 high. Currently, it favors (5) as final leg to finish the correction within $97.20 – $77.20 area before turning higher in the next leg up. It needs to breaks (3) low to confirm the sequence down.

Source: https://elliottwave-forecast.com/stock-market/emn-favors-flat-correction-before-higher/
 

Elliottwave-Forecast

Master Trader
Feb 17, 2017
2,426
9
84
www.elliottwave-forecast.com
Nutrien Ltd., (NTR) provides crop inputs & services. It offers potash, nitrogen, phosphate & sulphate products, & financial solutions. The company also distribute through approximately 2000 retails locations in US, Canada, South America & Australia. It is based in Canada, comes under Basic Materials sector & trades as “NTR” ticker at NYSE.

NTR started impulse from March-2020 low & ended at $117.25 high & currently, pulling back in II zigzag correction towards $86.44 - $73.24 area before upside resumes.

NTR - Elliott Wave Latest Daily View :​

It placed ((1)) at $37.22 high on 4/09/2020 & ((2)) at $29.70 low. ((2)) was around 0.618 Fibonacci retracement against ((1)). While above there, it started third wave extension. It ended ((3)) at $73.50 high on 11/02/2021. ((4)) was shallow correction & favored ended at $65.84 low on 11/30/2021. Finally, it ended ((5)) at $117.25 high on 4/18/2022. While below there, it favors lower in II correction.

Below $117.25 high, it placed ((A)) at $96.01 low & ((B)) at $107.82 on 5/05/2022. Currently, it favors (5) of ((C)) leg between $86.44 - $73.24 area before it resumes next leg higher or at least 3 swing larger bounce. We like to buy the pullback from blue box area for further upside. Alternatively, it can extend lower as impulse sequence in ((A)) leg with few more lows & later expect a bounce of ((B)) leg in larger zigzag correction in II or as double correction.

Source: https://elliottwave-forecast.com/stock-market/ntr-favors-short-term-weakness-turning-higher/
 

Elliottwave-Forecast

Master Trader
Feb 17, 2017
2,426
9
84
www.elliottwave-forecast.com
In this technical blog we’re going to take a quick look at the Elliott Wave charts of EURNZD published in members area of the website. As our members knew, we’ve been favoring the long side in EURNZD since it broke above May 12, 2022 high. Break of May 12, 2022 high created an incomplete bullish sequence in the pair up from April 5, 2022 low against June 3, 2022 low. EURNZD cycle from June 3, 2022 low ended at June 29, 2022 peak and it started pulling back. This pull back took the form of Elliott Wave Zig Zag pattern and members knew it was nothing more than another buying opportunity. In the remainder of the article, we are going to explain the Elliott Wave Pattern and talk about the blue box buying area.

Before we take a look at the real market example, let’s explain Elliott Wave Zigzag.

Elliott Wave Zigzag is the most popular corrective pattern in Elliott Wave theory . It’s made of 3 swings and is sub-divided as 5-3-5. Inner swings are labeled as A,B,C where A =5 waves, B=3 waves and C=5 waves. That means A and C can be either impulsive waves or diagonals. (Leading Diagonal in case of wave A or Ending in case of wave C) . Waves A and C must meet all conditions of being 5 wave structure, such as: having RSI divergence between wave subdivisions, ideal Fibonacci extensions and ideal retracements etc. Wave B could be a triangle, FLAT, Zigzag or a double three structure.

Zigzag Elliott Wave Structure for NZDJPY Blog


EURNZD 30 June, 2022 1 Hour Elliott Wave Update​

Current view suggests EURNZD is doing black pull back against the June 3, 2022 (1.6348) low. First leg from the peak was in 5 waves which has been labelled as wave A. Bounce was corrective and completed wave B. We have already seen a new low below wave A which makes it an incomplete sequence against June 30, 2022 peak. Current view suggests C leg is in progress toward 1.6672 - 1.6564 area (highlighted with a blue box).

We don’t recommend selling the pair against the main bullish trend. Strategy is waiting for the price to reached marked blue box zone, before buying the pair again. As the main trend is bullish we expect buyers to appear at the blue box for 3 waves bounce at least. Once bounce reaches 50 Fibs against red B high, we will make long position risk free by either moving stop loss to entry position or taking partial profits and putting stop on remaining position below the low within the blue box. Invalidation for the trade would be break of marked invalidation level at 1.6564. As our members know, Blue Boxes are no enemy areas , giving us around 80% or a higher chance to get 3 waves bounce at least from the blue box.

EURNZD 30 June 1 Hour Elliott Wave Analysis

EURNZD 01 July, 2022 1 Hour Elliott Wave Update​

Chart below shows EURNZD made proposed leg down as we expected. The pair has found buyers at the Blue Box area and we are getting good reaction from there. Pull back completed at1.6662 low as a Zig Zag pattern. The rally from the blue box has already made a new high above June 29, 2022 low. Consequently, members who have taken the long trades at the blue box now enjoying profits in a risk free trades. As dips hold above 1.6662 low, expect the pair to continue higher and resume the rally.

EURNZD 1 July 1 Hour Elliott Wave Analysis

EURNZD 04 July, 2022 1 Hour Elliott Wave Update​

Chart below shows pair completed 5 waves up from 1.6662 low and pulled back in 3 waves. Pull back has held above 1.6662 low and now pair has scope to continue higher in wave 3. In case of a break below the recent low at 1.6706, wave (1) could be moved to July 1, 2022 peak (1.6967), 1.6706 low would become wave W and the bounce from 1.6706 low will become wave X. New low below 1.6706 should be part of wave Y of (2) and we should see buyers entering the market again at 100 - 161.8 Fibonacci extension area of W-X cycles. We will show the area with a blue box if market follows this path.

Keep in mind that market is dynamic and presented view could have changed in the mean time. You can check most recent charts in the membership area of the site.

EURNZD 4 July 1 Hour Elliott Wave Update

Source: https://elliottwave-forecast.com/forex/eurnzd-buying-dips-blue-box-area/
 

Elliottwave-Forecast

Master Trader
Feb 17, 2017
2,426
9
84
www.elliottwave-forecast.com
The Fed's aggressive rate hikes to fight inflation has caused deterioration in economic outlook. Atlanta Fed's GDP gauge now sees the second quarter running at - 2.1%. With the first quarter's decline of 1.6%, this makes it two quarters in a row with negative GDP. This fits with the technical definition of a recession. As a result of the aggressive rate hikes, all risk assets including stock, commodities, and cryptos have been hit really hard while US Dollar has rallied very strongly. In today's update, we will look specifically at Platinum to see a possible support area.

Platinum Monthly Elliott Wave Chart​


Monthly Elliott Wave in Platinum above suggests that the metal has ended Grand Super Cycle wave ((II)) pullback at $562. This ended the multi-decade correction to the cycle from January 1992. From there, Platinum has started a new bullish leg higher in wave ((III)). Up from wave ((II)), wave (I) ended at $1348.2. Wave ((II)) pullback is now in progress to correct cycle from 3/16/2020 low before the next leg higher. Let's look at the daily chart below to get better look of the potential support area.

Platinum Daily Elliott Wave Chart​


Daily Elliott Wave chart of Platinum above shows the potential support area for wave (II). The pullback is unfolding as a zigzag Elliott Wave structure. Down from wave (I), wave a ended at $886, and wave b ended at $1197. Wave c target can be measured as 100% - 123.6% Fibonacci extension of wave a which comes at $631 - $739 area. This area should see buyers for the next leg higher and give a good buying opportunity.

Source: https://elliottwave-forecast.com/commodities/platinum-support-area/
 

Elliottwave-Forecast

Master Trader
Feb 17, 2017
2,426
9
84
www.elliottwave-forecast.com
GCC (Wisdom Tree Commodity Strategy Fund) is a great indicator for commodities direction. This Fund is positively correlated with Oil. Previously, we have mentioned the idea that the Fund reached the blue box area back in 03.2020. Since then, it has started a rally which looks like a nest. A nest is a series of 1-2. Most of the time a nest happens before a huge move takes place. The following chart shows what a nest looks like:


As we can see in the graph above, a nest is a series of 1-2 coming off from the lows. A nest happens within one of the three main impulses. It either happens within waves 1, 3, or 5. Most of the time it happens within wave 3 like the second graph above shows. This often confuses traders because they see a three wave rally from the low. Due to the 3 waves rally, traders mistakenly believe the previous bearish cycle trend remains in place. But of course that turns out not to be the case when a nest takes place.

GCC Monthly Elliott Wave Chart​


The monthly chart of GCC above shows a three waves pullback since the peak in 2008 into the blue box buying area. Based on the Elliott Wave Theory and common sense, it's hard to see the Fund breaks below $13.59 again. Thus we believe the nest is the right count of the rally from wave (2) low. As we mentioned previously, the Fund has a strong relationship with Oil, as shown in the following chart:

Correlation Chart of GCC and Oil​


As we can see from the chart above, they trade on the same side, and share almost identical highs/lows. This makes us believe that Oil is also nesting, and higher prices will come in the coming years. GCC as a commodity fund also relates to Gold and Silver, as we show in the following chart:

Correlation chart of GCC and Gold​


The correlation between the Fund and Gold is not as direct and straightforward unlike with Oil. But there is no question that higher GCC means higher Gold and Silver. The Fund is a base and different commodity has a different weight in the fund. Oil has a bigger weight than Gold and Silver in the fund, hence the higher correlation between the Fund and Oil.

GCC Weekly Elliott Wave Chart​


GCC sees two cycles of five waves since the lows at 03.01.2020. We think the Fund is forming a nest, and soon we might see a break higher into new all-time highs. This might take Oil into the $170.00-$200.00 area, something which might be scary for many. To us, this is something which is very realistic looking at the charts and price action. GCC should see buyers between $22.73-$20.16 area. The area should agree with Oil trading between $86.29-$63.25. This area can be the beginning of wave ((3)) higher in Oil. Many people have been calling Indices to crash, but tend to forget that GCC and Oil relate to World Indices as the following chart shows:

Correlation Chart of GCC and SPX​


The chart above shows the correlation between GCC and $SPX. As we can see, they correlate in each swing higher/lower. Sometimes they have direct correlation and sometimes in second-degree correlation. The first degree correlation is when they trade in the same direction both in swing as well as overall direction. The second degree correlation is when they agree on the swing direction, but not in the overall direction. In the end, GCC is reacting off the blue box. GCC doing a nest might be a warning for soon-to-happen higher Indices, Commodities, and something in which traders asking for a market crash might not be getting the wish.

Source: https://elliottwave-forecast.com/commodities/gcc-calling-for-higher-commodities/
 

Elliottwave-Forecast

Master Trader
Feb 17, 2017
2,426
9
84
www.elliottwave-forecast.com
Hello fellow traders. Another instrument that we have been trading lately is ZN_F. In this technical blog we’re going to take a quick look at the Elliott Wave charts of 10 Year Note and explain the trading strategy. As our members know, ZN_F has been giving us good trading opportunities recently. We recommended members to avoid buying it, while favoring the short side. In the further text we are going to explain the Elliott Wave Forecast and the trading strategy.

ZN_F H4 Elliott Wave Analysis 06.30.2022​

ZN_F is doing recovery against the 135'17 peak which is unfolding as Elliott Wave Double Three Pattern. Recovery looks incomplete at the moment. It's showing higher high structure- 5 swings from the low. Current view suggests we should ideally see short term pull back and another leg up toward blue box to complete clear 7 swings from the low. Strategy is waiting for the price to reach marked blue box zone: 120'125-122'28 in clear 7 swings before entering short positions. Invalidation for the trade would be break above 1.618 fibs extension: 122'28. As the main trend is bearish we expect sellers to appear at the blue box for 3 waves pull back at least. Once pull back reaches 50 Fibs against the (x) blue low, we will make short position risk free ( put SL at BE) and take partial profits.

Reminder: You can learn about Elliott Wave Double Three Pattern at our Free Elliott Wave Educational Web Page.


ZN_F H4 Elliott Wave Analysis 07.07.2022​

Eventually , 10 year note made proposed extension higher toward 120'125+ area, and made reaction from there. ZN_F found sellers right at the blue box area: 120'125-122'28 and made decent reaction that has reached 50 fibs against the (X) blue low. As a result, members who took short trades mad positions risk free . ( Put SL at BE) and took partial profits. At this stage we see wave ((4)) completed at 120'15 high. We would like to see break of previous low : 06/14 to confirm wave ((5)) is in progress.

Keep in mind market is dynamic and presented view could have changed in the mean time. You can check most recent charts in the membership area of the site. Best instruments to trade are those having incomplete bullish or bearish swings sequences.We put them in Sequence Report and best among them are shown in the Live Trading Room.

ZN_F

Elliott Wave Forecast
Source: https://elliottwave-forecast.com/trading/10-year-note-zn_f-forecasting-path/
 

Elliottwave-Forecast

Master Trader
Feb 17, 2017
2,426
9
84
www.elliottwave-forecast.com
Hello fellow traders. In this article we’re going to take a quick look at the Elliott Wave charts of USDNOK, published in members area of the website. We have favoring the long side due to impulsive bullish sequences the pair is showing in the cycle from the 9.33 low. Consequently, we recommended members to avoid selling the pair, while keep favoring the long side. Recently the pair made a short term pull back that has given us buying opportunities. In the further text we are going to explain the Elliott Wave Forecast and trading strategy.

USDNOK Elliott Wave 1 Hour Chart 07.07.2022​

Currently the pair is giving us intraday (ii) blue pull back that is unfolding as Elliott Wave Zig Zag Pattern. Wave (ii) Pull back looks incomplete at the moment. We expect to see more downside toward 10.041-9.976 ( Blue Box – buying zone) . We don’t recommend selling the pair against the main bullish trend. Strategy is waiting for the price to reach blue box zone, before entering the long trades. We expect buyers to appear at the blue box for the further rally toward new high ideally or for a 3 waves bounce at least . Once bounce reaches 50 Fibs against the b red high, we will make long position risk free ( put SL at BE). Invalidation for the trade would be break of marked invalidation level 9.976

Quick reminder:

Our charts are easy to trade and understand:
Red bearish stamp+ blue box = Selling Setup
Green bullish stamp+ blue box = Buying Setup
Charts with Black stamps are not tradable.

You can learn more about Elliott Wave Patterns at our Free Elliott Wave Educational Web Page.

USDNOK

USDNOK Elliott Wave 1 Hour Chart 07.08.2022​

USDNOK has given us more downside toward blue box as expected. The pair found buyers at the Blue Box area: 10.041-9.976 and we are getting good reaction from there. Raly from the buying zone made break of previous peak confirming wave (ii) is done and we can be ideally trading within (iii) blue. As a result , all long trades are risk free (put SL at BE) + partial profits have been taken.

Keep in mind that market is dynamic and presented view could have changed in the mean time. You can check most recent charts in the membership area of the site. Best instruments to trade are those having incomplete bullish or bearish swings sequences. We put them in Sequence Report and best among them are shown in the Live Trading Room

USDNOK

Elliott Wave Forecast
Source: https://elliottwave-forecast.com/forex/usdnok-buying-dips-blue-box/
 

Elliottwave-Forecast

Master Trader
Feb 17, 2017
2,426
9
84
www.elliottwave-forecast.com
Hard Red Winter Wheat is one of the grain commodities, along with soft red wheat, corn, soybeans and others. Within the wheat family, first of all, there is a fundamental difference between two wheat types. Soft wheat is low in protein and is basically used in cakes in pastries. By contrast, hard wheat has a higher content of protein and it founds itself in breads and hard baked goods. Some time ago, trading of hard wheat took place at Kansas City Board of Trade. Then, it moved to Chicago. One can trade hard wheat futures at Chicago Board of Trade under the ticker $KE. Hereby, the contract size is 5’000 bushels (300’000 pounds) each and the prices are in Dollars US per 100 bushel.

In the last article from September 2022, we saw prices climbed from 524 USD in December 2020 towards 738 USD by August 2021. There, we have forecasted a rally towards 1'000 USD and higher to take place. We were right. In May 2022, hard red winter wheat has printed a highest price since a good decade at 1225. Now, we expect a short term pullback. Then, a rally towards 1'500 USD and higher should take place.

Hard Red Winter Wheat Weekly Elliott Wave Analysis 07.10.2022​

The weekly chart below shows the Hard Winter Wheat front contract IH #F. From the all-time lows, the prices have developed a cycle higher in black wave ((a)) of a grand super cycle degree. It has ended in March 2008 at 1290 Dollars. From the highs, a correction lower in wave ((b)) has unfolded as an Elliott Wave double three pattern. In 8 years, as a matter of fact, IH #F has lost more than 3/4 of the price reaching 296 Dollars per 100 bushel. It is the preferred view that an important bottom on October 2016 has been set and the black wave ((b)) has ended.

From the lows, consequently, a new rally within wave ((c)) may have started. Hereby, the super cycle degree waves (I) and (II) have already ended, while above 365, wave (III) is extending higher. It has hit 1225 and, therefore, reached beyond the 2.618 extension of the wave (I) being 1094 USD. As a consequence, wave (III) might have ended. However, the RSI reading still shows a divergence as related to the wave (I). Therefore, acceleration within red wave III of blue wave (III) should still take place.

The preferred view is that wave I has ended in March 2022 at 1209 USD. From the highs, the correction in wave II is unfolding as an expanded flat structure. Then, acceleration in wave III of (III) should take place. The medium-term target for coming 1-2 years will be towards 1'500 USD per 100 bushel and even higher. Investors and traders can be looking to buy the pullback in wave II against 365 lows expecting more upside.

2023-2025, the expectations are to break out to the new all-time highs. The long-term target for wave ((c)) to end will be 1444-2153 area.

Hard Red Winter Wheat Elliott Wave Monthly

Source: https://elliottwave-forecast.com/commodities/hard-red-winter-wheat-shortage-2023/
 

Elliottwave-Forecast

Master Trader
Feb 17, 2017
2,426
9
84
www.elliottwave-forecast.com
Sony Group Corporation, commonly known as Sony and stylized as SONY, is a Japanese multinational conglomerate corporation headquartered in Kōnan, Minato, Tokyo, Japan. As a major technology company, it operates as one of the world's largest manufacturers of consumer and professional electronic products, the largest video game console company and the largest video game publisher. Through Sony Entertainment Inc, it is one of the largest music companies (largest music publisher & second largest record label) and the third largest film studio, making it one of the most comprehensive media companies. It is the largest technology and media conglomerate in Japan. It is also recognized as the most cash-rich Japanese company, with net cash reserves of ¥2 trillion.

SONY Weekly Chart July 8th 2022​

SONY Weekly Chart July 8th 2022

SONY completed an impulse that began at the end of 2012. The share price reached 133.75 in January 2021, that is, 9 years of upward movement. We have called this impulse wave (I). From here the price started to fall and we can see that 6 swings have been formed. This means the bearish sequence is incomplete because we need 7 swings to complete a double correction. This double correction would end the 2012 cycle pullback and then continue rally again. The first 3 swings formed the wave w at 94.33. Then we had a bounce that ended at 107.52 as wave x and this would be the fourth swing. From 107.52, we need 3 more swings to complete the double correction. Swings 5 and 6 are now ended, and we're on the last one that should build an impulse. This would take us to the blue box 68.11 – 43.83 area. This would end wave y, wave (II), and the double correction whereby the market should continue higher.

SONY Weekly Chart July 8th 2022​

SONY Weekly Chart July 8th 2022 ALT

As an alternative count, we are running a leading diagonal from the 133.75 peak. (If you want to learn more about Elliott Wave Theory, please follow these links: Elliott Wave Education and Elliott Wave Theory). This would be close to end to complete wave a. From here, we should see a bounce higher in 3 waves to finish wave b first. Then the market would turn down in the form of an impulse to look for the blue box. Once the blue box is reached, we would complete wave c and the zigzag correction as wave (II). From here, we would look to continue the rally and break the 133.75 peak.

In conclusion, the key would be the break of 95.70. If we break this level, we would be developing the alternative count, if not the main count.

Source: https://elliottwave-forecast.com/stock-market/sony-further-bearish-in-this-year/
 

Elliottwave-Forecast

Master Trader
Feb 17, 2017
2,426
9
84
www.elliottwave-forecast.com
In this technical blog, we will look at the past performance of 1 hour Elliott Wave Charts of the Nifty index. In which, the decline from April 2022 high ended in a higher degree wave ((Y)) at 15183.40 low. And made a bounce higher in wave ((X)). The bounce from the lows unfolded in a corrective sequence & managed to reach the Elliott wave hedging area. When buyers & sellers get agreed on a similar direction in 3 swings at least. So we advised not to buy the index at this stage because sellers were expected to appear within the blue box area. Looking for a 3 wave reaction lower at least. We will explain the structure & forecast below:

Nifty 1 Hour Elliott Wave Chart​

Nifty Index Reacting Lower From Elliott Wave Hedging Area

Here's 1 Hour Elliott wave chart from the 7/10/2022 Weekend update. In which, the bounce from the lows unfolded as a double three structure where wave W ended at 15927.45 high. A pullback to 15511.05 low ended in wave X. Then started the Y leg higher towards 16258.29- 16717.21 blue box area from where sellers were expected to appear. Looking for a 3 wave reaction lower at least as per Elliott wave hedging.

Nifty 1 Hour Elliott Wave Chart​

Nifty Index Reacting Lower From Elliott Wave Hedging Area

This is the Latest 1hr view from the 7/14/2022 London update. In which the index is showing a reaction lower taking place from the blue box area allowing shorts to get into a risk-free position shortly after taking the position. As the index has already managed to reach the 50% Fibonacci retracement area of the Y leg at the 15893.90 level.

Source: https://elliottwave-forecast.com/stock-market/nifty-index-reacting-lower-hedging-area/
 

Elliottwave-Forecast

Master Trader
Feb 17, 2017
2,426
9
84
www.elliottwave-forecast.com
SAP SE is a multinational corporation which is well known as a producer of the enterprise software being used in managing business operations and customer relations. Founded in 1972 and headquartered in Walldorf, Germany, the company’s most famous product is the enterprise resource planning (ERP) software. The company is a part of both DAX40 and of SX5E indices. One can trade under the ticker $SAP in Frankfurt and New York.

In the initial article from May 2020, we have forecasted a recovery from the fall of February-March 2020. We were right. The stock price has made a new all-time high in September 2020 at 143.32. Now, a large consolidation is taking place. Hereby, we see a correction of the October 2002 cycle. It provides, therefore, an opportunity to enter the market at interesting price.

SAP Monthly Elliott Wave Analysis 07.14.2022​

The monthly chart below shows the SAP stock $SAP traded at XETRA. From the all-time lows, the stock price has developed its first significant push higher in wave (I) of super cycle degree. This impulsive move up has printed a top in September 2000 at 77.50. From the peak, the wave (II) has provided a consolidation of the stock price in 3 waves lower as a zigzag correction towards the October 2002 lows at 9.92. That level became the starting point of a larger move to the upside. The rally higher is the wave (III) of the super cycle degree. It has lasted for 18 years and has ended in September 2020. As a matter of fact, it reveals a clearly visible Elliott wave impulsive wave structure. Now, it is the preferred view that the wave (IV) is correcting the cycle in wave (III).

Within the blue wave (IV), the red wave a has ended in November 2020 at 89.93, the connector higher in red wave b higher has found a top in November 2021 at 129.74. From there, the red wave c has broken the 89.93 lows while opening up a bearish sequence. The price is expected to drop towards 76.39 at least to end the correction in wave (IV). Then, a new cycle in blue wave (V) should start.

Investors and traders can be looking to buy SAP from 76.39-43.28 area targeting 159.38-185.03 area for the next 2-5 years.

SAP Elliott Wave Monthly

Source: https://elliottwave-forecast.com/stock-market/sap-software-offers-opportunity/
 

Elliottwave-Forecast

Master Trader
Feb 17, 2017
2,426
9
84
www.elliottwave-forecast.com
In this technical article we’re going to take a quick look at the Elliott Wave charts of USDSEK, another forex pair we have traded in EWF. As our members know we have been calling for the rally in the pair due to impulsive bullish sequences. Consequently, we recommended members to avoid selling the pair, while keep favoring buying the dips in 3,7,11 swings. Recently the pair made a short term pull back that has given us buying opportunities. In the further text we are going to explain the Elliott Wave Forecast and trading strategy.

USDSEK Elliott Wave 1 Hour Chart 07.13.2022​

USDSEK is doing intraday ((iv)) blue pull back that is unfolding as Elliott Wave Zig Zag Pattern. Correction is reaching extremes at 10.468-10.371. Strategy is buying the dips in the blue box zone, where we expect buyers to appear for the further rally toward new high or for a 3 waves bounce at least . Once bounce reaches 50 Fibs against the (b) blue high, we will make long position risk free ( put SL at BE). Invalidation for the trade would be break of 1.618 fib extension:10.371

Quick reminder:

Our charts are easy to trade and understand:
Red bearish stamp+ blue box = Selling Setup
Green bullish stamp+ blue box = Buying Setup
Charts with Black stamps are not tradable.

You can learn more about Elliott Wave Patterns at our Free Elliott Wave Educational Web Page.

USDSEK

USDSEK Elliott Wave 1 Hour Chart 07.14.2022​

The pair found buyers right at the 100% extension (a)-(b) at 10.468. We got nice reaction so far. Rally reached and exceeded 50 fibs of connector. As a result , all long trades are risk free (put SL at BE) + partial profits have been taken. Currently the pair is doing short term (ii) pull back. As far as the price stays above 10.468 low, we can have ((iv)) correction completed. Otherwise break of that level would suggests the pair is doing 7 swings down against the 10.032 low.

Keep in mind that market is dynamic and presented view could have changed in the mean time. You can check most recent charts in the membership area of the site. Best instruments to trade are those having incomplete bullish or bearish swings sequences. We put them in Sequence Report and best among them are shown in the Live Trading Room


Elliott Wave Forecast
Source: https://elliottwave-forecast.com/trading/usdsek-calling-rally-buying-blue-box/