Elliottwave-Forecast

Master Trader
Feb 17, 2017
2,453
9
84
www.elliottwave-forecast.com
Hello Traders. as we always do at Elliott Wave Forecast we believe in the one Market only concept. Back in 2017, we did a blog in which we mentioned that Silver was the smartest way to sell World Indices.

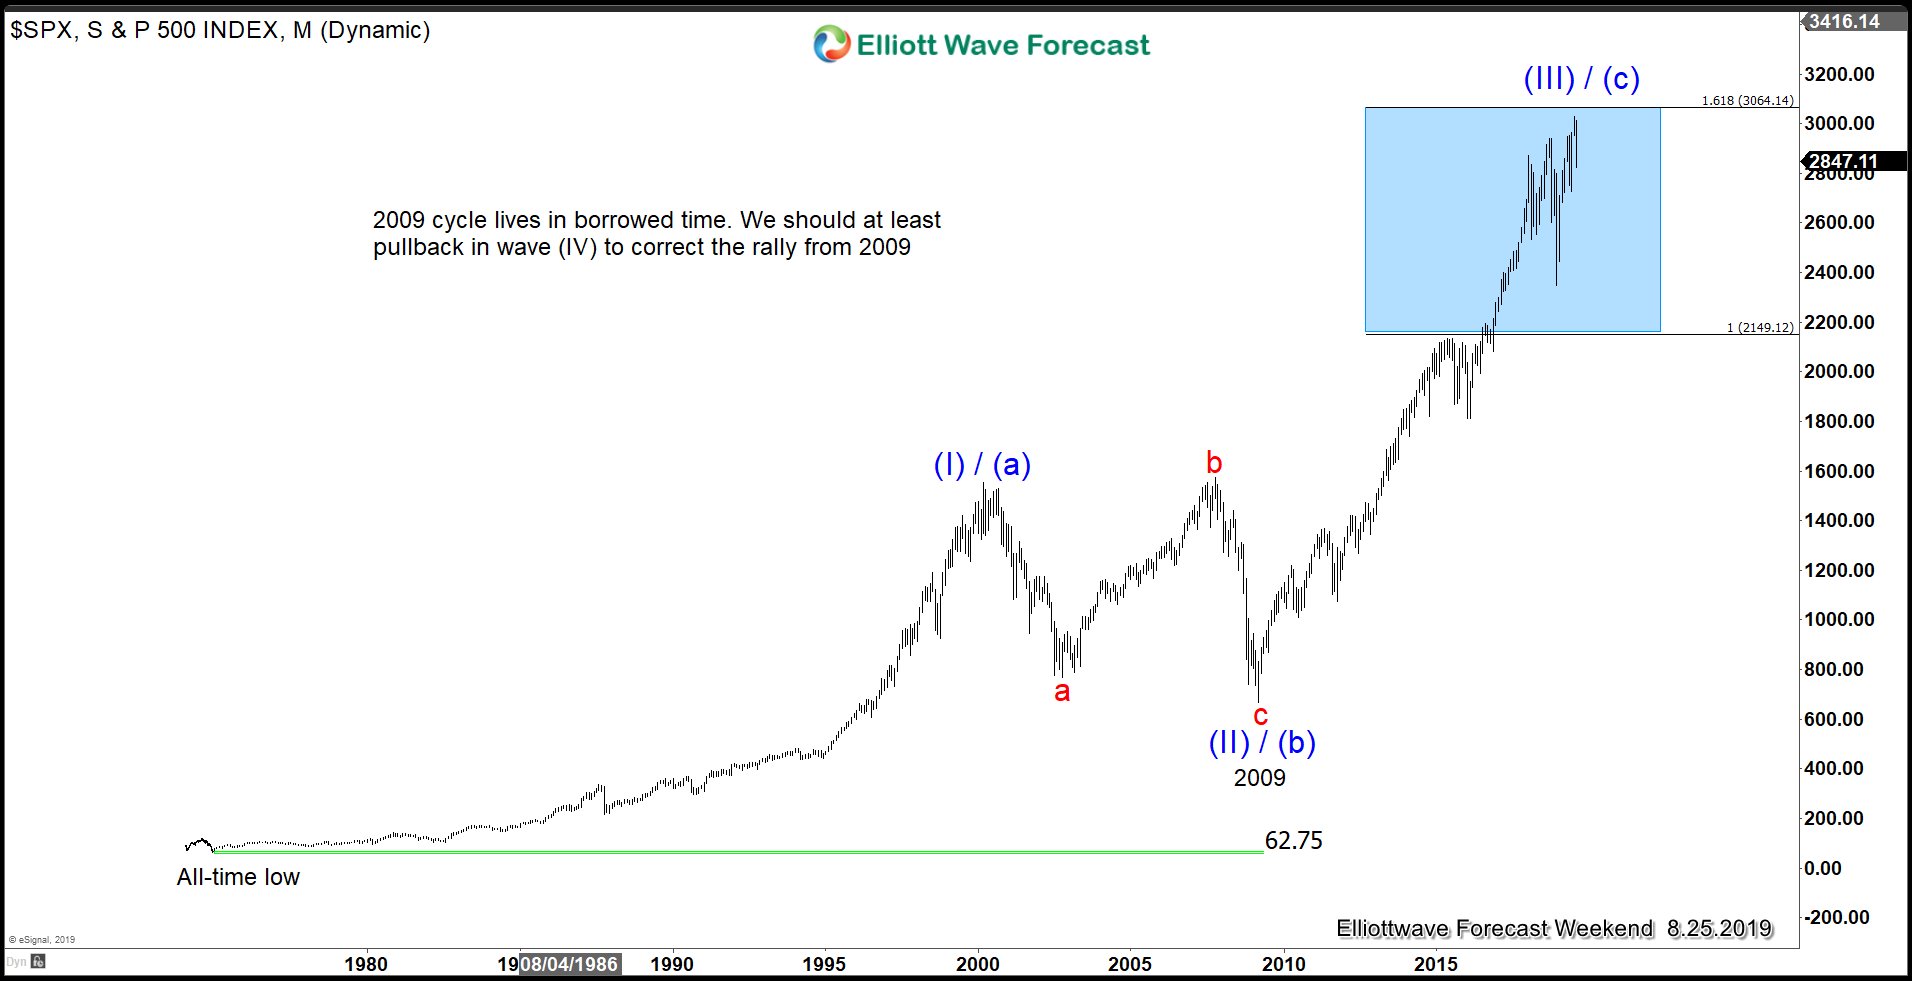
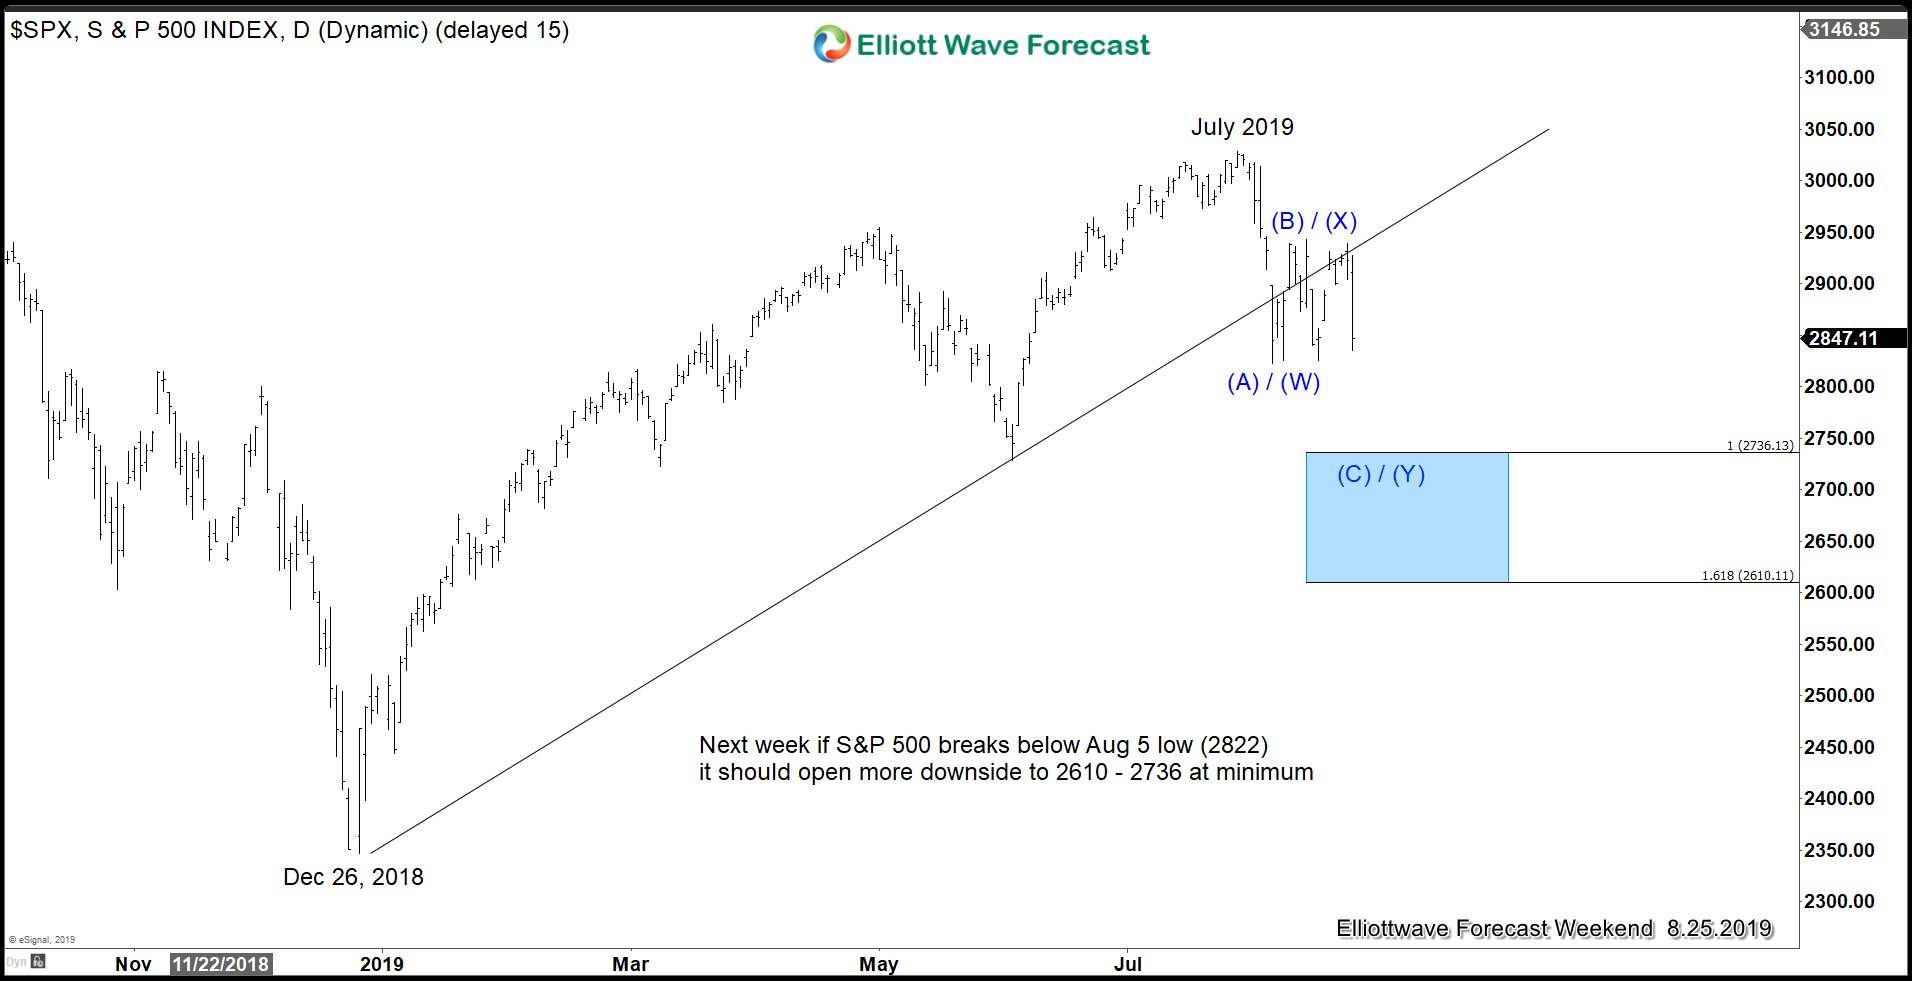
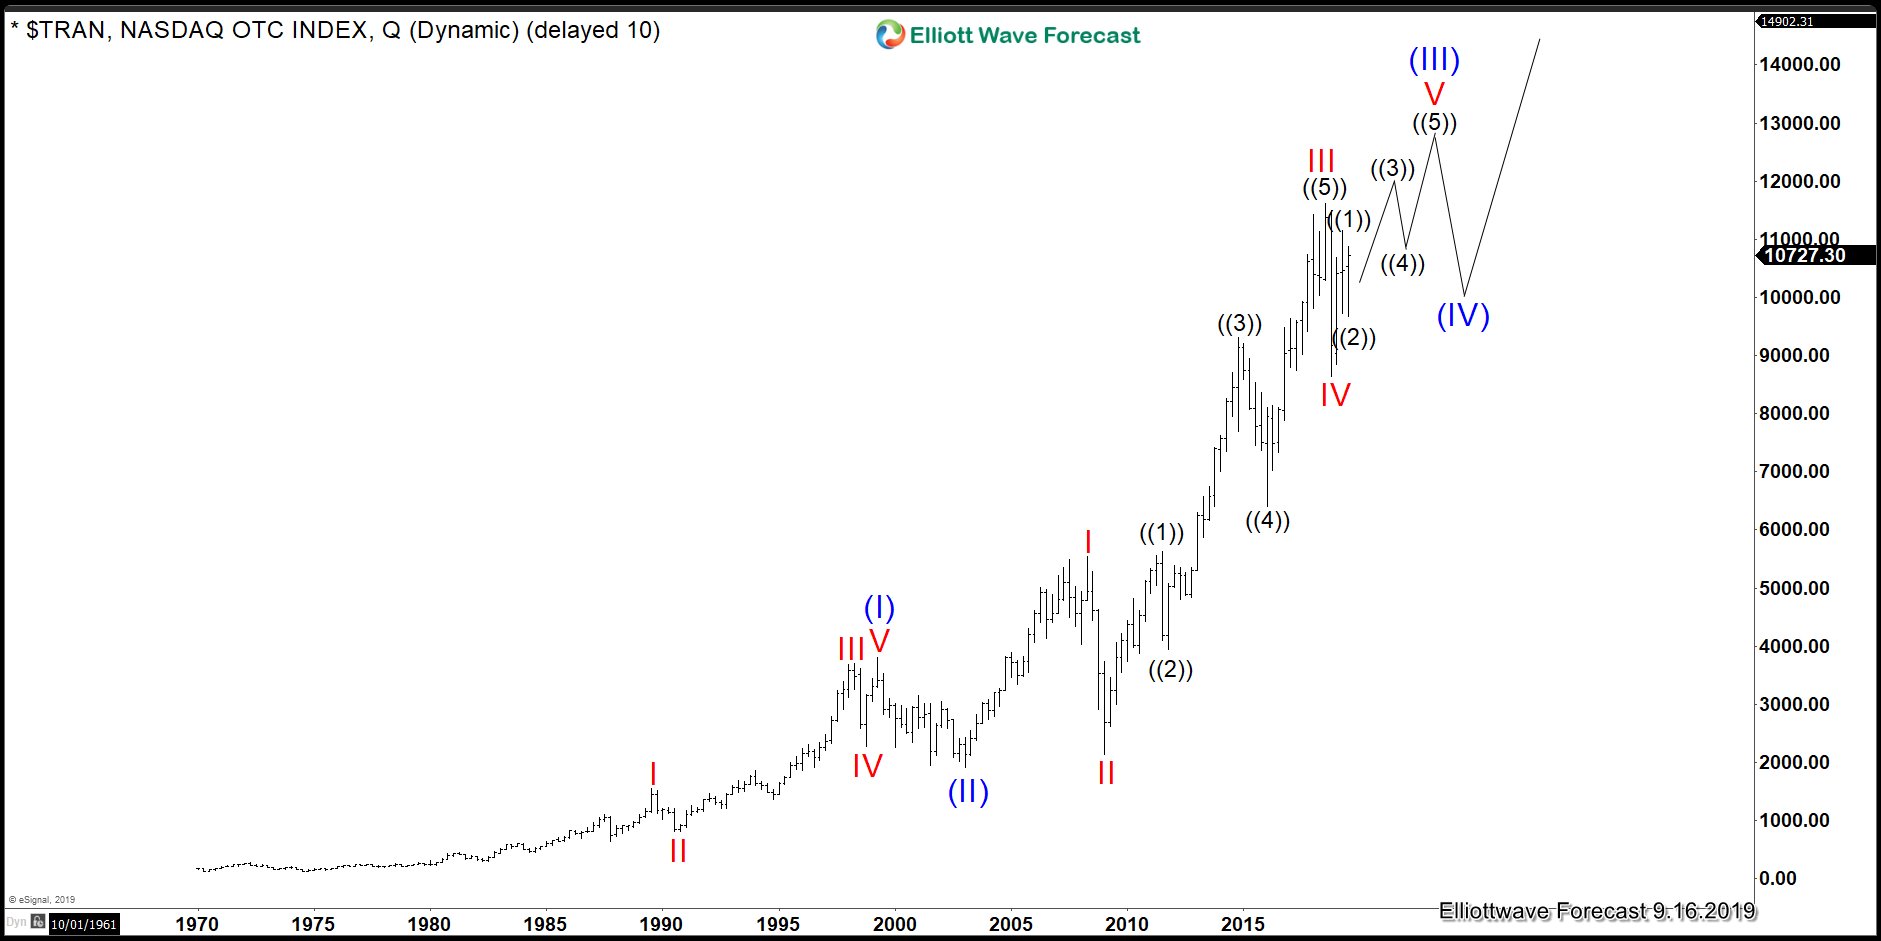
We do understand that the longest bull rally in the SPX is coming soon to the end. In the chart below, you can see that the cycle has not ended yet and can still extend into the 3186-3500 area. However, we have signs that the longest expansion or acceleration has already passed.


SPX Monthly Elliott Wave View 8/15/2019
SPX-Grand-Super-cycle20190819082950.jpg


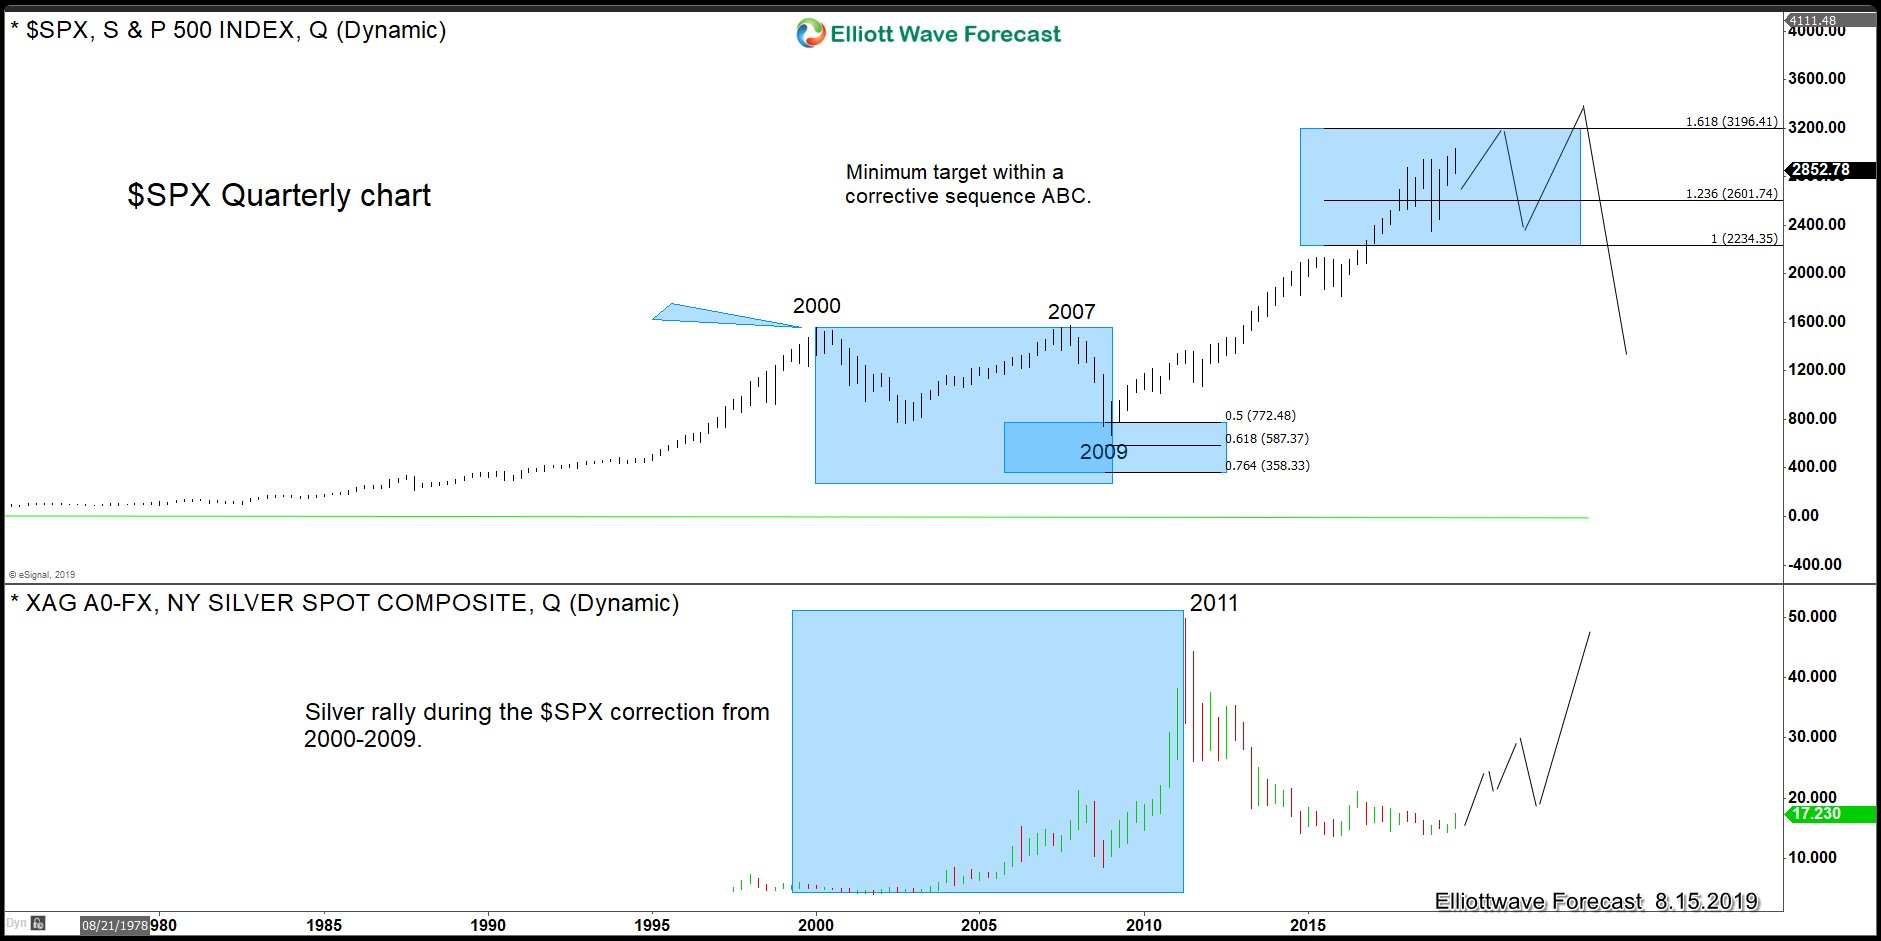
The SPX is within a blue box which goes from 2221 to 3186. If it goes above the 3186 area, which we believe can happen and SPX will become an impulse and do a wave (IV) and (V). However, that move will not be as strong as the cycle from 2009 low. Sooner or later based on the Elliott Wave Theory, after a 5 waves advance the Market will most likely do the biggest correction Humankind has ever seen.

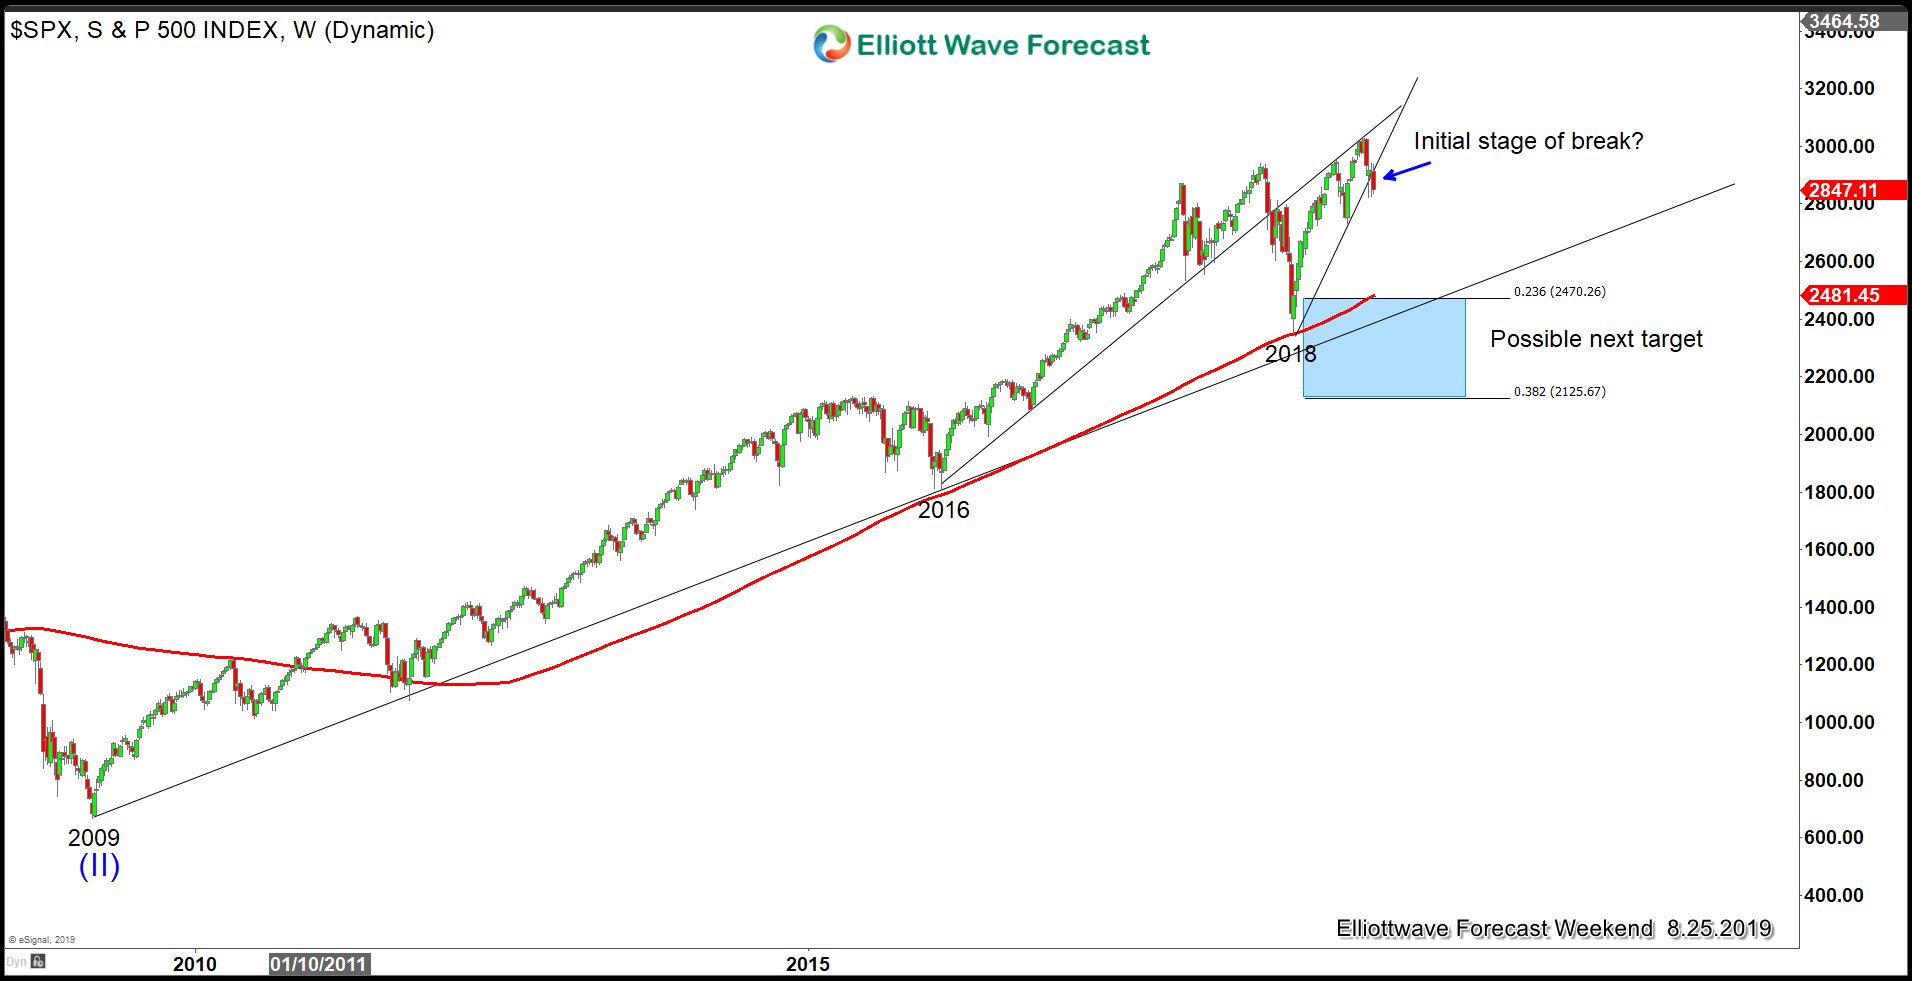
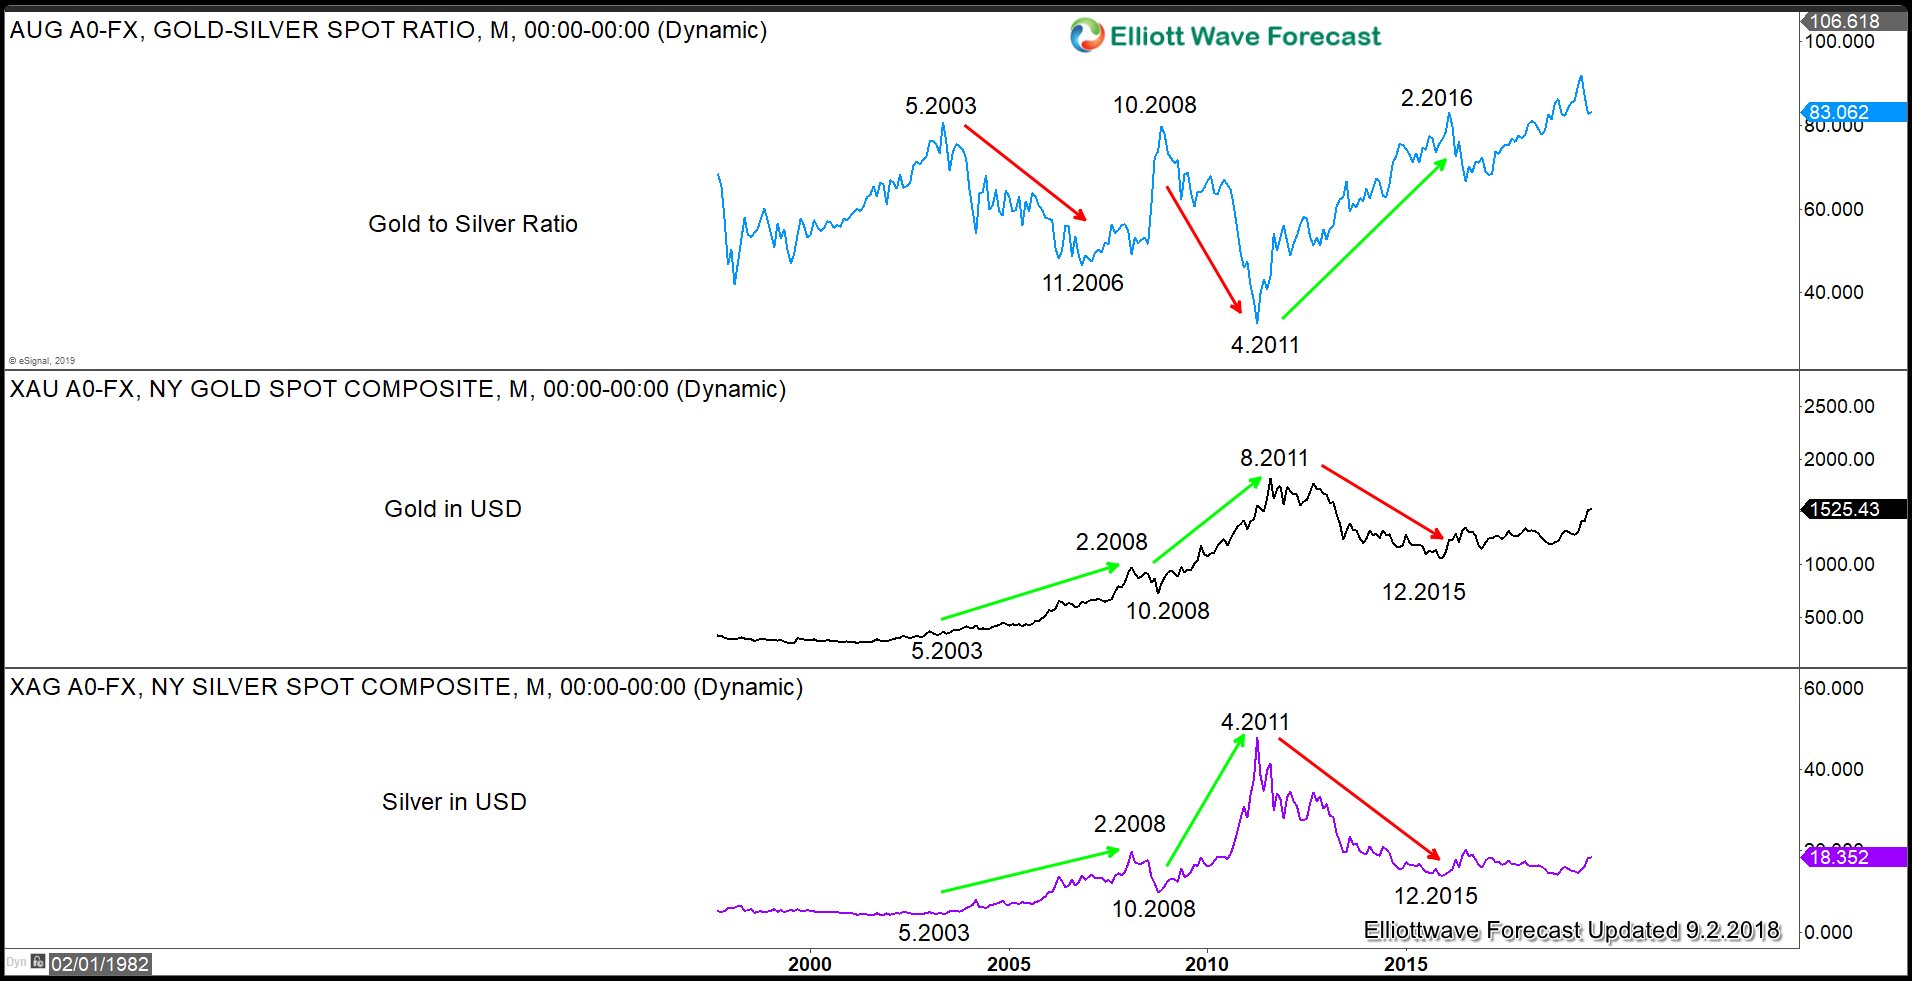
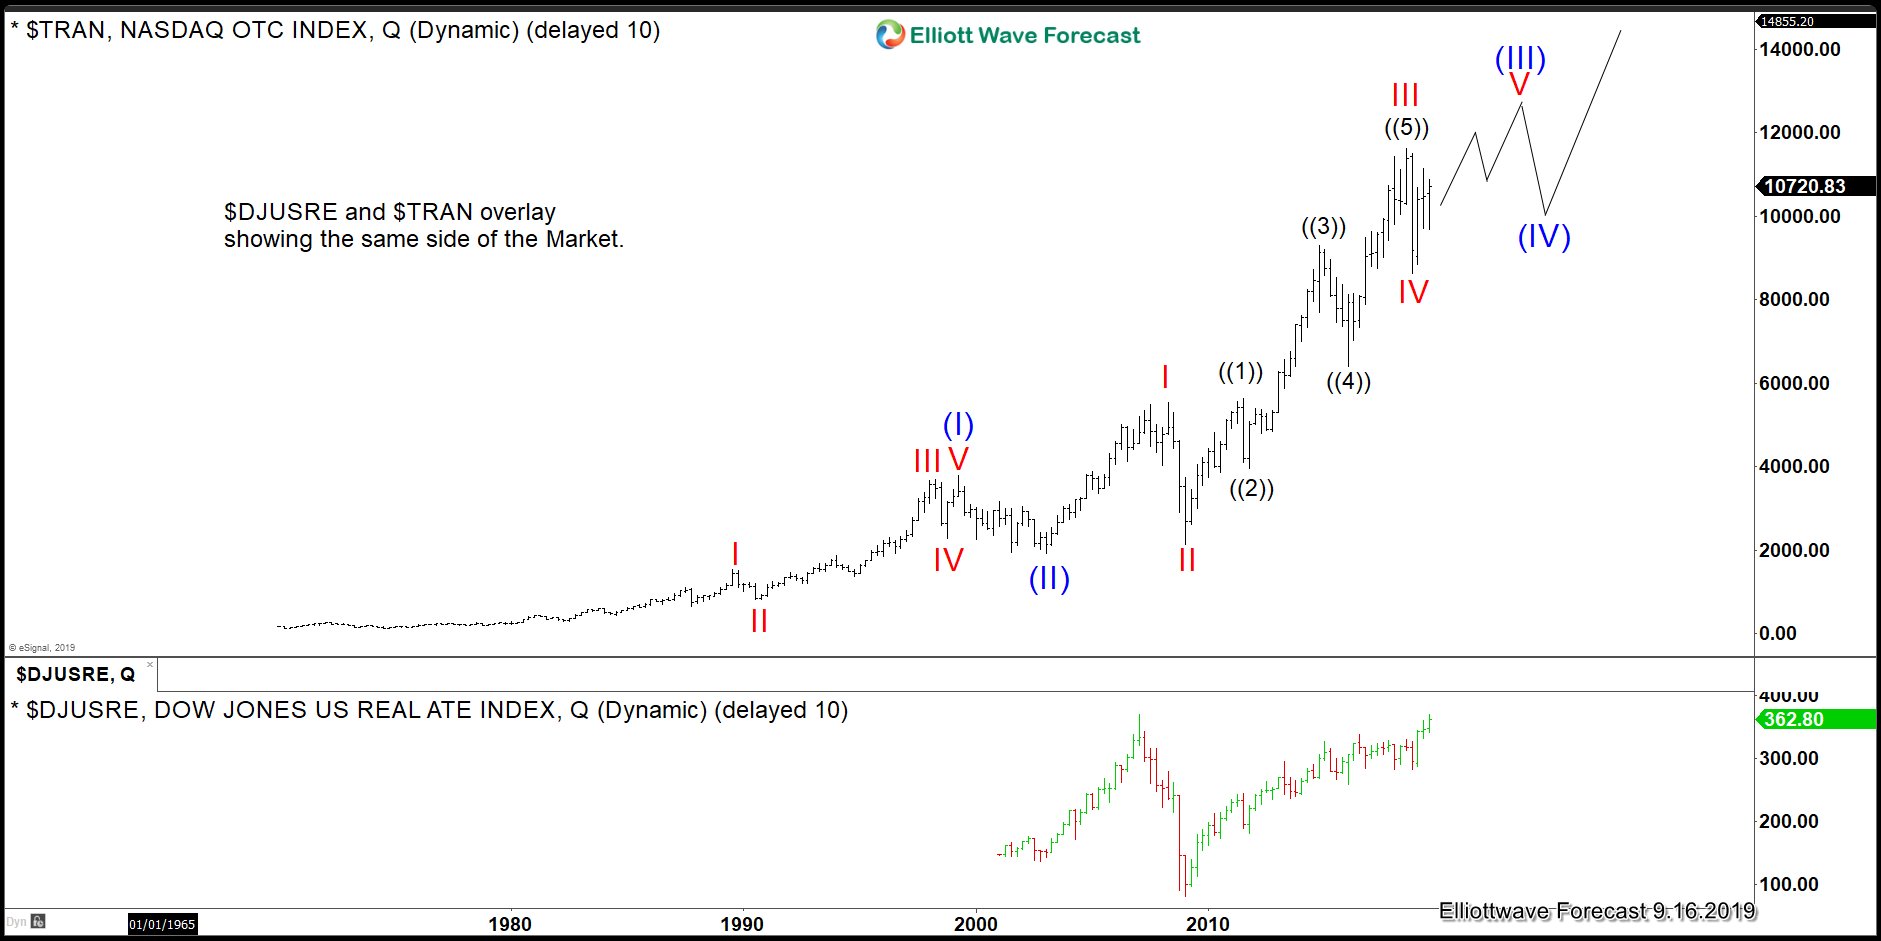
The following chart shows the correction between Silver and SPX which is showing how much Silver rally within the period from 2000 to 2009 until its peak at 2011

Now we are in the early stage of a reaction higher from the weekly blue box in Silver. We should be trading in Silver around the 2003-2005 time period when the instrument started to create the first leg into the huge rally which should be the peak in SPX soon.


SPX vs. Silver Quarterly Chart


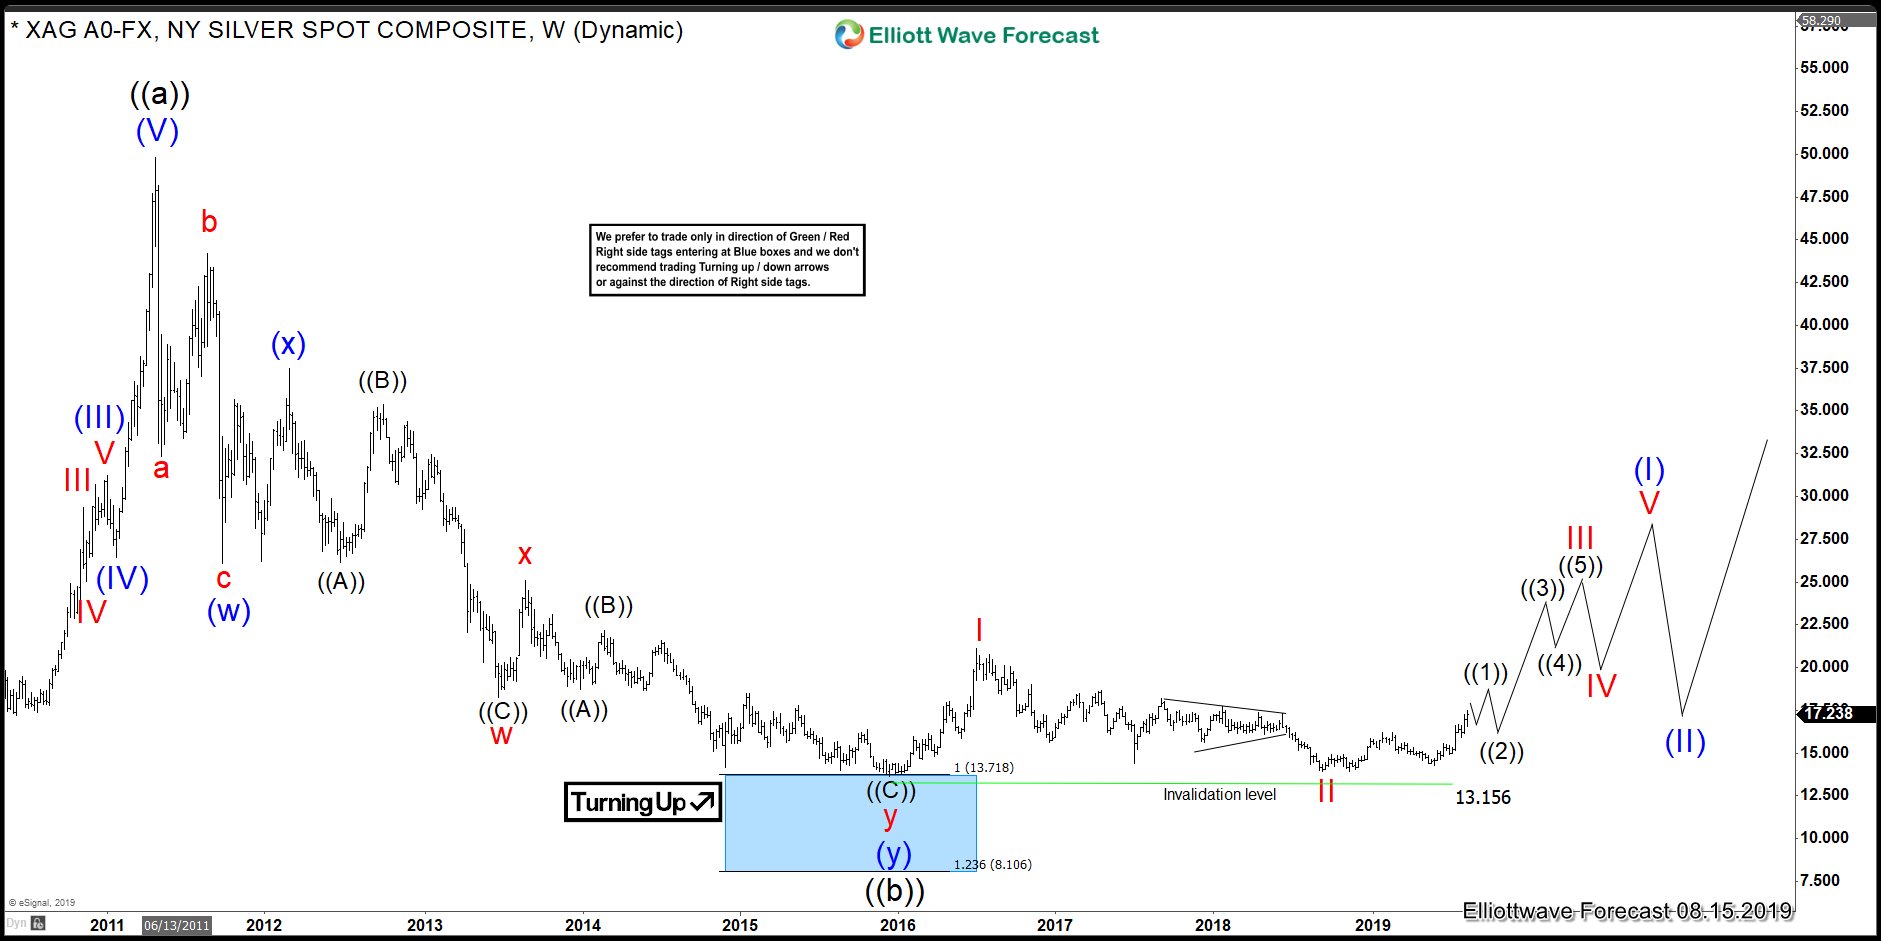
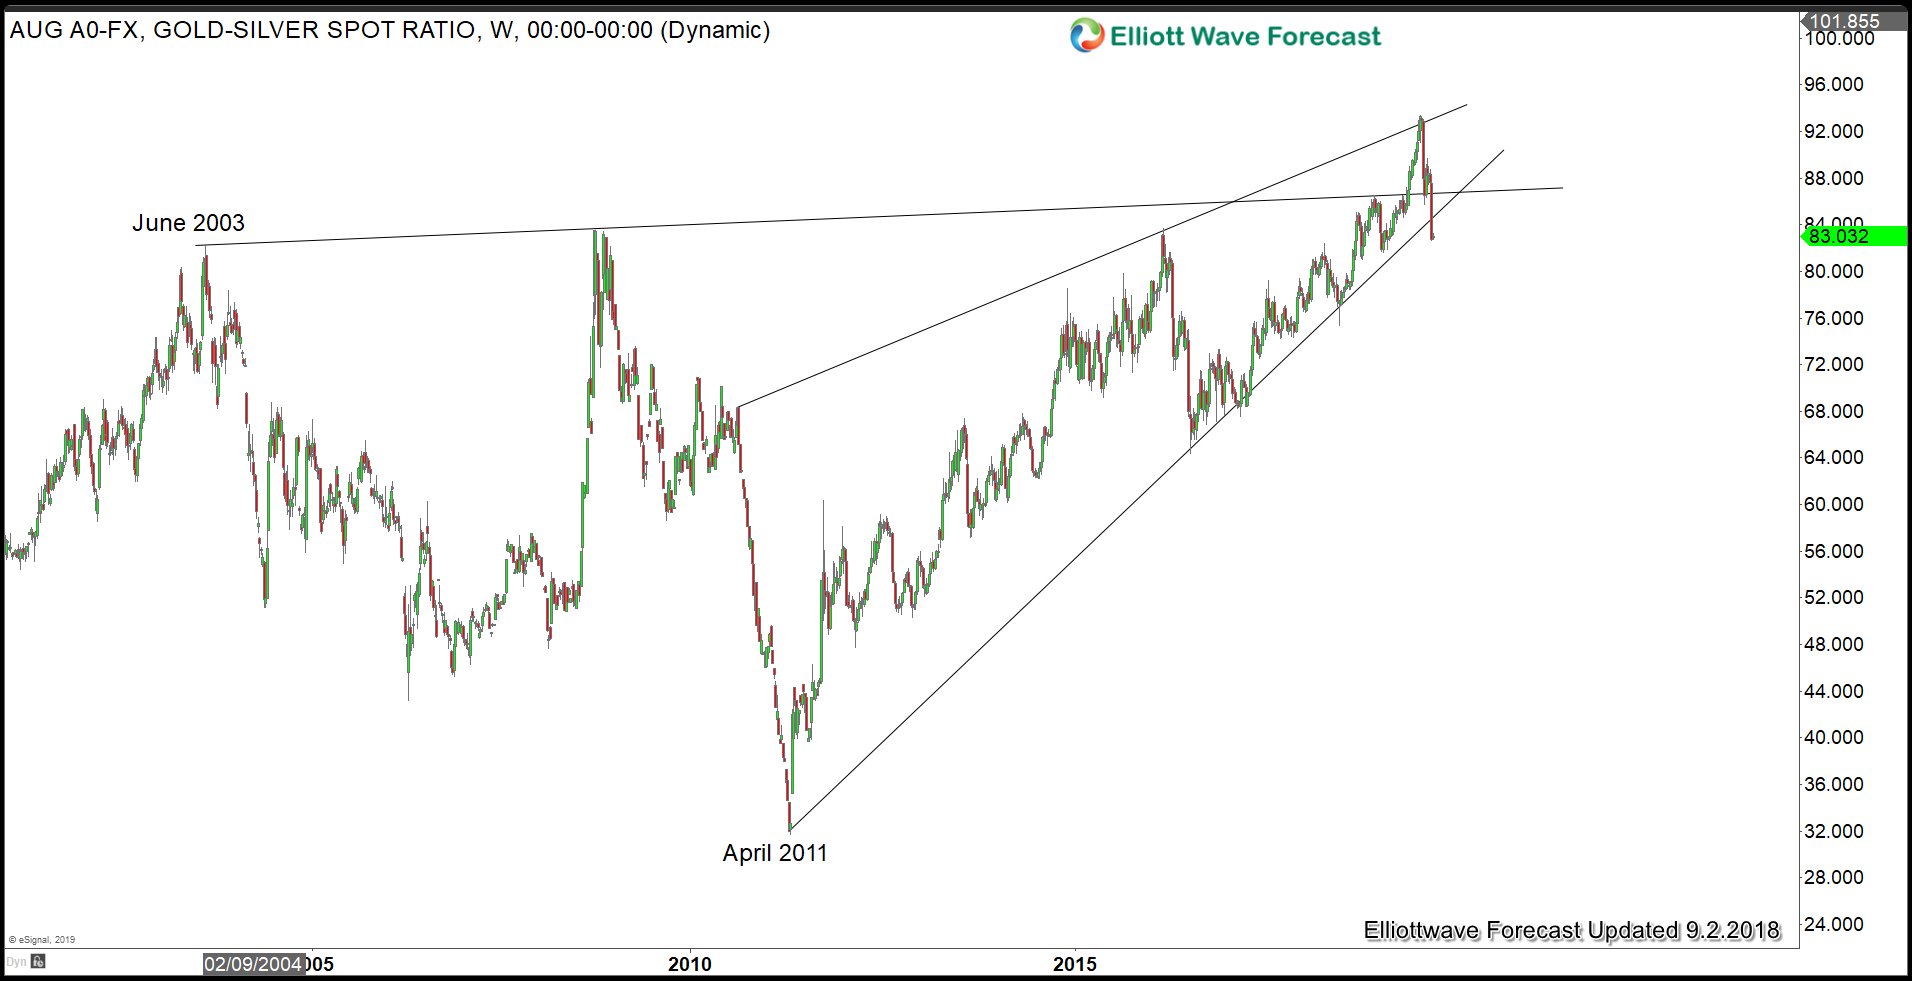
Silver reached the blue box, as we presented in the following chart. The lowest point is very close to the production cost of Silver and consequently, it is hard to see the instrument trading much lower.

We believe a nest is taking place and will be sideways around the lows for the next few years like it did in the early 2000s. Having a look at the current Silver price it seems like the rolling over into a big move has started and a move into a peak in the SPX can have started also.

Traders lack in the understanding of how important the selection of the right instrument to trade is and at Elliott Wave Forecast will never tell members to pick the top of in SPX but will guide our members to buy instruments which should trade in the same or equivalent direction with the right side tags, like Silver is in this case.


Silver Weekly Elliott Wave View 8/15/2019
 

Elliottwave-Forecast

Master Trader
Feb 17, 2017
2,453
9
84
www.elliottwave-forecast.com
Last week, there was anticipation of market volatility as the Fed's Chairman Jerome Powell was scheduled to speak at Jackson Hole. President Trump and China however stole the show. China introduced fresh retaliatory tariffs on $75 billion of U.S. imports, targeting politically sensitive products. President Trump immediately responded. Trump announced in twitter the existing 25% tariffs on $250 billion Chinese goods will rise to 30% on October 1. In addition, the 10% tariffs on another $300 billion Chinese Goods will rise to 15% instead on September 1.

In a series of Tweet storm, Trump also accused Powell of a bigger enemy than China's President Xi Jinping and issued an order to American companies to get out of China.


“Our great American companies are hereby ordered to immediately start looking for an alternative to China, including bringing your companies HOME and making your products in the USA,” Trump wrote. The move came after the market closed and before Trump departs to G7 summit in France. The National Retail Federation issued a statement on Friday saying that the tariffs approach is not working.

On Sunday at the G7 summit however, President Trump said that he has a second thought on escalating the trade war with China. The G-7 leaders seem to have successfully nudged the President gently to dial down his aggressive stance against China. It remains to be seen if Trump withdraws his threats last Friday, whether fully or partially. In the meantime, one thing for certain is that the market will continue to be uncertain and volatile.

S&P 500 Longer Term View


It remains to be our call that the cycle from 2009 low is mature and S&P 500 should soon pullback in wave (IV) in larger 3 waves at least. As we said in the previous article, a yield curve inversion in the past precedes a recession by about 2 years in time. Therefore, we still can not rule out one last rally in wave (V) later before the biggest pullback happens. The alternate view suggests the rally in S&P 500 is in a 3 waves (a)-(b)-(c) zigzag and in this case the biggest pullback is already due.

S&P 500 closed below 2018 trend line


The bulls tried to hold above the 2018 ascending trend line last week but failed to do it. The Index has now decisively closed below the trend line. If the Index has started to do the wave (IV) pullback as the first chart suggests, then it can potentially go to 2125 - 2470 as the next potential strong support. This is the 23.6 - 38.2 Fibonacci retracement from wave (II) low in 2009 . It also has the support of the ascending trend line and 200 weekly moving average.

Short Term S&P 500 Outlook


Short Term outlook in S&P 500 (SPX) suggests further downside is likely. The view will get further confirmation if the Index is able to break below August 5 low (2822) next week. Once August 5 low breaks, the next short term minimum target is 2610 - 2736. With weekly close below the trend line from 2018 high, the odd suggests for further downside in coming weeks.
 

Elliottwave-Forecast

Master Trader
Feb 17, 2017
2,453
9
84
www.elliottwave-forecast.com
Hello fellow traders. In today's blog, we will have a look at the Daimler AG stock. The stock is listed in the DAX 30 and in the EURO Stoxx 50.

Daimler AG is a German multinational automotive company which has its Headquarter in Stuttgart Germany. Daimler AG is one of the biggest car manufacturers in the world. They are famous for high-quality premium cars. But also they are one of the largest truck manufacturers as well.

In the last couple of weeks, all german car manufacturer are getting hit by the possible tariffs for the U.S. market which President Trump threatens to Europe carmakers.

Therefore, the stock is currently under pressure which can be also seen in the chart below. Let's have a look at the weekly price action and what to expect for the company.


Daimler AG 08.22.2019 Weekly Chart Analysis


In the chart above you can see that the stock ended the cycle up from its post-financial crises low at its 2015 peak. Below from there, it has been in the progress of correcting that in 3-7 or 11 swings. Recently, Daimler broke below its 2006 low and also broke below its 2019 low. With that said, the stock has a 5 swings incomplete sequence from 2015 peak and also from 2018 peak indicating that more downside should be coming. We can see that it reached the 61.8-76.40 extension area from 2015 peak.

From there it bounced decently and turned lower by making again a new low. Daimler should ideally now see the equal legs from 2015 peak towards 31.45-20.74 area. This area can be used based on Elliott Wave Hedging for a good buy investment opportunity. Summarizing, the stock should see more downside in the next coming weeks and month into 31.45-20.74 area where a bigger reaction higher in favor of the Daimler stock should ideally be taking place.
 

Elliottwave-Forecast

Master Trader
Feb 17, 2017
2,453
9
84
www.elliottwave-forecast.com
FXA Bearish Cycle From The July 2011 Highs

Firstly the FXA ETF fund is the Australian dollar tracking fund that has an Inception Date of 06/21/2006. With that said the fund mainly reflects the currency spot price of the AUDUSD forex pair. The data available from the Reserve Bank of Australia at their website suggests the spot price was 1.4875 back in 1973 to 1974 that would translate into an FXA price of around 148.75. It should be obvious that is a long term downtrend. I believe the bearish cycle analysis suggests it can go lower to possibly retest those lows eventually.

Back before the FXA fund inception date, the AUDUSD spot currency price reached what is still the currency low in April 2001 at .4778. From there the currency pair went up in three swings until July 2011 at a high of 1.1080. That translated into the FXA ETF fund price high of 110.99 in July 2011. This is where the monthly Elliott wave analysis begins on the chart below.

The analysis continues below the monthly chart.


Secondly the decline from the aforementioned July 2011 highs at least in this FXA ETF fund does not seem legitimately able to count the whole cycle from there down to the January 2016 lows as a regular impulse by itself as a whole. The cycle lower in the blue wave (a) has been subdivided as an a-b-c in red. The instrument has since then bounced in three swings in what appeared to be a zig zag Elliott wave (b) that ended in January 2018.

The analysis continues below the weekly chart.


Thirdly in conclusion since the wave (b) highs from January 2018 the instrument has declined in a relatively clean & clear 5 wave impulse in wave a to the October 2018 lows. A bounce to the December 2018 highs was technically strong. It suggested it was correcting the cycle from the January 2018 highs. The instrument has since made new lows under the January 2016 lows. That now gives it a bearish sequence again to go along with the obvious down trend.

The equal legs of the larger blue (a) -(b) on the two charts shown above comes in at the 38.70 area. I only drew a proposed decline toward the 61.8 extension area of the (a)-(b) which is at 55.00. I think this area can be seen realistically later in the coming years. The decline should continue lower most immediately while below the July 2019 highs, more importantly while below the December 2018 highs.
 

Elliottwave-Forecast

Master Trader
Feb 17, 2017
2,453
9
84
www.elliottwave-forecast.com
Hello fellow traders. In today's blog, we will have a look at the BMW stock. In my previous blog, we discussed the possibility in the Daimler stock and why the biggest rival is under pressure and should remain lower.

Today, we will have a look at the BMW stock which is the counterpart of Daimler (Mercedes).

BMW (Bayerische Motoren Werke AG) is a German multinational company which has its Headquarter in Munich Germany. They are known for there premium production cars and also for their motorcycles. BMW is one of the largest producers of motor vehicles. However, BMW also owns Mini and Rolls-Royce.

In the last couple of weeks, all german car manufacturer including BMW are getting hit seriously by the possible tariffs for the U.S. market which President Trump threatens to Europe carmakers.

Furthermore, the German economy is clearly in a slowdown which can be seen through the German Benchmark Index DAX, which has been trading sideways to lower recently. Germany is highly dependent on the automotive sector. With Daimler, BMW, Volkswagen, and Audi Germany is the largest premium car marker country in the world.

Having a look at the stock we can see that it is under pressure as well which can be also seen in the chart below. Let's have a look at the weekly price action and compare it to the Daimler AG.


BMW AG 08.26.2019 Weekly Chart Analysis


Daimler AG 08.22.2019 Weekly Chart Analysis


In the first chart above you can see that the stock ended the cycle up from its post-financial 2009 low at its 2015 peak. Below from there, it has been in the progress of correcting that in 3-7 or 11 swings. Same as Daimler (second chart). BMW broke below its 2006 low and also broke below its 2019 low. With that said, the stock has a 5 swings incomplete sequence from 2015 peak indicating that more downside should be in place. We can see that it reached the 61.8-76.40 extension area from 2015 peak. In the next coming days or weeks, we could see a bounce to correct cycle from 2018 before turning lower should take place.

BMW should ideally now see the equal legs from 2015 peak towards 37.21-22.92 area. This area can be used based on Elliott Wave Hedging for a good investment opportunity in favor of the German car markers again.

However, with the recent slowdown in the German economy. The German automotive sector will be weak. This put additional pressure on the recession fears which are currently going around.

Summarizing, the stock should see more downside in the next coming weeks and month into 37.21-22.92 area where a bigger reaction higher in favor of BMW should take place.
 

Elliottwave-Forecast

Master Trader
Feb 17, 2017
2,453
9
84
www.elliottwave-forecast.com
The world's largest medical cannabis producer by market cap, Canopy Growth (NYSE : CGC) reported earning two weeks ago. While revenue surged by nearly 250% year over year to 90.5 million Canadian dollars, it was down 59% from the previous quarter and more than 20 million Canadian dollars below the average analyst estimate which raised some concerns.

The company managed to sell a total of 10,549 kilograms of product, compared to 9,362 in Q4 and harvested 40,960 kilos, up 323% from the year-ago period's 9,685 kilo. The harvest was bigger than the 34,000 kilos that management had projected and it should translate to higher sales in the coming quarters.

Analyst are still optimist about Canopy growth expectation as the company is set to launch a variety of products, including cannabis-infused beverages, edibles, and vapes which is expected to find good demand in US and worldwide.

Canopy Growth Expectations


The technical picture for Canopy is clear in the weekly chart using Elliott Wave Theory to identify the current structure taking place :

Since IPO, CGC rallied higher 1600% in an impulsive 5 waves advance before ending that cycle last year at October peak $59.25 . Down from there, the stock started a classical 3 waves zigzag structure which remain in progress after breaking December 2018 low and aiming for the equal legs area $18.74 - $10.72 which is expected to find buyers at least for a 3 waves bounce from there.

Only a break above 2018 peak will confirm the start of a new bullish cycle higher so until that happens, the stock can remain trapped in a sideways range after bouncing from the blue box area or even do a double correction lower at a later stage.

Canopy Growth CGC Weekly Chart 08.26.2019


The blue boxes in our charts are the High-frequency areas where the market is likely to end cycles and make a turn. Consequently, CGC will provide a long term investment opportunity based on the technical extreme area provided in the above chart and also based on the optimistic expectation about the company which is looking to keep expanding.
 

Elliottwave-Forecast

Master Trader
Feb 17, 2017
2,453
9
84
www.elliottwave-forecast.com
US Dollar has been rallying strongly against Swedish Krona and Singapore Dollar for the past couple of months and have broken above significant peaks so in this blog, we would take a look at the cycles and sequences in USDSEK and USDSGD and present the next targets and also talk about what this means for US Dollar Index.

USDSEK (Swedish Krona) Cycle and Sequence from 1.31.2018
Chart below shows pair has recently broken above May 2019 peak and now showing incomplete bullish sequence from 1.31.2018 low against 9.21.2018 low and also from 9.21.2018 low against 6.25.2019 low. As far as dips hold above 6.25.2019 low, expect the rally to continue towards target area between 10.1694 - 10.5047 highlighted with a blue box.


USDSGD Bullish Sequence Since 1.25.2018 Low
USDSGD recently broke above 10.9.2018 peak which is labelled a/I in the chart below and break of this peak creates an incomplete bullish sequence from 1.25.2018 low against 1.31.2019 low. As dips hold above 7.1.2019 low and more importantly above 1.31.2019 low, expect the pair to continue higher and eventually reach target area between 1.4312 - 1.4518 which is highlighted with a blue box on the chart below.


USDSEK overlay with US Dollar Index
Chart below shows US Dollar Index overlaid with USDSEK and we can see USDX low in 2018 is similar 1.31.2018 low in USDSEK and 9.21.2018 low is the same in both USDSEK and USDX. Therefore, we can conclude that USDX would remain supported until USDSEK doesn't reach 10.16 - 10.50 area and USDSGD doesn't reach 1.43 - 1.45 area. Our strategy remains to keep looking for buying opportunities in the dips in 3, 7 or 11 swings and we don't like the selling.


Elliottwave-Forecast

Master Trader
Feb 17, 2017
2,453
9
84
www.elliottwave-forecast.com
Great Year for Precious Metals
Year 2019 certainly has been a good year for the Gold bulls. The metal accelerated its rally after President Trump announced 10% tariffs on the remaining $300 billion of Chinese imports. China then let the Yuan weaken and rise above 7 against the U.S. dollar for the first time in more than a decade. Currently, Gold's price is either near or at all-time high in most currencies except the U.S. dollar. Below, we can see the chart of Gold breaking to new all-time high against major currencies.


The chart below from Bloomberg shows the performance of world currencies against the U.S dollar. Precious metals get included as they do have the function similar to currencies. Central banks around the world also have them as a reserve. As the chart below shows, the top 4 best performing currencies against U.S dollar is all precious metals.


The top performing ETF in August is also related to the precious metals as the chart below shows. With bond yields going negative, many investors who want to reduce risk go to alternative instrument including commodities.


Gold to Silver Ratio Breaking Down


Overlay of Gold-to-Silver ratio chart together with Gold and chart above show an inverse correlation. We can see a period from 10.2008 to 4.2011 where the ratio went lower while the price of both precious metals rallied. We can also see a period from 4.2011 to end of 2015 when the ratio rose and the price of Gold and Silver both went lower. The ratio has recently started to turn lower again after forming a multi year high around mid 90s. The average of this ratio in the past 3 decades is around 60, and the natural earth ratio is currently 9. It means that for every 1 ounce of Gold mined from the earth, we can find 9 ounce of silver.


The ratio just last week decisively broke down and closed below the ascending trend line from April 2011. This suggests that more downside should be expected in coming months / years. With the ratio breaking down, and Gold breaking to new all time high against most world currencies, expect the precious metals to be the start performer in the months and years ahead.
 

Elliottwave-Forecast

Master Trader
Feb 17, 2017
2,453
9
84
www.elliottwave-forecast.com
Short Term Elliott Wave structure in 10 Year Notes (ZN_F) suggests the pullback to 129.28 ended wave 4. The note has resumed higher in wave V. The internal subdivision of wave V is unfolding as a 5 waves impulse Elliott Wave structure. Up from 129.28, wave 1 ended at 131.19 and wave 2 ended at 130.26. Internal of wave 2 subdivided as a running Flat. Wave ((a)) of 2 ended at 130.24, wave ((b)) of 2 ended at 131.17, and wave ((c)) of 2 ended at 130.26.

The Note has resumed higher and broke above wave 1 at 131.19. This suggests the next leg higher in wave 3 has started. Near term, while pullback stays above 130.26 in the first degree, and more importantly above 129.28, expect the Notes to extend higher. We don't like selling the Note, and expect buyers to appear once wave ((ii)) pullback is complete in 3, 7, or 11 swing. Potential target to the upside is 100% extension from August 23 low which comes at 132.1 - 132.3 area.

Ten Year Notes (ZN_F) 1 Hour Elliott Wave Chart


Elliottwave-Forecast

Master Trader
Feb 17, 2017
2,453
9
84
www.elliottwave-forecast.com
EQT Corporation is one of the largest natural gas exploration and pipeline companies in United State. The Energy giant has more than 130 years of experience and it continues to be a leader in the use of advanced horizontal drilling technology . It's also an integrated energy company with emphasis on natural gas exploration, production, gathering, and transmission.

EQT stock movement is heavily correlated with Oil ( CL_F ) and Natural Gas ( NG_F ), as we'll see in the coming chart that all 3 instrument are sharing the same cycle with same peaks in 2008 , 2014 and 2016. The only difference this time, is that EQT is adding another swing lower while the majority of Energy sector remains sideways waiting for it and other similar stocks to reach their targets before everything bounce higher at the same time.

EQT vs CL_F vs NG_F


If we count the swings starting from ATH in 2014 peak ( swings are different from Elliott wave count ), we notice that EQT is doing a larger 3 swing move lower (blue) that unfolds into 7 swings structure (purple) which has a target at equal legs area $8.68 - $0.41 area and expected to turn higher from there and produce at least a 3 waves bounce. The 7 swings count creates an Elliott Wave structure called Double Three which can be labeled in this case as (W) (X) (Y).

We can also notice that both cycle from 2014 peak and 2016 peak has a similar internal structure also divided into larger 3 swings (red) with internal 7 swings (black). Consequently, the entire decline taking place is considered as a correction which indicates that the stock will be looking for a reversal to take place after that cycle ends.

EQT Corporation Swings Count


EQT Corporation Elliott Wave Count
 

Elliottwave-Forecast

Master Trader
Feb 17, 2017
2,453
9
84
www.elliottwave-forecast.com
UUP Bullish Cycles from May 2011 lows

Firstly the dollar tracking ETF fund UUP inception date was 2/20/2007. Interestingly the dollar index has a low in March 2008. The UUP ETF fund shows a low in May 2011. The dollar index did make a pullback cycle low in May 2011 however it was well above the March 2008 lows. The bullish cycle up from the May 2011 lows in UUP is the focus of this analysis where it begins on the weekly chart. It should see some further upside before any larger size pullbacks relative to the longer term cycles.

The analysis continues below the UUP weekly chart.


Secondly the bullish cycle up from the May 2011 lows in UUP appears to be advancing higher with some overlap in the cycles. This is as per would any diagonal. However price has marginally got above the January 2017 highs giving the dollar representative instrument a bullish sequence. From the May 2011 lows the dollar instrument appears to have at least 4 swings in place to the January 2018 lows. From there according to the momentum indicators used here it ended a cycle up at the August 2018 highs in a 5th swing. The reason of that being the relatively short in price percentage or time pullback into the September 2018 lows. That was strong enough to suggest it was 6th swing correcting the cycle up from the January 2018 lows.

The analysis continues below the UUP daily chart.


Thirdly and in conclusion, the swing and Elliott Wave count suggests further upside in the dollar. The dollar is bullish while near term dips lower show they will remain above the January 2019 lows, more ideally the June 25th lows. It can see further strength higher toward the 28.26-29.28 area before a significant turn back lower
 

Elliottwave-Forecast

Master Trader
Feb 17, 2017
2,453
9
84
www.elliottwave-forecast.com
Short term Elliott Wave view in Amazon (AMZN) suggests that the rally from August 6, 2019 (1743.51) low is unfolding as a 5 waves impulsive Elliott Wave structure. We label the pullback to 1743.51 as wave (B). The stock is currently in wave (C) higher which should subdivide in 5 waves. Up from wave (B), wave 1 ended at 1800.01 with subdivision as another impulse of lesser degree. Wave 2 pullback ended at 1754.90 as a zigzag Elliott Wave structure.

The stock then resumes higher again and we can see an extension within wave 3. In Elliott Wave Theory, wave 3 typically is the strongest and longest wave, often at least 161.8% of wave 1. The move higher has now reached 161.8% Fibonacci extension of wave 1, thus wave 3 is nearing complete. Another leg higher can't be ruled out before ending wave 3 but regardless, wave 4 pullback is expected to happen sooner or later. Afterwards, Amazon should rally 1 more leg higher in wave 5 before ending wave (C) from August 6 low. Potential target to the upside is 100% of (A)-(B)-(C) from August 6, 2019 low which comes at 1859 - 1930.

AMZN 1 Hour Elliott Wave Chart


Elliottwave-Forecast

Master Trader
Feb 17, 2017
2,453
9
84
www.elliottwave-forecast.com
DJUSRE (Dow Jones Real Estate Index) recently broke above 2007 peak and it would be a good time to revisit the article we published back in 2017 about Real Estate Index and highlighted the target area above 2007 peak. We will also cover Proshares Ultra Real Estate ETF today and look at it's sequence from 2009 low, target area and also how it supports the path in DJUSRE.

DJUSRE Monthly Chart
Chart below shows Dow Jones Real Estate Index has broken above 2007 peak and focus remains on 455 - 528 area. We expect any dips to remain supported above December 2018 low for more upside towards the blue box area. When buying real estate you can do it for a flip or a long term investment. A flip means that the investor will bet in a fast increase in value and then sell the property for a quick cash. Timing will play a big role when buying for a quick gain as it needs to be done at the proper time. Improper timing can leave investors with a bad investment or like many like to call under the water. As DJUSRE Index has already broken above 2007 level, it could drive properties even to new all-time highs, but investors need to know that if they want to buy now, it is for a quick gain (flip) and not for the long-term Investment. Area between 455 - 542 should result in a much bigger pull back to correct the cycle from 2016 low at least and ideally from 2009 low. Once we do see a correction of at least the 2009 cycle, then we believe we would see the Index back at levels of Long-Term Investments.


Proshares Ultra Real Estate ETF
Below is the chart of Proshares Ultra Real Estate ETF which is showing an incomplete sequence up from March 2009 low with a target between 98.73 - 112.74 and in extension 135.42. In terms of Elliott wave count, we are either in wave 3 or C up from March 2009 low or we are forming a bullish nest i.e. in wave 1 of (3). In either case, we believe as far as dips hold above December 2018 low, Ultra Real Estate should remain supported in the dips for more upside towards 98.73 - 112.74 area from where a pull back should be seen to correct cycle from February 2016 low or March 2009 low. If rally extends to 135.42, it would become wave 3 before we get a pull back in wave 4 to correct cycle from February 2016 low and higher again.


Elliottwave-Forecast

Master Trader
Feb 17, 2017
2,453
9
84
www.elliottwave-forecast.com
General Motor's contract with the United Auto Workers expired late Saturday, leaving the union and company leadership to work out the next four-year contract.

The situation has been all over the news which can be misleading for traders. We at Elliottwave Forecast do not follow fundamentals news but what we follow is a system which is a combination of Elliott Wave Theory, sequences, cycles, distribution, and market correlation.

Looking at General Motors daily chart, we can see a very nice opportunity to come and we would like to share it to all followers around the World. The Elliott Wave Theory explains that after 5 waves advance there will be 3 waves back and then a continuation in favor of the 5 waves, as we presented in the following chart.


Graphic-2-1-300x300.jpg


General Motors is showing the same pattern since its 10.24.2018 lows and now it is doing 3 waves back. Have a look at the following chart.


It is very interesting to see the confluence between this chart and others.

The first one is that it bottomed before the World Indices did which is ending seeing a low at the secondary low in General Motors which is reflected in the chart.

Another point is that the instrument peaked in 8.1.2019. Which is about the same for World Indices. The cycle coming from 1.8.2019 peak ended blue (A) at 36 which happened at 8.28.2019. Above from there, it ended blue (B) at 40. Below from there, it is now expected to extend lower into the equal legs of blue (A)-(B) into 33.52-29.65.

If the instrument is ending making the dip into the 33.52 area, that will draw a very nice 5 waves up followed by 3 waves back which are the most common pattern in Elliott Wave Theory.

We at Elliott Wave Forecast not only rely on the Elliott Wave Theory for the Forecast.

We explained how the DAX and GM agree in most of there highs or lows. Now the DAX is about to break its July 2019 peak and that will create a bullish sequence. However, the index needs to pullback first. So we look at that pullback, as a chance for General Motors to dip. We also explained that Idea that DJUSRE took the peak at 2007 forming a Bullish Monthly sequence and calling for more upside, which also supports the idea of General Motors rallying to come into the $46.00-$52.00 area from our Blue Box.

As we always do, we look at the Market on a technical perspective despite the strike a rally should be happening soon. Watch the video below and get an idea of our work.
 

Elliottwave-Forecast

Master Trader
Feb 17, 2017
2,453
9
84
www.elliottwave-forecast.com
SPDR S&P 500 ETF (SPY) shows an incomplete sequence from June 3, 2019 low with a 100% extension target towards 306.3 - 313.2. In the chart below, we took the more aggressive view of the rally. We label the pullback to 273.09 on June 3 as wave ((2)). Wave ((3)) higher is in progress with subdivision as an impulse in lesser degree.

Up from 273.09, wave (1) ended at 302.23 as an impulse. Wave (2) pullback ended at 277.17. Up from there, wave 1 of (3) is expected to complete soon and the ETF should pullback in wave 2 to correct cycle from August 6, 2019 low in 3, 7, or 11 swing before the rally resumes. As far as pivot at 277.17 low stays intact, expect the ETF to extend higher. Possible target is 100% extension from June 3 low at 306.3 - 313.2. We don't like selling the ETF.

SPY 4 Hour Elliott Wave Chart


Elliottwave-Forecast

Master Trader
Feb 17, 2017
2,453
9
84
www.elliottwave-forecast.com
Hello fellow Traders. The Dow Jones Transportation Average is showing why the biggest acceleration across World Indices has already passed. The Elliott Wave Theory classic pattern is represented in the following chart which shows the idea of a 5 waves advance followed by a 3 waves pullback.


The basic Elliott Wave pattern is a sequence of 5 waves in different degrees until the higher degree get resolved and the number of swings is completed. The following numbers of swings are 5-9-13-17-21-25 which provide traders with an amazing hedge to anticipate the possible turn in the market.

The idea is that after the acceleration in wave ((3)) of III the market will do a series of ((4))-IV-(IV) pullbacks until the move ends. The following chart is showing the Dow Jones Transportation which is showing a very nice impulse since its all-time lows.


Dow Jones Transportation Index Quarterly Elliott Wave view 9.16.2019


In the chart above we can see that wave ((3)) already happen and a series of IV-(IV) will be coming going into the future. At this stage, we are calling red wave IV completed.

From its December 2018 low red wave V is proposed to end by the third quarter of 2020 at this stage.

The main message is that the biggest acceleration across Global Indices already passed. Even when the main trend is higher based on market correction and swings counts, we need to be careful of what to anticipate. The following chart is showing an overlay of the Dow Jones Transportation Average and the Dow Jones of Real Estate.


Dow Jones Transportation Index vs Dow Jones of Real Estate overlay


Dow Jones of Real Estate Quarterly chart 9.16.2019


The chart above is showing more upside into the Blue Box in the Dow Jones of Real Estate which is an example of why more upside should be taking place. When and where the end of the wave (III) should be happening. To summarize a very technical Market overall which is presenting signs to worry.
 

Elliottwave-Forecast

Master Trader
Feb 17, 2017
2,453
9
84
www.elliottwave-forecast.com
Bank Of America (NYSE: BAC) recovered 50% of the 2008 financial crisis crash while majority of banks already rallied back to new all time highs. The stock is still showing positive signs as the rallies taking place since 2009 low are unfolding as an Elliott Wave impulsive structure.

BAC recent daily rally from 2016 low was an impulsive 5 waves advance which ended on March 2018 peak. Down from there, the stock entered a consolidation period of time to correct the previous cycle before it can resume the main bullish trend.

The decline from $33 peak was a corrective 3 swings move which ended on December 2018 before the stock started bouncing again without making new highs. The overall shape of the moves during the recent 2 years formed an inverted head and shoulder pattern which usually appear at the end of a bearish trend to indicate a reversal. However, it can also be used as a continuation pattern within a bullish trend which can be the case for BAC as long as it remains above $22.6 low.

BAC Weekly Chart


The inverted head and shoulder pattern needs a conformation with a clear breakout of its neckline and ideally taking the previous peak to open a higher high sequence indicating the resumption of the trend. Consequently, BAC needs an initial break above April 2019 peak $31 followed by a break above $33 to open a new incomplete bullish sequence and aim for a target higher around $36 - $39 area.

Inverted Head & Shoulder Pattern
 

Elliottwave-Forecast

Master Trader
Feb 17, 2017
2,453
9
84
www.elliottwave-forecast.com
The TLT Longer Term Cycles and Elliott Wave Analysis

Firstly the ETF fund TLT inception date was on July 22, 2002. This instrument seeks to track the investment results of an index composed of or in U.S. Treasury bonds with maturities twenty years or more remaining. There is a lack of data before July 22, 2002. This is established. This article will focus on the larger uptrend cycle from there which is presumed finished a cycle higher from those lows in wave ((a)) in July 2016. The pullback from that high appeared to be an Elliott wave zig zag structure in three waves into the November 2018 wave ((b)) lows.

The analysis continues below the monthly chart.


Secondly: The aforementioned pullback lower in the monthly chart wave ((b)) was strong enough to suggest it was correcting the cycle up from the all time lows. Thus it ended that cycle. From those November 2018 lows the instrument has made another high above the July 2016 highs creating a bullish sequence. This sequence higher from the November 2018 lows appears to be incomplete. On the weekly chart shown below, Elliott wave corrective sequences are in either three, seven or eleven swings. Impulses are in either five, nine or thirteen swings. It is obvious the three swings lower the July 2016 highs into the October 2018 lows were of three swings.

The analysis continues and concludes below the weekly chart.


Thirdly and in conclusion the cycle up from the October 2018 lows appears to be an impulse that is incomplete. The pullback to the 136.54 lows on 9/13/19 is favored ended wave IV. This is due to the bounce from there being strong enough to suggest it ended the cycle lower from the wave III highs which were of three swings in a flat. The article here is how to get the proposed fifth wave target area. While above there it can see the 151.51-159.21 area in wave V before a larger pullback develops to correct the cycle up from the October 2018 lows.
 

Elliottwave-Forecast

Master Trader
Feb 17, 2017
2,453
9
84
www.elliottwave-forecast.com
Hello fellow traders. In today’s blog, we will have a look at the Lufthansa AG stock. The stock is listed in the DAX 30.

Lufthansa AG is the biggest German airline and has a lot of subsidiaries. And when combining them together Lufthansa is the biggest airline in Europe in terms of a passenger airline. The company has its Headquarter in Cologne Germany. The airline is also one of the founding members of the so-called Star Alliance, which is the world largest airline alliance.

In the last couple of weeks, Lufthansa has some company intern problems which reflecting the current stock price. Moreover, due to the Oil attacks against Saudi Arabia, the company was suffering as well, due to its demand for Oil.

The stock is currently under serious pressure which can be seen in the chart below. Let’s have a look at the weekly price action and what to expect for the company.


Lufthansa AG 09.29.2019 Daily Chart Analysis


In the chart above you can see that the stock ended the cycle up from its all time low at its 2018 peak. Below from there, it has been in the progress of correcting its all-time low cycle in 3-7 or 11 swings. Recently, Lufthansa broke below its 2018 low. With that said, the stock has now an incomplete sequence from 2018 peak indicating that more downside should be becoming. We can see that it reached the 61.8-76.40 extension area from 2018 peak.

From there it has been bouncing higher and it could end up correcting internal cycle from 2/26/2019 peak in 3-7 or 11 swings before initial downside should be seen. Lufhansa should ideally now see the equal legs from 2018 peak towards 9.22-5.80 area. This area can be used based on Elliott Wave Hedging for a good buy investment opportunity. Summarizing, the stock should see more downside in the next coming weeks and month into 9.22-5.80 area where a bigger reaction higher in favor of the Lufthansa stock should ideally be taking place.
 

Elliottwave-Forecast

Master Trader
Feb 17, 2017
2,453
9
84
www.elliottwave-forecast.com
Hello fellow traders. In this technical blog we’re going to take a quick look at the Elliott Wave charts of GBPNZD, published in members. As our members know, GBPNZD recently corrected cycle from the 07/30 low. Pull back has unfolded as Elliott Wave ZIG ZAG pattern. After the pull back completed we got expected rally when the pair broke 08/28 peak confirming further extension higher within the cycle from the 1.828 low. In further text we’re going to explain the forecast and Elliott Wave Pattern.

Before we take a look at the real market example, let’s explain Elliott Wave Zigzag pattern.

Elliott Wave Zig Zag Pattern
Elliott Wave Zigzag is the most popular corrective pattern in Elliott Wave theory . It’s made of 3 swings which have 5-3-5 inner structure. Inner swings are labeled as A,B,C where A =5 waves, B=3 waves and C=5 waves. That means A and C can be either impulsive waves or diagonals. (Leading Diagonal in case of wave A or Ending in case of wave C) . Waves A and C must meet all conditions of being 5 wave structure, such as: having RSI divergency between wave subdivisions, ideal Fibonacci extensions and ideal retracements.

At the graphic below, we can see what Elliott Wave Zigzag structure looks like. 5 waves down in A, 3 waves bounce in B and another 5 waves down in C.


Now, lets’ take a look what Elliott Wave Zigzag looks like in the real market.


GBPNZD 1 Hour Elliott Wave Analysis 9.2.2019
As we can see on the chart, we are getting 3 waves down in wave B red pull back. Pull back is unfolding as ((a))((b))((c)) Elliott Wave Zig Zag pattern. First leg ((a)) has made a very sharp decline, which is obviously impulsive structure. ( 5 waves are not labeled on this chart but they’re vissible on lower time frames) . Then we got 3 wave bounces in wave ((b)). And finally another leg down ((c)) that should be unfolding as a 5 waves structure. At this moment we are calling Zig Zag incomplete, looking for a more short term weakness toward blue box area : 1.91154-1.8957. At mentioned zone buyers should ideally appear for proposed rally or 3 waves bounce alternatively.

As our members know , Blue Boxes are no enemy areas , giving us 85% chance to get a bounce.


GBPNZD 1 Hour Elliott Wave Analysis 9.3.2019
At this moment we are calling Zig Zag completed at 1.8993 low. As far as the price stays above that level, we expect further rally in the commodity pair. We would like to see further separation from the 1.8993 low and ideally break above A red peak ( 08/28 ) to confirm next leg up is in progress.

You can learn more about Zig Zag Elliott Wave Patterns at our Free Elliott Wave Educational Web Page.


GBPNZD 1 Hour Elliott Wave Analysis 9.13.2019
1.8993 low held well and we got proposed rally as expected. Eventually the price has broken above 08/28 peal confirming next leg up is in progress. We expect further strength in the pair within the cycle from the 07/30 low.

Keep in mind that market is dynamic and presented view could have changed in the mean time. You can check most recent charts in the membership area of the site. Best instruments to trade are those having incomplete bullish or bearish swings sequences. We put them in Sequence Report and best among them are shown in the Live Trading Room.