Elliott Wave Analysis by EWF

Hello traders. As our members know, we have been long the NASDAQ since price reached our Blue Box buying zone in March. Since then, the index has gained more than 25% in less than six months. In this technical article, we will examine another Elliott Wave trading setup that developed in E-mini Nasdaq-100 Futures (NQ_F).

NQ_F Elliott Wave 4 Hour Chart 03.22.2026​

The chart below shows the trading setup presented to our members. At that time, NQ_F was developing a three-wave pullback. The decline from the main peak, showed incomplete bearish sequences, suggesting that the corrective structure had not yet finished. As our members know, we consistently emphasize the importance of incomplete sequences, as they help determine the market’s most likely path. The structure pointed to additional weakness toward the Equal Legs area at 23831-22280. We identified this region as our Blue Box buying zone, where we planned to re-enter the market as buyers.

Did you know ? 90% of traders fail because they don’t understand market patterns. Are you in the top 10%? Test yourself with this advanced Elliott Wave Test

Official trading strategy on How to trade 3, 7, or 11 swing and equal leg is explained in details in Educational Video, available for members viewing inside the membership area.

Quick reminder on how to trade our charts :

Red bearish stamp+ blue box = Selling Setup
Green bullish stamp+ blue box = Buying Setup
Charts with Black stamps are not tradable.


NQ_F Elliott Wave 4 Hour Chart 08.09.2026​

NASDAQ completed the expected decline into our Blue Box buying zone, where buyers entered the market as anticipated. From our entry at 23,831, NQ_F staged a powerful rally to new highs above 30,000, representing a gain of more than 25% in less than six months.

Note: Certain labels have been removed from the chart. Our members receive the complete version with all labels and additional details.

Our member chat rooms are open 24/7 and provide ongoing expert guidance on market trends and Elliott Wave analysis. Members are encouraged to ask questions about market structure and technical setups at any time.


Source: https://elliottwave-forecast.com/in...a-25-rally-from-our-elliott-wave-buying-zone/
 
The semiconductor sector (SMH) remains supported by strong AI infrastructure spending over the next three months. Nvidia recently projected roughly 70% revenue growth for its next fiscal year. Meanwhile, hyperscaler AI spending continues at extraordinary levels, supporting demand for GPUs, memory, networking, and semiconductor equipment. This matters greatly for SMH because Nvidia represents about 23% of the ETF. TSMC, Broadcom, AMD, Micron, and ASML also carry significant weights. Therefore, strong earnings and sustained AI capital spending could limit the depth of the current correction.

However, several fundamental risks could support the deeper wave ((II)) scenario toward the 431.39–327.14 blue box. First, semiconductor valuations already reflect very strong growth expectations, leaving little room for earnings disappointments. Recent AMD and Marvell reactions showed how quickly investors can punish results that fail to exceed expectations. Additionally, persistent inflation could force the Federal Reserve to raise rates, increasing pressure on high-growth technology valuations. Further U.S.-China restrictions could also disrupt semiconductor sales and equipment demand. Finally, slower AI spending, margin pressure, or weaker guidance from major SMH holdings could accelerate the correction. If several risks emerge together, fundamentals will increasingly support the deeper wave ((II)) decline shown on the chart.

Elliott Wave Outlook: SMH Daily Chart June 13th, 2026

Elliott Wave Outlook: SMH Daily Chart June 13th, 2026


Back in June, we were expecting SMH to continue advancing from the wave (IV) low within wave (V). We viewed that move as the final leg of the larger impulse, which usually shows slower acceleration and signs of exhaustion. At that time, the internal structure suggested a mature fifth wave. Therefore, we were looking for the cycle to complete within the 665–700 area, where the Fibonacci extensions and the final impulse projections converged.

Once wave (V) completed inside that zone, we expected the market to enter a decisive corrective phase with two possible paths. The first was the deeper scenario, shown by the black path, where SMH would develop a higher-degree wave ((II)) and correct the entire cycle from the 2022 lows. That outcome implied a stronger and more prolonged decline. The second was the orange path, where the market would only correct the cycle that started on June 9. In that case, we expected a more moderate pullback in three or seven swings before the bullish trend resumed. The key level separating both scenarios was the wave IV low. A break below that level would confirm the deeper wave ((II)) correction. As long as it held, we continued to favor the more moderate corrective scenario.

Elliott Wave Principle Behind the Market Structure​

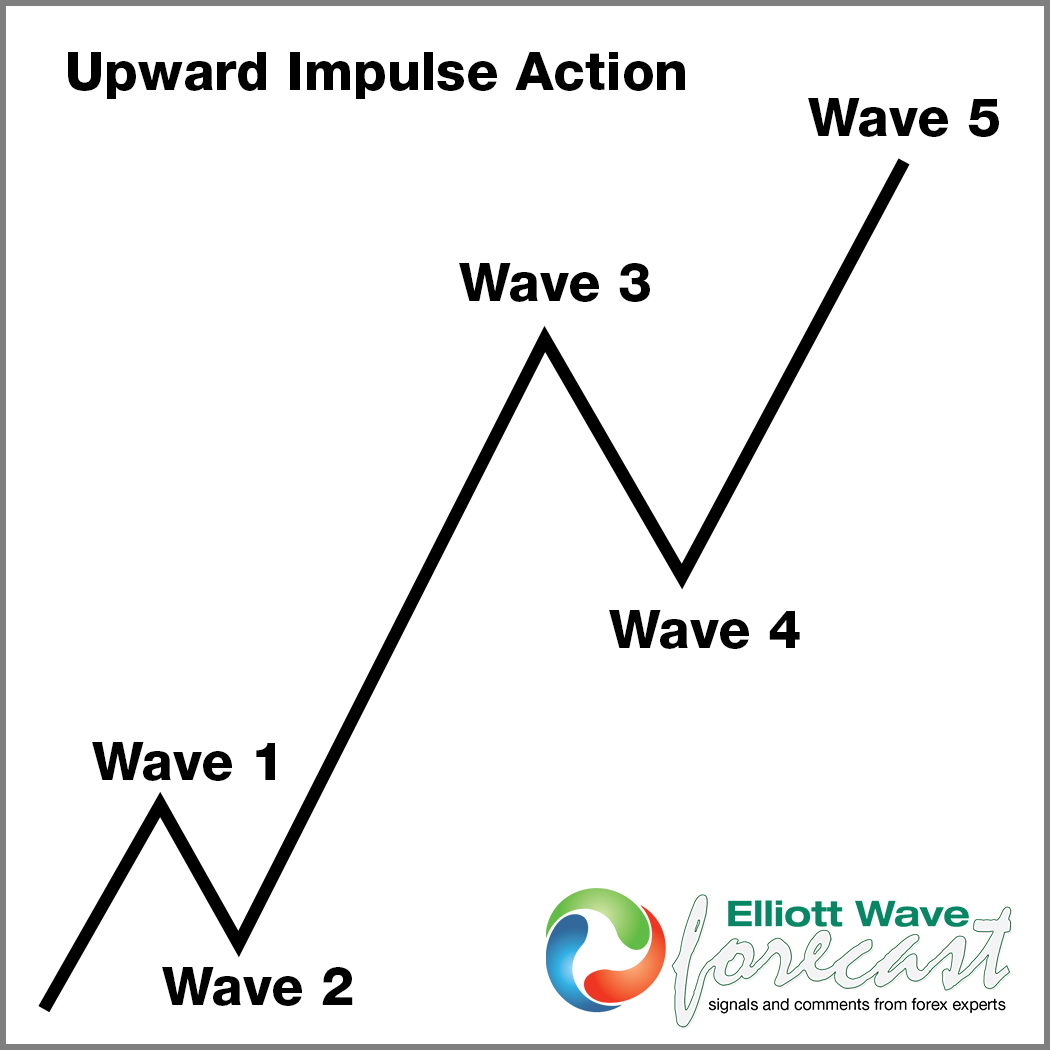
Impulse

An impulse is a clean 5‑wave pattern that drives the trend forward.

  • Waves 1‑3‑5 are strong and directional.
  • No overlap between waves 1 and 4.
  • Wave 3 is usually the strongest.
  • Structure is clear, with increasing momentum.

ChatGPT-Image-3-mar-2026-07_24_10-a.m.png

Wave Extensions


Extensions occur when one impulsive wave becomes significantly longer and more powerful than the others.

Most commonly, wave 3 extends, creating the longest and most explosive leg.
An extended wave subdivides into a clear, elongated 5‑wave pattern.
The other two impulsive waves remain shorter and more proportional.
Extensions highlight where the market’s strongest momentum is concentrated.
EXTENsION3.jpg


Elliott Wave Outlook: SMH Daily Chart August 28th, 2026

Elliott Wave Outlook: SMH Daily Chart August 28th, 2026


SMH completed a strong impulsive advance from the 2025 low into wave ((I)). The rally also completed within the target area we were looking for. Since then, price has entered a larger corrective phase. The current structure favors a (w)-(x)-(y) double correction.

Wave (w) completed the first decline, while wave (x) produced the corrective rebound. We cannot fully confirm that wave (x) has ended yet. However, the rebound looks sufficient to label the connector complete for now. Therefore, we expect wave (y) to develop lower through an a-b-c structure.

The next key confirmation will come from a break below the wave (w) low. That break would strengthen the bearish sequence and increase the probability of reaching the 431.39–327.14 blue box. We expect wave c of (y) to complete the larger correction inside that area.

However, a break above wave ((I)) would invalidate the projected decline. That move would suggest wave ((II)) already ended at the wave (w) low. Until then, the preferred path remains lower toward the blue box.

The long-term outlook remains bullish while price stays above 170.50. We expect buyers to appear inside the blue box and resume the larger bullish trend.

Source: https://elliottwave-forecast.com/stock-market/smh-warning-major-correction-coming/
 
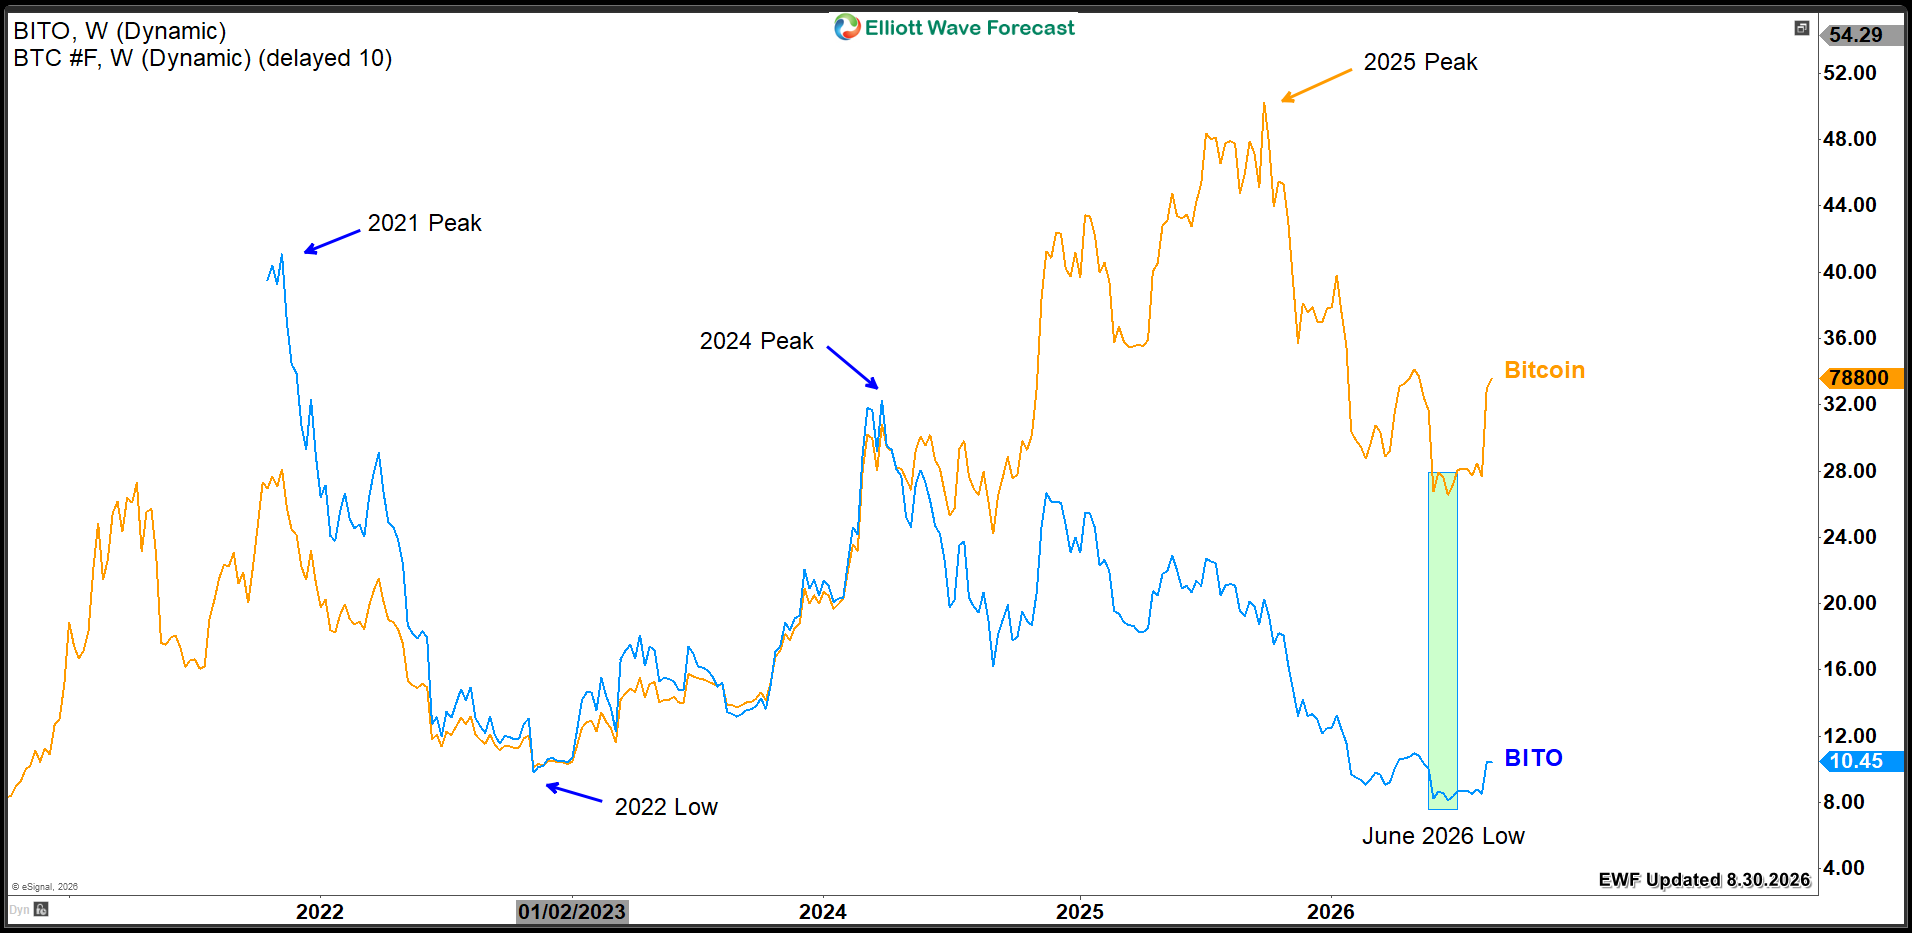
BITO ProShares Bitcoin ETF (NYSE: BITO) dropped 82% since its 2021 launch. It also showed persistent divergence from Bitcoin's price action in recent two years. The ETF failed to make new highs in the last cycle and it even peaked earlier in 2024 before dropping 76%. In today's article, we review the technical Elliott Wave structure currently unfolding. Our analysis explains the potential bullish path tied to Bitcoin's recent surge.

The weekly chart overlays BITO and BTC to compare their cycle oscillations. Since BITO's 2021 launch, they shared a clear positive correlation. They moved together in both highs and lows until the 2024 peak. Then, a divergence emerged in the magnitude of their moves. Bitcoin continued rallying to new all-time highs, peaking in October 2025. Meanwhile, BITO remained within a sideways range. Then, both started dropping together in the recent bear market until June 2026.

BITO VS Bitcoin​

Bito vs Bitcoin 2026
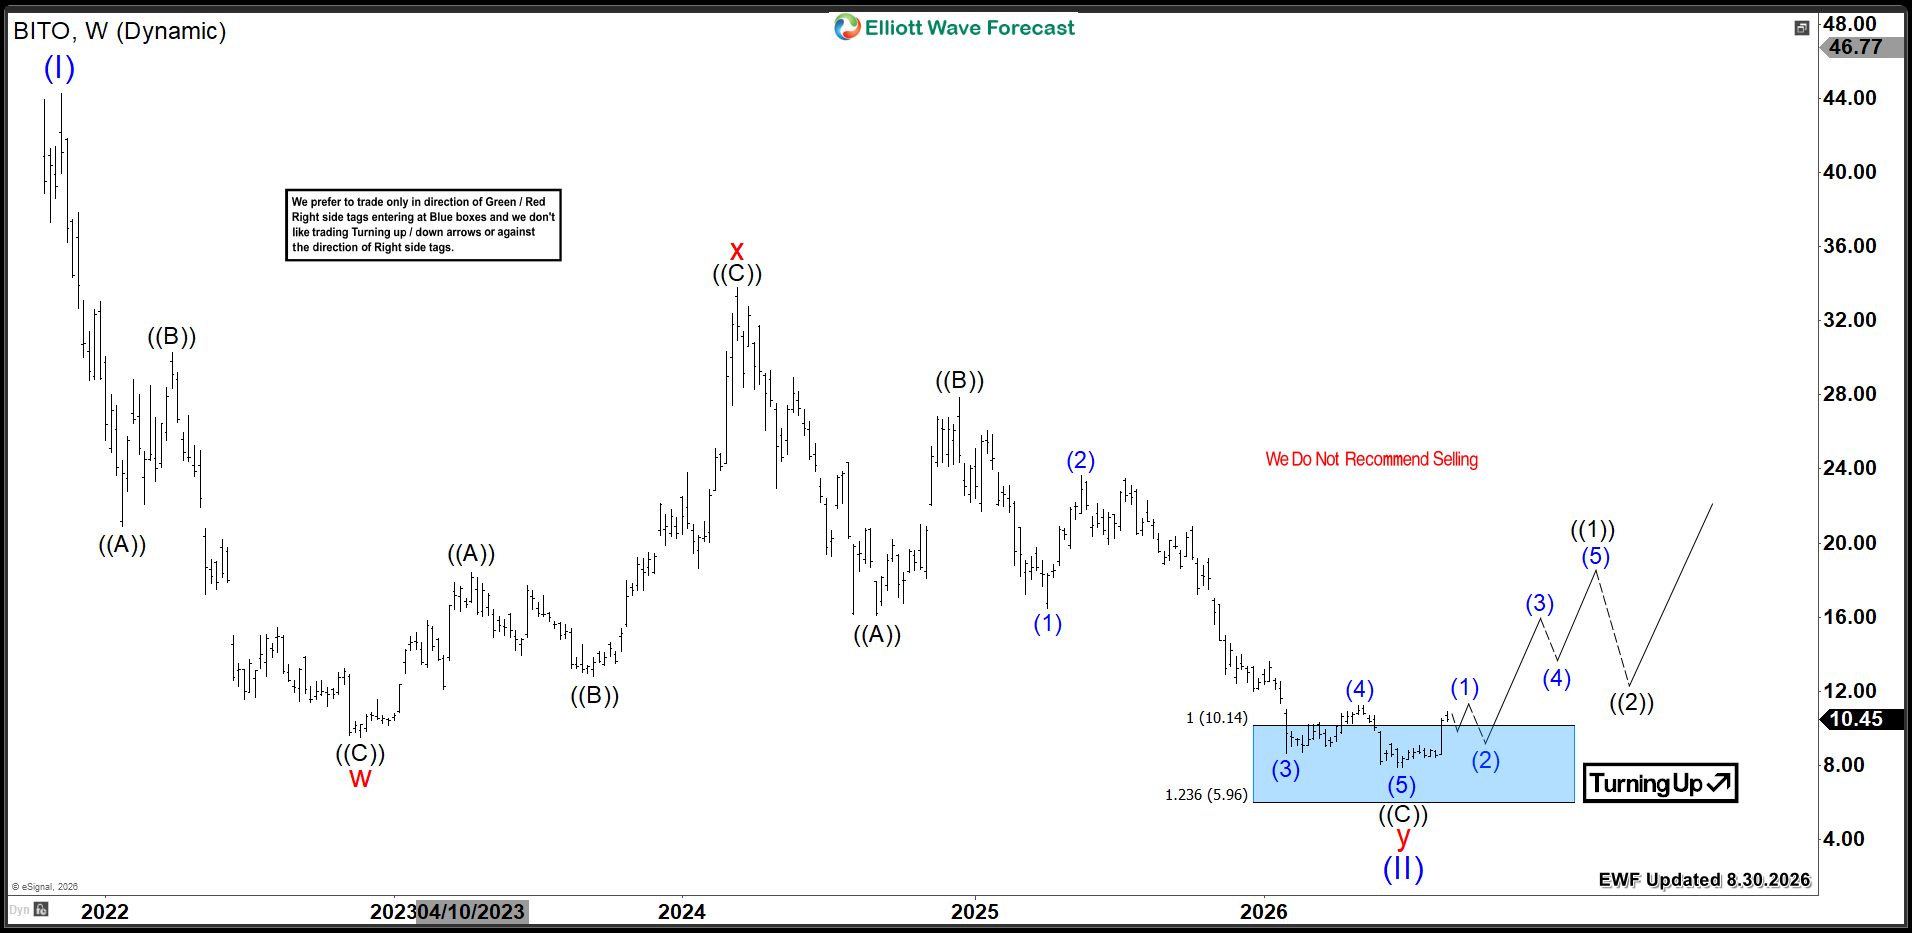
From its 2021 peak, BITO declined within a seven-swing structure. This pattern is labeled as a double three (W-X-Y). The internal Y leg consists of a zigzag three-wave structure (A-B-C). Most importantly, the price decline reached the $10.14 - $5.96 measured equal legs. This area appears as the Blue Box zone on our chart.

This extreme area is designed to identify a potential reversal zone. The market should react here as buyers enter looking for the next bullish cycle to begin from this level. Consequently, we expect BITO to build an impulsive structure over the coming months. This should occur from the Blue Box area. Bitcoin's price must also hold the summer low to support this move.

BITO Weekly Chart 8.30.2026​

BITO Bitcoin Weekly Chart

Source: https://elliottwave-forecast.com/video-blog/bitcoin-etf-bito-blue-box/
 
Cameco Corporation (CCJ) is one of the world’s largest publicly traded uranium producers. The company's headquarter is located in Canada and widely recognized as a key supplier to the global nuclear energy industry. The company’s operations span mining, milling, and fuel services, positioning it as a central player in the uranium supply chain. We will look at the long term technical outlook for the stock using Elliott Wave technique.

Cameco ($CCJ) Monthly Elliott Wave Chart​

Cameco-Alternate20260831120225.jpg


The monthly Elliott Wave chart for Cameco (CCJ) indicates that wave (II) of the Super Cycle bottomed at $5.17 in March 2020. From that low, the stock began a new impulsive advance in wave (III). Wave I of (III) concluded earlier this year at $135.24. A corrective pullback in wave II of (III) completed at $83.15. To rule out the risk of a double correction, the stock must break above the prior wave I peak at $135.24. In the near term, while price action holds above $5.17, dips should attract buyers in either three- or seven-swing structures.

$CCJ Daily Elliott Wave Chart​

Cameco-Daily20260831121126.jpg


The daily Elliott Wave chart of Cameco (CCJ) shows that wave I in Cycle degree completed earlier this year at $135.24. The subsequent wave II unfolded as a double three corrective structure. Wave ((W)) ended at $100.11, wave ((X)) at $131.21, and wave ((Y)) at $83.15, completing wave II. From that low, the stock has turned higher, with the rally unfolding in five waves. This indicates further upside potential. Near term, as long as price remains above the wave II low at $83.15, and more importantly above $35.85, pullbacks should attract buyers in either three- or seven-swing sequences, supporting continuation to the upside.

CCJ Elliott Wave Video​


Source: https://elliottwave-forecast.com/vi...ullish-trend-as-elliott-wave-correction-ends/
 
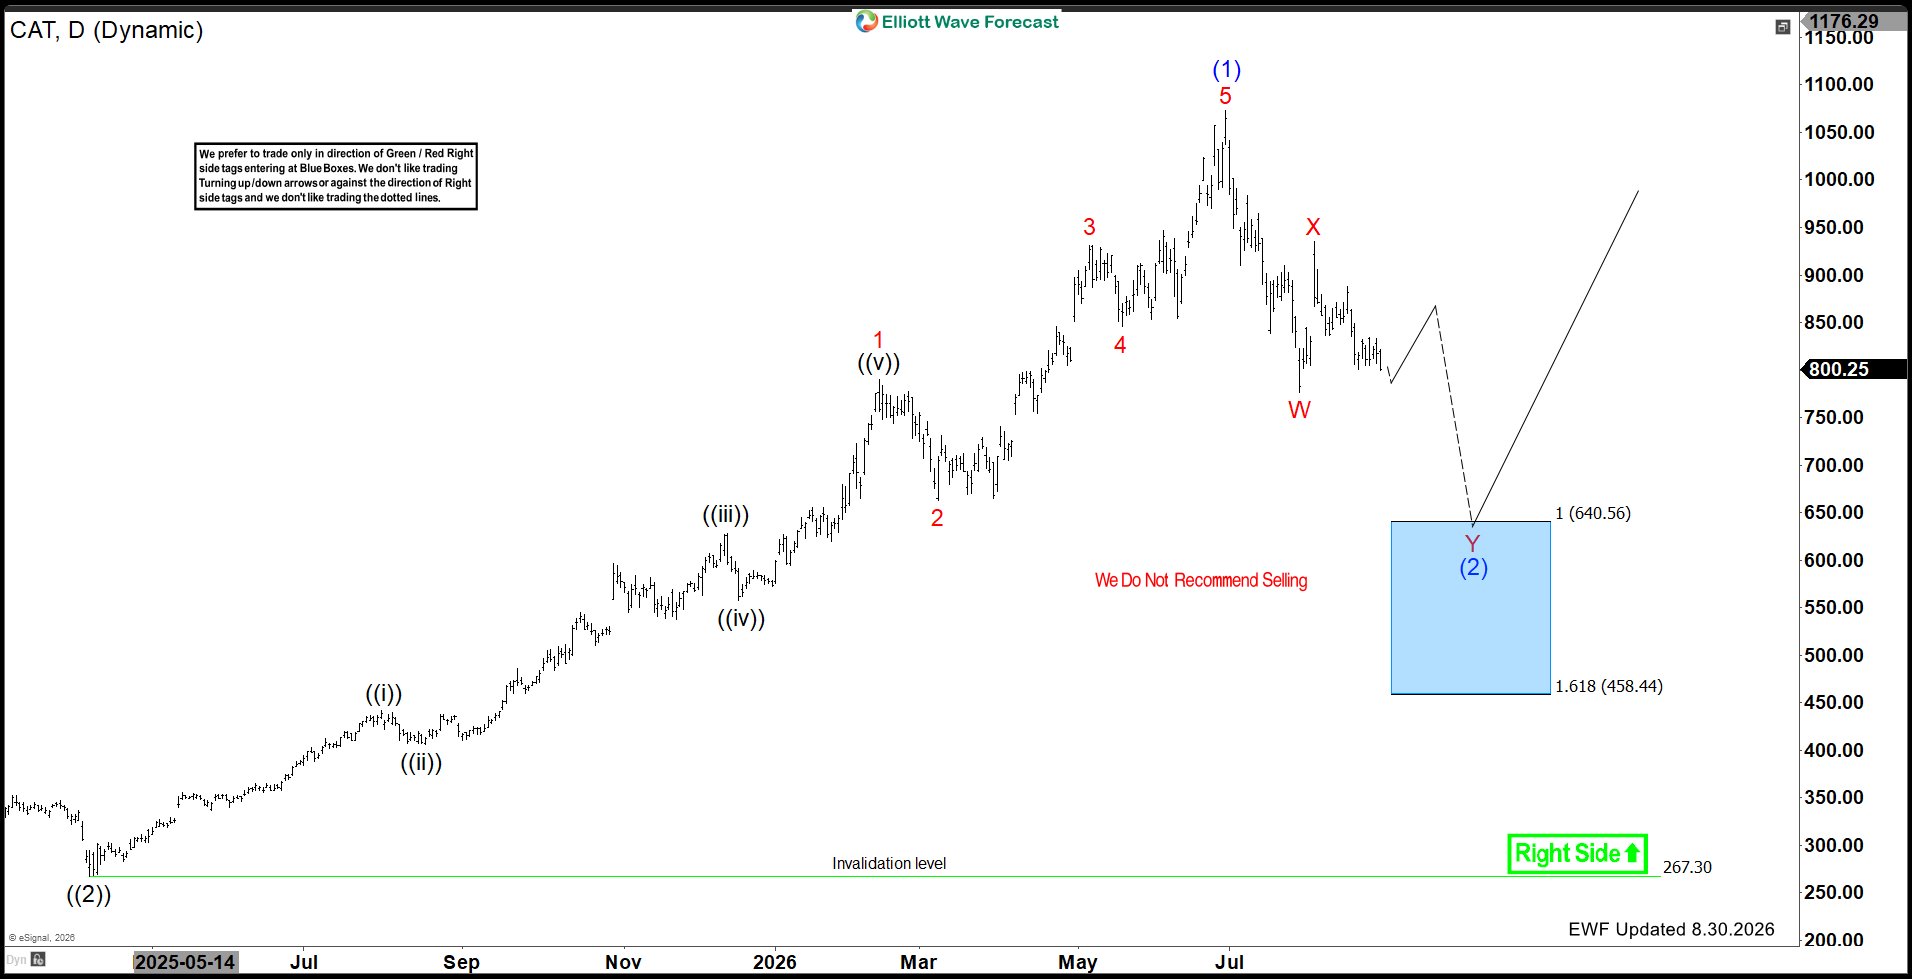
In this Elliott Wave update, we examine the latest structure in Caterpillar Inc. ($CAT). The stock completed a powerful 5-wave advance from the April 2025 low, which ended the bullish cycle into the 2026 peak. Since then, price has turned lower and is now correcting that entire advance.

5 Wave Impulse + 7 Swing WXY correction​

$NVDA


The current decline is expected to unfold in a 7-swing W-X-Y structure. Therefore, although temporary rebounds can occur along the way, the correction likely needs additional downside before the next major bullish opportunity develops. The key area to watch comes at the 640.56–458.44 Blue Box Area, where buyers are expected to enter and the next long opportunity should appear.

$CAT Completed 5 Waves From the April 2025 Low​

$CAT

Looking at the daily chart, $CAT established an important low in April 2025 and then began a strong impulsive advance.

The rally developed through a clear sequence of five waves. Waves 1 through 4 built the bullish structure before wave 5 eventually extended into the 2026 high. Consequently, the advance from the April 2025 low can now be counted as a completed 5-wave impulse in wave (1).

Once a five-wave cycle ends, Elliott Wave theory calls for a correction against that entire advance. That corrective process now appears to be underway.

Correction Is Developing as a 7-Swing W-X-Y Structure​

Rather than expecting a simple straight-line decline, the current structure favors a more complex 7-swing correction labeled W-X-Y.

The first decline is being counted as wave W. From there, $CAT produced a corrective recovery in wave X before sellers returned for another leg lower in wave Y.

This sequence would complete the larger wave (2) correction against the April 2025 low.

Therefore, a short-term rally should not automatically be interpreted as the beginning of a new bullish cycle. Instead, another decline can follow after.

Blue Box Area Marks the Next Long Opportunity​

Most importantly, the projected wave Y decline points toward the Blue Box Area between 640.56 and 458.44.

This zone represents the 100%–161.8% Fibonacci extension of the corrective sequence and stands out as the next high-frequency reversal area.

As $CAT approaches that region, selling pressure should begin to fade and buyers can start looking for the next long opportunity. For that reason, we do not favor selling once price reaches the Blue Box.

Instead, the preferred strategy will be to look for a bullish reaction from 640.56–458.44 in anticipation of the next larger advance.

Short-Term Bounces Can Occur First​

Before the Blue Box is reached, $CAT can still produce a meaningful rebound to correct wave X. The chart allows for a recovery from current levels before the larger correction resumes.

However, as long as the W-X-Y structure remains incomplete, that rally should be viewed as corrective.

Once the bounce ends, another decline in wave Y can take $CAT toward the projected Blue Box support area and complete wave (2).

Larger Bullish Structure Remains Intact​

Although $CAT is currently correcting, the larger picture remains constructive.

The decline is expected to correct the powerful 5-wave advance from April 2025 rather than reverse the entire long-term bullish trend. Once wave (2) completes, the stock can begin the next major bullish cycle.

The broader bullish structure remains valid above the 267.30 invalidation level. Therefore, the larger right side continues to favor higher prices once the current correction finishes.

Technical Summary​

To summarize, $CAT has completed a 5-wave bullish cycle from the April 2025 low and is now correcting that advance.

The preferred Elliott Wave structure calls for the pullback to unfold in a 7-swing W-X-Y correction. Most importantly, the 640.56–458.44 Blue Box Area represents the next major support zone and the area where the next long opportunity awaits.

Once the 7-swing correction completes there, buyers can look for the larger bullish trend to resume.

$CAT Elliott Wave Video Analysis

[video width="1920" height="1080" mp4="[URL]https://elliottwave-forecast.com/wp-content/uploads/2026/08/Debut-2026-08-31-11_03_21.mp4[/URL]" poster="[URL]https://elliottwave-forecast.com/wp-content/uploads/2026/08/cat.png[/URL]"][/video]

Source: https://elliottwave-forecast.com/vi...-2025-as-7-swing-correction-targets-blue-box/
 
Valero Energy Corporation., (VLO) manufactures, markets & sells petroleum based & low-carbon liquid transportation fuels & petrochemical products in the US, Canada & internationally. It comes under Energy sector & trades as “VLO” ticker at NYSE.

In weekly, VLO favors impulse sequence in ((3)) of I of (III). It should continue rally into $367.8 - $396.34 area to extend sequence from June-2026 low before correcting next. We like to buy the next pullback in ((4)) in 3, 7 or 11 swings at extreme area.

In weekly, it ended (I) of ((III)) at $184.79 high (4.05.2024) & (II) at $99.00 low (4.07.2025). Above there, it favors rally in I of (III). Within I of (III), it ended ((1)) at $155.12 high, ((2)) at $130.78 low & favors rally in (5) of ((3)) against 6.18.2026 low. It placed (1) of ((1)) at $117.39 high, (2) at $105.87 low, (3) at $142.93 high, (4) at $133.27 low & (5) at $155.12 high. Within ((3)), it ended (1) at $178.43 high, (2) at $155.29 low, (3) at $265.61 high, (4) at $232.72 low & favors rally in (5). It is having extended (3) & (5) in ((3)). Within (3), it ended 1 at $185.62 high, 2 at $159.90 low, 3 at $258.43 high, 4 at $214.71 low & 5 at $265.61 high.

VLO - Elliott Wave Latest Daily View:​

VLO-D2.jpg

Above (4), it ended 1 of (5) at $320.24, 2 at $291.45, 3 at $352.70, 4 at $335 & favors 5 towards $367.8 - $396.34 area. It is bullish in daily & expect buyers to re-enter in the pullback of 3, 7 or 11 swings in ((4)) later. If it breaks below $335 low, it can be correcting in ((4)), while placed ((3)) at last peak. In that case, ((4)) should pullback between 0.236 – 0.382 Fibonacci retracement level of ((3)) before rally continue. If it breaks above $396.35, then it can see even more upside as 3 red marked can turn smallest within (5), which is not allowed.

VLO - Elliott Wave Daily View From 8.03.2026:​

VLO-D1.jpg

Source: https://elliottwave-forecast.com/stock-market/vlo-upside-target-367-8-396-34-with-pullback-ahead/
 
Hello, fellow traders. In this technical blog, we’re going to take a quick look at the Elliott Wave charts of Exxon Mobil Corporation (XOM) stock, published in the members’ area of the website.

Recently, XOM completed a three-wave structure from the peak, unfolding as an Elliott Wave Double Three pattern. The stock found buyers right at the Equal Legs zone. In the following analysis, we will examine the Elliott Wave structure in detail and present the key invalidation and target levels.

XOM Elliott Wave 1 Hour Chart 08.26.2026​

XOM stock is correcting the cycle from the 149.08 low. The price structure of the pullback looks incomplete at the moment. The current view suggests more short-term weakness before the next rally takes place.

As our members know, we identify the reversal/buying zone by measuring the W-X Equal Legs area using the Fibonacci Extension tool. In this case, the Equal Legs zone comes at 158.11–154.14. From this area, we expect buyers to step in and regain control, potentially driving the price higher in a three-wave bounce.

You can learn more about Elliott Wave Patterns at our Free Elliott Wave Educational Web Page


XOM Elliott Wave 1 Hour Chart 08.31.2026​

The stock found buyers at the Equal Legs zone, producing a solid reaction from that area. The pullback is counted complete at the 155.46 low. As a result, any long positions taken from the Equal Legs zone should be risk-free by now.

The rally from the Equal Legs zone looks impulsive, so we have labeled it as wave ((i)) of a new bullish sequence. The 155.46 low is the key level at this stage. As long as the price stays above that level, the next wave higher can be in progress, targeting the 171.6+ area.

Important note: Our analysis is not based on Elliott Wave in isolation. We perform detailed higher-time-frame cycle analysis, which shows an incomplete market structure. This is one of the key drivers of price action, along with correlation analysis and broader market context.

Keep in mind that the market is dynamic, and the outlook may have changed in the meantime. Our member Chat Rooms are open 24 hours a day, Monday through Friday, on trading days, providing ongoing expert guidance on market trends and Elliott Wave analysis. Members can ask questions about market structure and technical setups at any time during trading days.


Source: https://elliottwave-forecast.com/st...yers-after-elliott-wave-double-three-pattern/
 
Hello Traders, in today’s blog we’re reviewing the $XAGUSD wave count shared with members, which highlighted a strong bullish outlook. The Elliott Wave pattern confirmed the move right at the extreme/high‑frequency zone, propelling prices sharply higher.

XAGUSD After Completing Major Correction from All‑Time Highs

Silver peaked earlier this year at 121.503 on January 29, 2026, before entering a six‑month corrective phase that concluded at 3940.68 on July 17, 2026. From that low, Silver rallied to complete wave (4) at 62.548, then turned higher, finishing wave 1 of a new nest. Price has since pulled back in a proposed wave 2, holding against the 62.548 pivot.

The Forecast: Completion of Wave ((iv)) Correction

The setup identified Silver at a decisive turning point following a corrective pullback from the peak near $67.84. After completing a multi‑wave bullish impulse into wave ((iii))/(v) above $67.00, price action unfolded into a corrective three‑wave (a)‑(b)‑(c) decline, designated as sub‑wave ((iv)).

The projected target zone for wave (c) of ((iv)) was between the 100% Fibonacci expansion at 63.211 and the 161.8% expansion at 61.144. The trade bias was clearly defined as “Turning Up”, with the explicit warning: “We Do Not Recommend Selling.” Traders were instructed to wait for the corrective wave to terminate within or near the target zone before initiating long positions.

The invalidation level was set at 56.614 (wave ((ii)) low), where a break below would negate the bullish structure. See below chart

2XAG-6020260819160457.jpg


The After Analysis

The follow‑up chart confirms that the wave projection unfolded almost exactly as anticipated (Note: We had some degree adjustments). Wave C of (4) completed squarely within the target zone, bottoming at 62.548—just above the updated invalidation level—before buyers stepped in aggressively.

From the 62.548 floor, Silver launched into a clean 5‑wave micro‑impulse, driving price through $70.00 and topping at 70.739. With Wave 1 complete at 70.739, the market is now undergoing a minor corrective consolidation in Wave 2, proposed as a three‑swing structure, setting the stage for the next upside leg. See chart below

2XAG-After.jpg


Comparative Setup Overview

Between the August 19 “Before” forecast and the August 22 “After” execution, the market transitioned from the tail end of a Wave ((iv)) correction into a fully completed Wave 1 impulse. The initial setup targeted an entry zone between 63.211 and 61.144, which ultimately bottomed cleanly at 62.548.

As the primary trend resumed, the invalidation level was raised from 56.614 to 62.548 to lock in profit protection. The resulting rally drove price to a peak of 70.739, marking a +$8.19 / +13.1% rebound and fully validating the “Right Side” bullish bias.

What’s Next for Silver in the Coming Weeks?

As charts progress, the structures and labeling naturally evolve. At the time of writing, wave 2 is proposed to have ended as a flat correction and is now turning higher, with the invalidation level maintained at 62.548. As long as price holds above this pivot, Silver is expected to continue advancing to eventually complete wave (5) of higher degree within wave ((1)). From there, the market would be positioned for a corrective pullback in wave ((2)) against the July lows, before resuming the broader bullish cycle. See chart below

2XAG-24020260831181231.jpg


Source: https://elliottwave-forecast.com/elliottwave/xagusd-turns-higher-after-hitting-extreme-area/
 
Hello, fellow traders. In this technical blog, we’ll take a quick look at the latest Elliott Wave analysis for BTCUSD, published in the members’ area of the website. Bitcoin has been showing clear bullish impulsive sequences from the August 1 low. The strongest part of the rally was labeled as wave ((iii)) of 3, which is a textbook example of the powerful momentum usually seen during the third wave of an Elliott Wave impulse.

In the analysis below, we’ll discuss the short-term Bitcoin outlook, possible scenarios, and the key technical levels that could determine BTCUSD’s next move.

BTCUSD Elliott Wave 1 Hour Chart 09.02.2026​

BTCUSD is currently going through a three-wave pullback. The correction is developing as an Elliott Wave Double Three pattern, labeled (w)-(x)-(y). The decline found temporary support near the 0.764 Fibonacci extension of wave (w) relative to (x), around 76,602. However, the pullback still looks incomplete at this stage. As long as the pivot at the (x) connector remains intact, BTCUSD could see another push lower toward 74,881–72,033 area. A break below the recent 76,463 low would provide stronger confirmation for this scenario.
>Alternatively, if Bitcoin continues to hold above the 76,463 low and manages to break above the (x) connector, the correction may already be complete. In that case, BTCUSD could be starting wave ((v)), opening the door for a move toward the 82,662+ area.

───────────────

Keep in mind that financial markets are dynamic, and the outlook may change as new price action develops. Calling every short-term swing with a high degree of accuracy is difficult, which is why we remind members that not every Elliott Wave chart represents a trading recommendation.

When the market structure, timing, and risk parameters align with our criteria, we present a clearly defined Trading Setup in the Live Trading Room.

Reminder: Our Chat Rooms in the membership area are available 24 hours a day, providing expert insights on market trends and Elliott Wave analysis. Don’t hesitate to reach out with any questions about the Market, Elliott Wave patterns, or Technical analysis. We're here to help.


Source: https://elliottwave-forecast.com/cr...elliott-wave-forecasting-the-short-term-path/
 
Hello fellow traders ,

As our members know, we have identified many trading setups recently, including the XLV ETF trading setup.

Our Elliott Wave analysis identified a clear three-wave correction from the recent peak. The price then reached the Equal Legs area, highlighted as our Blue Box buying zone.

This is exactly the type of setup we closely monitor within our trading service. The Blue Box provides a clearly defined area where we look for a potential entry, while the Elliott Wave structure helps us manage risk and identify the next potential targets.

In the following sections, we will break down the XLV trading setup in detail and explain how the opportunity developed.

XLV Elliott Wave 1-Hour Chart – 08.28.2026​

The Health Care Select Sector SPDR Fund (XLV) is showing a clear three-wave pullback from the recent high. The correction is developing as a potential Zig Zag (a)-(b)-(c) pattern, bringing price closer to our Blue Box buying zone at 171.13–168.15. This is the key area we are watching for the next opportunity.

At this stage, we do not favor selling XLV. Instead, our focus remains on the long side. As the main trend is still bullish, we expect buyers to have a chance to step in from the Blue Box area. From there, XLV could produce at least a three-wave bounce, with the potential to continue higher and eventually reach new highs.

More importantly, the setup comes with a clear trading plan. If the expected bounce reaches the 50% Fibonacci retracement against the red B-wave high, we can move the stop loss to breakeven and secure partial profits. A break below the 1.618 Fibonacci Extension at 168.15 would invalidate the setup.

This is the type of opportunity we look for every day for our members: a clearly defined entry zone, a specific invalidation level, and a plan for managing the trade once the market starts moving in our favor.

Instead of chasing price or guessing where to enter, our members can follow these setups as they develop in real time.

The official trading strategy for identifying 3, 7, and 11 swings and Equal Legs setups is explained in detail in our educational video. The video is available exclusively to members inside the membership area.


How to Read Our Charts​

  • Red bearish stamp + Blue Box = Selling setup
  • Green bullish stamp + Blue Box = Buying setup
  • Black stamp = No trade zone

XLV Elliott Wave 1-Hour Chart 09.02.2026​

The ETF found buyers as expected. As a result, long positions taken from this zone can now be considered risk-free, with the stop moved to breakeven. Our next target is for XLV to break to new highs. This would confirm that the next bullish leg is underway.

However, if the latest low breaks, XLV could enter a deeper correction. In that case, we would look for the pullback to create a new trading opportunity.

You can find the latest XLV charts, trading setups, and target levels inside our membership area.

The best instruments to trade are those with incomplete bullish or bearish swings. These setups are highlighted in our Sequence Report, while the highest-conviction opportunities are presented in the Live Trading Room.

Keep in mind that the market is dynamic, and the outlook may have changed in the meantime. Our member Chat Rooms are open 24 hours a day, Monday through Friday, on trading days, providing ongoing expert guidance on market trends and Elliott Wave analysis. Members can ask questions about market structure and technical setups at any time during trading days.


Source: https://elliottwave-forecast.com/etfs/xlv-elliott-wave-another-trading-setup-presented-to-members/
 
Hello traders. In this technical article, we will review the Elliott Wave forecast for Ethereum (ETHUSD) that we recently presented to our members.

ETHUSD developed a clear three-wave correction that completed as an Elliott Wave Double Three pattern. After reaching the expected support area, Ethereum found buyers and started a strong rally. This is the type of setup we look for in our daily market analysis. We identify the corrective structure, define the key support zone, and prepare for the next move before the market reacts.

In this article, we will explain the Double Three pattern, review the ETHUSD forecast, and highlight the next upside targets.

Elliott Wave Double Three Pattern

The Double Three is a common Elliott Wave corrective pattern. It is useful for traders because it can provide a clear completion area and a well-defined invalidation level. The pattern is labeled (W)-(X)-(Y) and has a 3-3-3 structure. This means that each main leg develops as a corrective sequence. Waves (W) and (Y) usually form as three-wave structures, such as A-B-C or another W-X-Y combination. Wave (X) connects the two corrections. When the structure is clear, traders can use Fibonacci measurements to identify the area where the correction may end. This can help create a trading plan before the next rally begins.


ETHUSD Elliott Wave 1 Hour Chart 09.02.2026​

ETHUSD is forming a three-wave pullback, unfolding as an Elliott Wave Double Three pattern. We can identify clear three-swing corrective structures within each leg of the pattern.

At the moment, Ethereum is developing the c red leg of wave (y). As our members know, when a Double Three pattern is in progress, we use the Fibonacci extension tool to measure the Equal Legs area and identify a potential buying zone.

In this case, we are projecting wave (w) from the end of wave (x). This gives us the ideal support area at 2375–2337, which represents buying zone.

From this area, we expect ETHUSD to find buyers and rally toward new highs. Alternatively, we should see at least a three-wave bounce from the support zone.

Did you know ? 90% of traders fail because they don’t understand market patterns. Are you in the top 10%? Test yourself with this advanced Elliott Wave Test

Official trading strategy on How to trade 3, 7, or 11 swing and equal leg is explained in details in Educational Video, available for members viewing inside the membership area.


ETHUSD Elliott Wave 1 Hour Chart 09.04.2026​

ETHUSD found buyers at the Equal Legs zone as expected, producing a solid bounce. While the price remains above the latest low at 2355, we can count wave ((iv)) black as completed. Wave ((v)) may now be in progress, opening the door for another push toward new highs. The next upside target comes in around the 2618+ area.

This is a good example of how we use Elliott Wave structure and Fibonacci measurements to define key trading areas in advance, giving our members a clear roadmap before the market makes its next move.

Reminder for members: Our chat rooms in the membership area are available 24 hours a day, providing expert insights on market trends and Elliott Wave analysis. Don’t hesitate to reach out with any questions about the market, Elliott Wave patterns, or technical analysis. We’re here to help.


Source: https://elliottwave-forecast.com/cr...sting-the-rally-after-a-double-three-pattern/
 
AXP shows solid performance within its long‑term bullish cycle, yet the price now signals early exhaustion. The stock held its impulsive structure through most of the year; however, it approaches a zone where markets usually decide between further extension or a deeper corrective phase. This moment matters because it blends key technical levels with a clear shift in momentum.

Meanwhile, American Express enters this stage with stable fundamentals. The company benefits from strong premium‑consumer spending, growing corporate card demand, and lower delinquency rates than most financial peers. Even so, rising rates, slower travel activity, and softer discretionary consumption create pressure that could limit its pace over the next three months. As a result, the balance between operational strength and macro risks suggests a possible consolidation while the market tests the resilience of its business model.

Elliott Wave Outlook:

AXP-Weekly.jpg

In June, we believed AXP had already completed wave (I) and started the larger wave (II) correction. The first decline formed wave a, while price was developing a corrective recovery in wave b. Therefore, we expected wave b to complete before sellers regained control. At that time, the structure still allowed another push toward the 350–360 area.

Once wave b finished, we expected AXP to turn lower and continue wave c of (II). Consequently, our focus remained on a deeper corrective decline rather than renewed long-term strength. We projected wave c to eventually reach the 200–250 region. From there, we expected wave (II) to complete and the next major bullish cycle to begin.

Elliott Wave Principle Behind the Market Structure​

Impulse

An impulse is a clean 5‑wave pattern that drives the trend forward.

  • Waves 1‑3‑5 are strong and directional.
  • No overlap between waves 1 and 4.
  • Wave 3 is usually the strongest.
  • Structure is clear, with increasing momentum

ChatGPT-Image-3-mar-2026-07_24_10-a.m.png

Elliott Wave Outlook:

Elliott Wave Outlook: AXP Weekly Chart September 05th, 2026


American Express (AXP) appears to have completed major wave (I) at 387.49. That advance developed from the October 2022 low and produced a clear bullish sequence. After reaching 387.49, AXP started a larger corrective phase in wave (II). The first leg lower formed wave a, while the rebound completed wave b at 363.14. Therefore, the chart now favors another decline in wave c. This move should unfold in five waves before completing the larger correction.

The main downside target remains the 266.48–206.60 Blue Box. This area represents the preferred zone for wave (II) to finish. However, the larger trend still favors the upside while price stays above 130.43. Consequently, we view the decline as a correction within a broader bullish cycle. Buyers should appear from the Blue Box and start the next major advance. Ultimately, that rally should break above the wave (I) high at 387.49 and extend the larger bullish sequence.

Source: https://elliottwave-forecast.com/stock-market/axp-warning-major-correction-before-new-highs/
 
PM is correcting the bullish cycle from November 2025 low. The stock could find buyers from the blue box. This blog post identifies the blue box zone to trade from.

Philip Morris International Inc. (PM) is a leading global tobacco and nicotine company headquartered in Stamford, Connecticut. It manufactures and markets well-known cigarette brands, including Marlboro, and is actively transitioning toward smoke-free products through its “Beyond Nicotine” strategy. PMI’s flagship smoke-free product, IQOS, uses heat-not-burn technology and has gained significant global adoption. Operating in over 180 markets, the company focuses on reducing the health impact of smoking by investing heavily in science-based alternatives and next-generation nicotine delivery systems.

From the all-time low of $32 in March 2009, PM’s stock price has surged over 475%, peaking at $186 in June. Since then, it has completed a 3-swing structure. While we anticipate at least a 5-swing chart evolution, the 3rd swing appears incomplete. We’ve identified the first swing, ending at the June 2017 peak, as wave (I). A pullback followed, correcting it in wave (II), which ended at the March 2020 low. From there, wave (III) began. Wave (III) could target $204, 1.618 of (I) from (II), and potentially even higher.

Meanwhile, waves I and II of (III) started and ended at the February 2022 high and September 2022 low, respectively. From September 2022, a strong wave III of (III) emerged, completing at the June 2025 peak, the previous all-time peak. The pullback from this peak was evolving as wave IV when we shared the chart below on Oct0ber 29, 2025's blogpost.

PM Elliott Wave Analysis - October 29, 2025 Weekly Chart

PM


Wave IV pullback completed a double zigzag structure at the extreme where we recommended readers to go long at 144.1, stop at 124.79 and target at 200. What has happened barely a year after?

PM Elliott Wave Analysis - 6th September 2026 Weekly Chart

PM


The latest weekly chart below shows how wave V evolved from the low of November 2025. Price rallied as expected to complete a diagonal structure. Either the diagonal completed as wave ((1)) of V of III or V of (III).I will go with the former because I expected a much more extended wave (III). Thus, the current pullback is most likely wave ((2)) of V of (III). Traders can wait to buy the dips again, at the extreme of 3,7 or 11 swing structure.

PM Elliott Wave Analysis - 6th September 2026 Daily Chart

PM


As the daily chart above shows, the wave ((2)) pullback started at the late July high. Price is currently in wave (C) of ((2)). We have identified the 172.86-158.17 extreme zone. At the zone, traders can expect at least a 3-swing bounce. Ideally, wave ((2)) could emerge from there, leading to a fresh record high.

Source: https://elliottwave-forecast.com/st...ructure-identifies-trade-setup-from-blue-box/
 
Hello , fellow traders. In this technical update, we’ll revisit our recent Elliott Wave analysis for BTCUSD, published in the members’ area of the website.

In our previous BTC article, we explained that Bitcoin was going through a short-term correction after a strong rally from the August 1 low. We highlighted 76,235 as the key short-term level and outlined two possible bullish scenarios. The first scenario allowed for another push lower before the rally resumed. However, we also noted that if BTCUSD continued to hold above 76,235 and broke above the connector, the correction could already be complete and the next bullish leg could begin.

That more bullish scenario played out, with Bitcoin holding the key low and turning sharply higher.

BTCUSD Elliott Wave 1 Hour Chart 09.02.2026​

BTCUSD is forming a Double Three pattern labeled (w)-(x)-(y). The decline found support near the 0.764 Fibonacci extension around 76,602. We expect rally to takes place soon.


BTCUSD Elliott Wave 1 Hour Chart 09.06.2026​

Bitcoin respected the key support and turned sharply higher. Wave ((iv)) completed at the 76,235 low, followed by a strong rally toward new highs. The current view suggests that as long as the pivot at the 76,235 low remains intact, BTCUSD can continue higher and extend the bullish sequence.

Financial markets are dynamic, and the outlook can change as new price action develops. This is why not every Elliott Wave chart represents a trading recommendation.

When the market structure, timing, and risk parameters meet our criteria, we provide clearly defined Trading Setups in the Live Trading Room, including Entry, Stop Loss, and Take Profit levels.

Members also receive regular updates as market conditions change, helping them follow the key levels and the most likely scenarios in real time.


Source: https://elliottwave-forecast.com/cryptos/btcusd-found-buyers-after-elliott-wave-double-three/
 
Hello Traders, in today’s blog post we are reviewing the $META wave structure shared with our members, which pointed to a bullish reversal. The Elliott Wave Zigzag pattern confirmed the move just above the critical 518.21 invalidation level, propelling prices sharply higher. Read on as we break down what lies ahead for the stock.

The Corrective Pullback Forecast

The chart from 08.14.2026, highlighted a completed impulsive rally in wave (A), followed by a 5-swing structure in wave A. This 5-swing decline signalled that the market was developing a classic 5-3-5 Zigzag correction. Based on this structure, the forecast called for a final push higher in wave B—holding below the wave (A) high—before turning lower in wave C of (B).

META-1.jpg


What is a ZigZag Correction?

A Zigzag structure in Elliott Wave Theory is a sharp three‑wave corrective pattern labelled A‑B‑C, with a distinct 5‑3‑5 subdivision. It represents a counter‑trend move and is one of the most common corrective formations.

ZIGZAG.jpg


Wave A: Comprises 5 sub-waves (impulsive structure indicating the primary trend of the correction).

Wave B: Comprises 3 sub-waves (a corrective counter-move against Wave A).

Wave C: Comprises 5 sub-waves (a final impulsive move, typically equal to or longer than Wave A).

Trading Insights

  • Zigzags often signal continuation after correction, making them useful for identifying re‑entry points in the direction of the larger trend.
  • Traders watch for Blue Box zones (high‑probability reversal areas) to align entries with the end of Wave C.
  • Recognizing zigzags helps avoid mistaking them for trend reversals—they are corrective pauses, not new dominant trends.
Now that we understand what a Zigzag correction is, we can clearly connect that concept to the corrective structure shown in the META chart above

Wave B complete & Turn Lower in C wave

Fast-forwarding to the 08.17.2026 chart below, the wave B correction ended just below the peak of wave (A). Prices turned lower as expected and are currently trading within wave C to complete wave (B). This pull-back should mature above the key invalidation level at 518.21 to keep the bullish forecast intact for a turn higher upon completion. A break below 518.21 invalidates the entire wave count.

META-2.jpg


Wave (B) Reaching Maturity

Moving forward to the 08.18.2026 chart below, wave C developed a 5-swing micro-structure, signalling to traders that the decline was reaching maturity and to prepare for a turn higher. As expected, price held cleanly above the key 518.21 swing low to initiate the reversal.

META-3.jpg


Wave (C) of ((X)) Rally Initiated: Key Targets & What's Next

The latest update chart from 09.06.2026 below, shows a reaction higher following the completion of wave (B), with waves 1 and 2 now in place. Price action continues to track the forecast as wave (C) of ((X)) progresses. Looking ahead, expect one more swing higher to complete wave ((iii)), followed by a minor wave ((iv)) pullback and a final push in wave ((v)) to finish wave 3. From there, a 3- or 7-swing correction in wave 4 should hold above the wave 2 low, setting up wave 5 of (C) to complete wave ((X)) within the 632.04 – 654.38 target zone. Selling pressure is expected in that area below the 691.84 invalidation mark, pointing toward an eventual major decline toward 416.03 – 245.45.

META-4.png


Source: https://elliottwave-forecast.com/st...nds-targeting-632-654-potential-selling-area/
 
Pan American Silver Corp. (PAAS) is one of the world’s leading primary silver producers, headquartered in Vancouver, Canada. With a diversified portfolio of mining operations and exploration projects across the Americas, the company not only delivers significant silver output but also produces gold and base metals. Its scale, jurisdictional breadth, and long track record in the sector make PAAS a key name for investors seeking exposure to precious metals.

PAAS Monthly Elliott Wave Chart​

PAAS-Monthly20260908103904.jpg
Pan American Silver (PAAS) completed wave ((II)) of the Grand Supercycle at the $5.70 low, establishing a major long‑term pivot. From that base, the stock advanced in a nested wave ((III)) structure. Up from wave ((II)), wave (I) peaked at $40.11, followed by a wave (II) correction to $12.16. The stock has since resumed higher within wave (III) as an impulsive sequence, with wave I topping at $69.99 and wave II retracing to $40.76. The expectation is for continued upside in wave III of (III).

PAAS Daily Elliott Wave Chart​

PAAS-Daily20260908110152.jpg


Pan American Silver (PAAS) initiated its advance from the February 13, 2024 low in a clear impulsive sequence. Wave ((1)) reached $27.47 before a corrective wave ((2)) pulled back to $20.55. The rally then extended in wave ((3)) to $42.57, followed by a wave ((4)) retracement to $33.08. Wave ((5)) carried the stock to $69.99, completing wave I of the higher degree. A subsequent wave II correction unfolded as a double three, bottoming at $40.76. The stock then turned higher in wave III. From the wave II low, wave (1) advanced to $56, and the anticipated wave (2) pullback is expected to remain above $40.76, setting the stage for further upside.

Source: https://elliottwave-forecast.com/st...of-bullish-cycle-in-pan-american-silver-paas/
 
Royal Bank of Canada., (RY) operates as diversified financial service company worldwide. It operates through personal finance, commercial banking, wealth management & Insurance segments. It comes under “Financial services” sector & trades as “RY” ticker at NYSE.

The RY continue rally within ((3)) impulse in sequence from April-2025 low as per last article. Short term, it should continue rally into $222.9 - $238.45 area before pullback start. Since March-2020 low as (II), it started rally in (III) in weekly. It placed I of (III) at $119.41 high in January-2022 & II at $77.90 in October-2023 low. It ended ((1)) of III at $128.05 high, ((2)) at $106.10 low & favors rally in ((3)) against April-2025 low.

RY - Elliott Wave Latest Weekly View:​

Within ((1)), it ended (1) at $102.07 high, (2) at $93.97 low, (3) at $126.96 high, (4) at $120.26 low & (5) at $128.05 high. It ended (A) of ((2)) at $117.63 low, (B) at $124.35 high & (C) at $106.10 low. Above there, in ((3)), it ended (1) at $176.19 high, (2) at $156.91 low, (3) at $218.57 high, (4) at $200.85 low & favors rally in (5) above $222.91. Buyers should remain in control for short term rally to finish (5) as ((3)) to end April-2025 rally before correcting next. Short term, if it breaks below $200.85 low, it can do double correction against March-2026 low, which provides next long set up. The next long opportunity will be ((4)) pullback in 3, 7 or 11 swings, when reach extremes.

Source: https://elliottwave-forecast.com/stock-market/ry-elliott-wave-analysis-points-222-9-238-45/
 
XLF (State Street Financial Select Sector SPDR ETF) has shown a bullish impulse since the June 3, 2026 low. The 4‑hour Elliott Wave structure favors further upside as the ETF continues to make higher highs and higher lows. Our guidance for members was to avoid selling and instead buy corrective dips in 3, 7, or 11 swing sequences at clearly defined blue box areas.


Instrument Snapshot​

  • Ticker: XLF
  • Name: State Street Financial Select Sector SPDR ETF
  • Timeframe: 4‑hour Elliott Wave analysis
  • Trade style: Tactical buy‑the‑dip approach while the impulse structure remains intact

Elliott Wave 4-Hour Technical View August 17 2026​

Financials Surge: XLF Breaks Higher from Blue Box Zone


The advance from the June 3 low is unfolding as an impulse. Key structure points:

  • Wave (3) completed at $58.43.
  • Wave (4) corrected as a zigzag:
    • Wave A ended at $57.34.
    • Wave B bounced to $58.31.
    • Wave C reached the blue box at $57.20–$56.51 (equal‑legs zone).
The blue box offered a low‑risk long entry where buyers were expected to step in for at least a three‑wave bounce and potentially the next impulsive leg higher.


Updated 4‑Hour View September 06 2026​

Financials Surge: XLF Breaks Higher from Blue Box Zone


  • After the blue‑box reaction, XLF produced a clean rally that allowed members to convert positions to risk‑free once protective stops were in place.
  • A break above the prior $58.43 high confirmed the next leg higher.
  • Initial upside targets are $58.78–$59.38 before a likely profit‑taking pullback that may unfold in 3 or 7 swings.

Trade Management and Execution​

  • Entry: Buy corrective dips into the blue box using 3, 7, or 11 swing sequences.
  • Stops: Place stop‑losses below the blue box to define invalidation and enable risk‑free management once price confirms.
  • Targets: Scale out into the $58.78–$59.38 minimum extension zone.
  • Timeframe: Favor short to medium tactical holds; avoid passive long exposure without active risk controls.
  • Position sizing: Keep size conservative relative to unleveraged ETFs and adjust for market volatility.

Why This Setup Is Effective​

The blue‑box framework blends Elliott Wave structure with measured risk zones, allowing traders to:

  • Enter with defined risk and clear invalidation levels.
  • Convert positions to risk‑free quickly after confirmation.
  • Capture high‑probability moves while limiting downside exposure through disciplined stops and scaling.
Maintaining discipline in risk and money management, along with a working knowledge of Elliott Wave and cycle relationships, is essential to execute this plan consistently.

Source: https://elliottwave-forecast.com/bluebox-wins/financials-surge-xlf-breaks-higher-from-blue-box-zone/
 
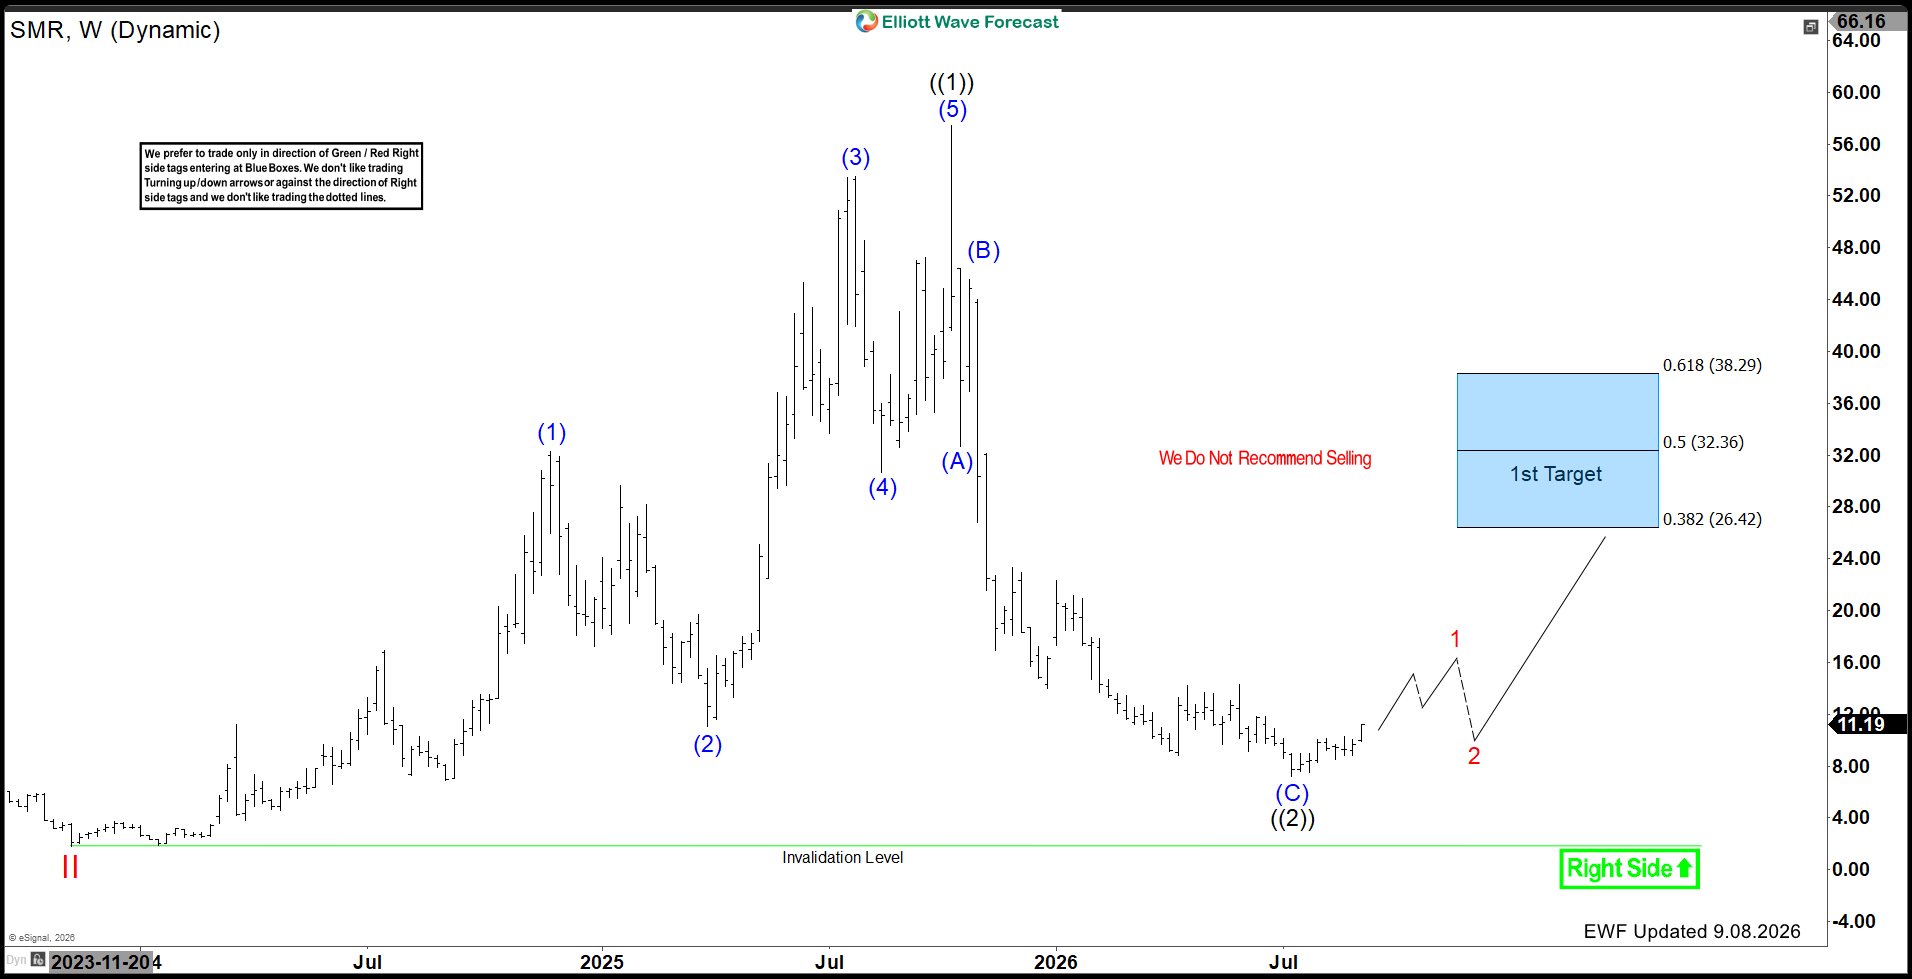
In this Elliott Wave update, we examine the long-term structure in NuScale Power Corporation ($SMR). The stock completed a strong 5-wave advance from the November 2023 low, ending the first major bullish cycle in October 2025. From there, SMR entered a larger corrective phase that unfolded in 3 swings as an A-B-C structure.

That correction appears to have ended at the July 2026 low. As a result, the next bullish leg is now expected to be taking place, with the structure favoring a new 5-wave impulse higher. The first major upside target comes within the $26–$38 area.

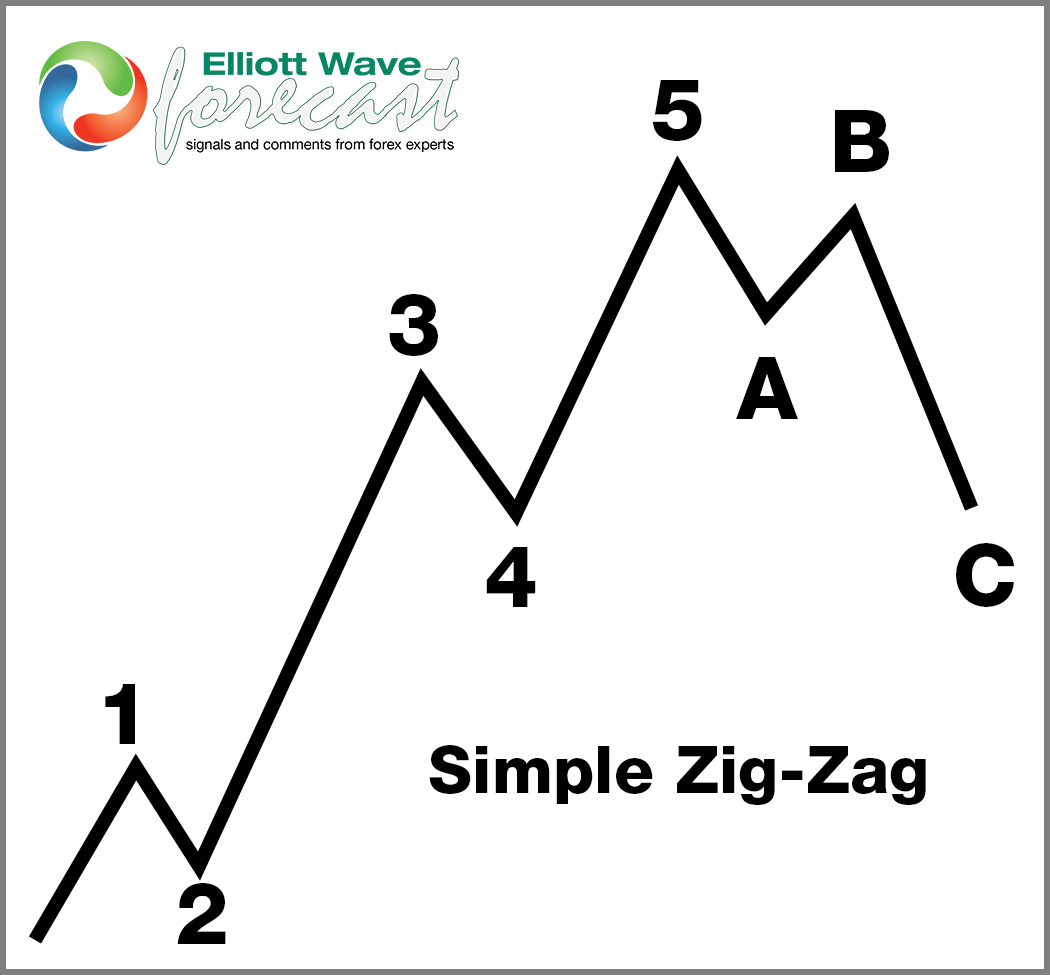
5 Wave Impulse + ABC correction​

$AMD

SMR Completed 5 Waves From November 2023​

$SMR

Looking at the weekly chart, $SMR established an important low in November 2023 and then started a powerful advance.

The rally developed through a clear Elliott Wave impulsive structure. Waves (1) through (4) built the move before wave (5) eventually pushed the stock to a major high in October 2025. Therefore, the entire advance from November 2023 can be counted as a completed 5-wave cycle in wave ((1)).

Once that impulse ended, a larger correction against the November 2023 low became due.

Decline From October 2025 Unfolded in 3 Swings​

From the October 2025 peak, $SMR turned sharply lower. However, the decline did not develop as a clean bearish five-wave impulse. Instead, price unfolded in an overlapping A-B-C correction.

Wave (A) produced the initial decline, followed by a corrective bounce in wave (B). Afterward, another leg lower in wave (C) completed the larger wave ((2)) correction.

Most importantly, wave (C) appears to have reached its conclusion at the July 2026 low.

This structure suggests the decline from October 2025 represented a correction of the prior bullish cycle rather than the beginning of a new long-term bearish trend.

July 2026 Low May Have Completed Wave ((2))​

The July low now represents the key turning point in the current Elliott Wave count.

Since that low, price has started to stabilize and turn higher. If wave ((2)) has indeed finished there, $SMR should now be entering the early stages of the next larger bullish sequence.

In other words, the focus shifts away from the completed correction and toward the development of another impulsive move higher.

New 5-Wave Impulse Is Expected​

The preferred path calls for $SMR to advance from the July 2026 low in a new 5-wave impulsive sequence.

Initially, wave 1 should move higher, followed by a corrective wave 2 pullback. After that correction finishes, the stronger wave 3 portion of the advance can begin.

Therefore, short-term pullbacks can still occur as the structure develops. However, they should remain corrective while the July low continues to hold.

The expected sequence is:

  1. Wave 1 higher
  2. Corrective wave 2 pullback
  3. Strong wave 3 advance
  4. Wave 4 correction
  5. Final wave 5 higher
This would complete the next impulsive cycle from the July 2026 low.

$26–$38 Is the First Major Upside Target​

Most importantly, the first major target for the new bullish cycle comes between $26.42 and $38.29.

This region represents the 38.2%–61.8% retracement of the prior decline, with the midpoint near $32.36.

Consequently, the $26–$38 area should become the first important objective as the new bullish sequence develops.

A sustained impulsive advance into that region would strengthen the view that the July 2026 low completed wave ((2)) and that a larger bullish cycle is underway.

Bigger Picture Remains Bullish​

Although $SMR experienced a substantial decline from the October 2025 high, the Elliott Wave structure still favors the larger bullish side.

The advance from November 2023 unfolded impulsively, while the decline that followed developed in only three waves. This combination supports the interpretation that the selloff represented a correction within a larger bullish sequence.

Therefore, as long as the July 2026 low remains intact, the right side should continue to favor higher prices.

Technical Summary​

To summarize, $SMR completed a 5-wave advance from the November 2023 low, ending the first bullish cycle in October 2025.

The subsequent decline unfolded in 3 swings as an A-B-C correction, and that structure appears to have ended at the July 2026 low in wave ((2)).

From there, $SMR is expected to begin a new 5-wave impulse higher. While corrective pullbacks should occur along the way, the first major upside objective comes within the $26–$38 area.

If the bullish sequence continues to develop as expected, this zone should represent only the first major target for the next leg of the longer-term advance.

Source: https://elliottwave-forecast.com/st...-completing-abc-correction-from-october-2025/
 
Palantir (PLTR) enters the final months of 2026 with a fundamental backdrop that remains exceptionally strong, but with the stock at a technical crossroads. The company reported 93% year-over-year revenue growth in Q2, while U.S. commercial revenue surged 149%, and management raised its full-year 2026 revenue outlook to roughly $8.15 billion, representing about 82% annual growth. For Q3, Palantir expects revenue of approximately $2.16 billion, making the next earnings report an important catalyst for the stock heading into year-end.

Wall Street also remains generally constructive, although expectations vary significantly. Current analyst consensus is Moderate Buy, with average 12-month targets around $192 - $201, but individual forecasts range from approximately $80 to $255. That wide dispersion highlights the main debate surrounding PLTR: powerful AI-driven commercial and government growth continues to support the bullish case, while its elevated valuation leaves the stock vulnerable to a substantial correction if growth expectations begin to disappoint.

For the next months, this creates two very different possibilities. PLTR may continue its recovery and challenge the 194.06 - 202.81 area before extending the larger bullish trend, or the September advance may be completing a corrective phase ahead of a much deeper decline. Our Elliott Wave analysis below examines both the bearish and bullish scenarios, the levels that separate them, and what price action needs to do to confirm which path is developing into year-end.

Elliott Wave Outlook: PLTR Daily Chart Analysis June 27, 2026

Elliott Wave Outlook: PLTR Daily Chart Analysis June 27, 2026


Back in June, we were expecting the rebound to remain corrective and eventually give way to another leg lower. As the market continued to develop, the structure evolved into a leading diagonal to complete wave (a). The subsequent three-wave recovery was then confirmed as wave (b) once price broke below the wave (a) low.
From that point, our expectation remained for further downside while price stayed below the wave (b) high. The preferred path called for a decline toward the 77.96–25.02 area to complete wave ((II)). We expected that zone to finish the larger correction and create the conditions for the broader bullish trend to resume.

Elliott Wave Principle Behind the Market Structure​

Impulse

An impulse is a clean 5‑wave pattern that drives the trend forward.

  • Waves 1‑3‑5 are strong and directional.
  • No overlap between waves 1 and 4.
  • Wave 3 is usually the strongest.
  • Structure is clear, with increasing momentum.

Impulse

Elliott Wave Outlook: PLTR Daily Chart Analysis September 12, 2026 - Bearish View

Elliott Wave Outlook: PLTR Daily Chart Analysis September 12, 2026

PLTR remains in a larger bearish corrective cycle from the November 2025 peak, and the key question is whether wave (b) still has another push higher or has already completed. One idea is that wave (b) can extend toward the 194.06 - 202.81 resistance area before sellers return. In the second scenario, the recent high has already completed wave (b), meaning wave (c) of ((II)) may already be underway and price can continue lower without reaching that resistance zone first.

In both cases, the larger-degree expectation remains the same: PLTR should eventually continue lower in wave (c), ideally unfolding as a five-wave decline toward the 86.64 - 23.66 Blue Box area, where the broader correction could complete and a more important recovery may begin. As long as price remains below the 207.86 invalidation level, we continue to favor the bearish outlook.

Elliott Wave Outlook: PLTR Daily Chart Analysis September 12, 2026 - Bullish View

Elliott Wave Outlook: PLTR Daily Chart Analysis September 12, 2026


If you are bullish PLTR, this is the view you need to expect. The June low should represent the completion of wave ((II)), keeping the larger upside sequence alive as long as price remains above the 107.38 invalidation level.

From here, there are two possible bullish paths. The first is that wave I already completed at the September high and PLTR is now correcting in wave II, potentially toward the 140 area, before the next major rally in wave III begins. The second is that wave I is still incomplete and can first extend toward the 194.06–202.81 area before a deeper wave II correction develops.

In both scenarios, the key idea is the same: any larger pullback should remain corrective above 107.38, and once wave II completes, PLTR should resume higher in wave III and eventually break above the August peak.

Source: https://elliottwave-forecast.com/stock-market/pltr-bullish-breakout-major-wave-correction/