Elliottwave-Forecast

Master Trader
Feb 17, 2017
2,453
9
84
www.elliottwave-forecast.com
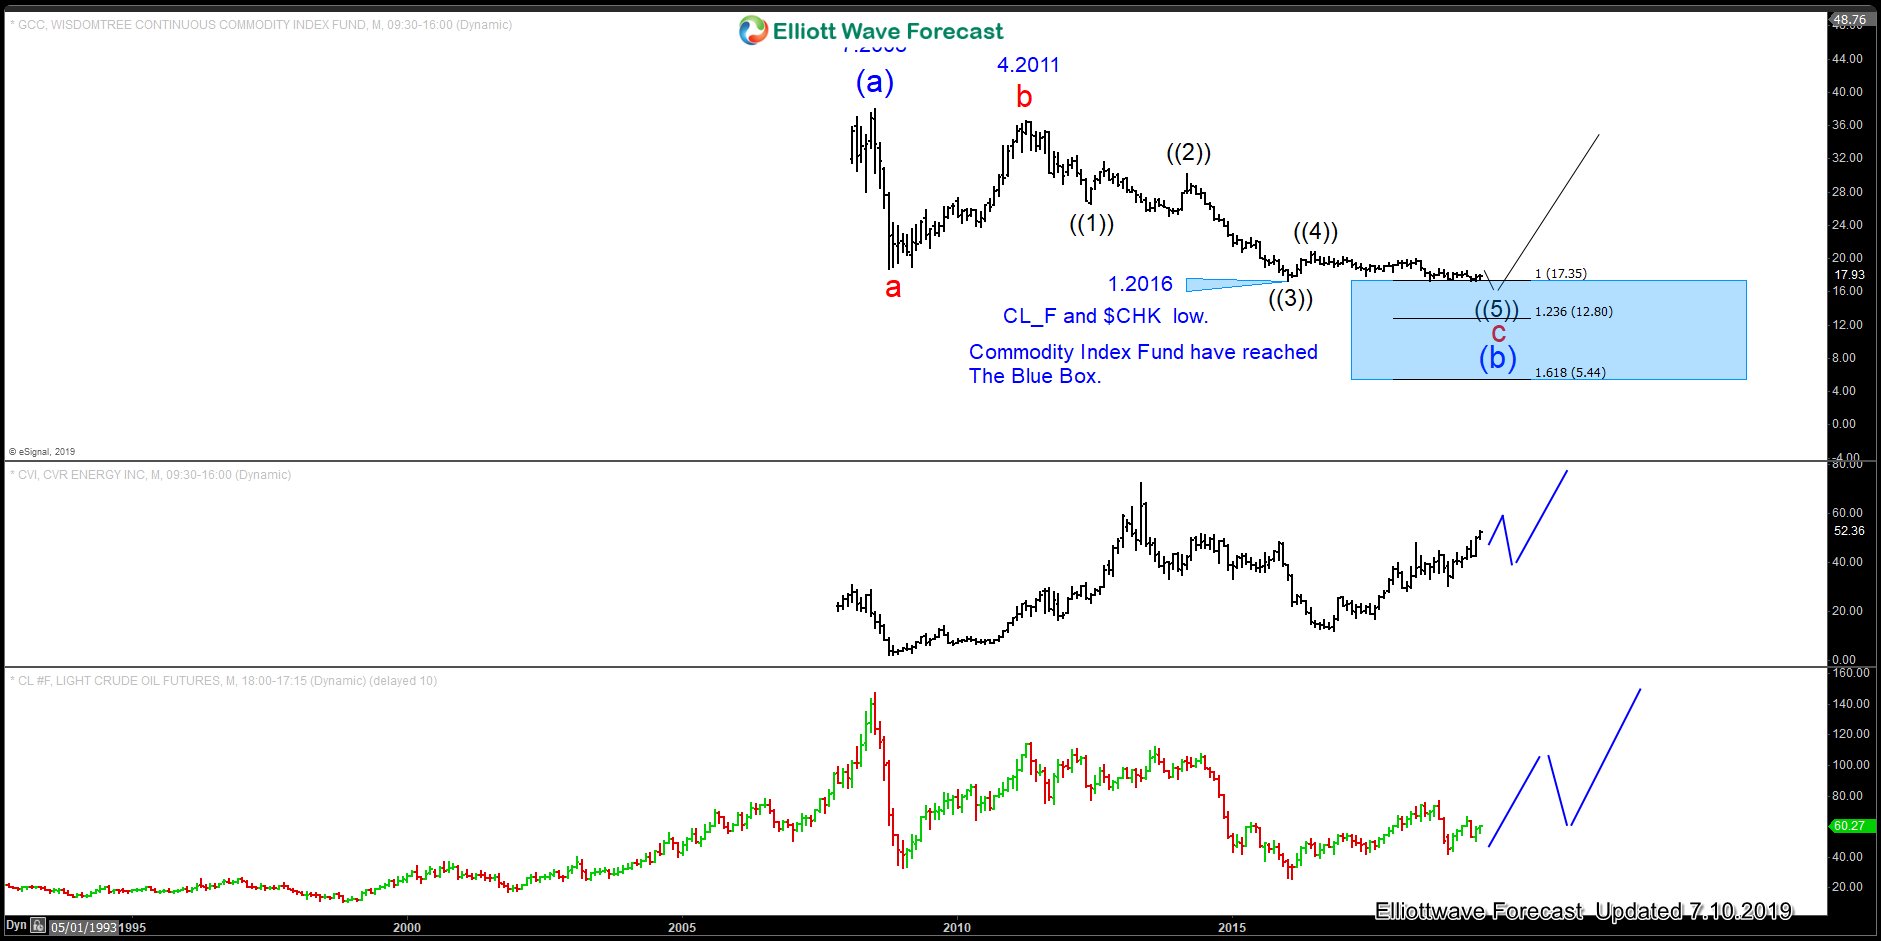
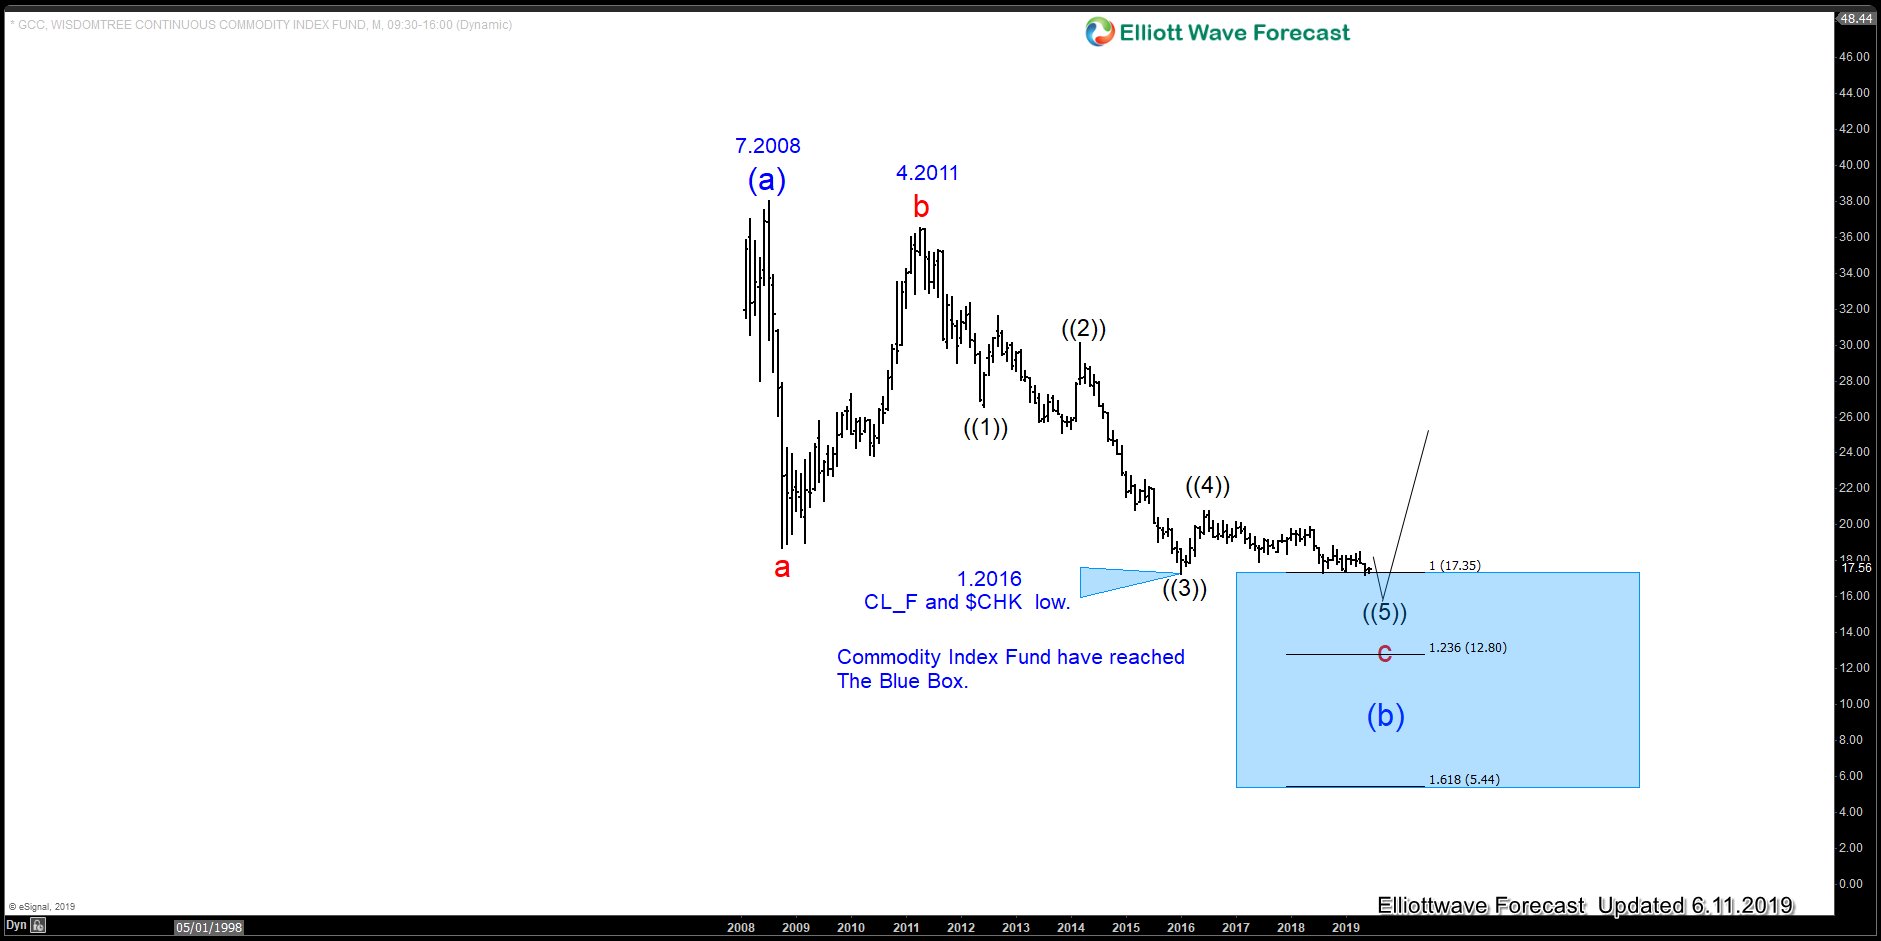
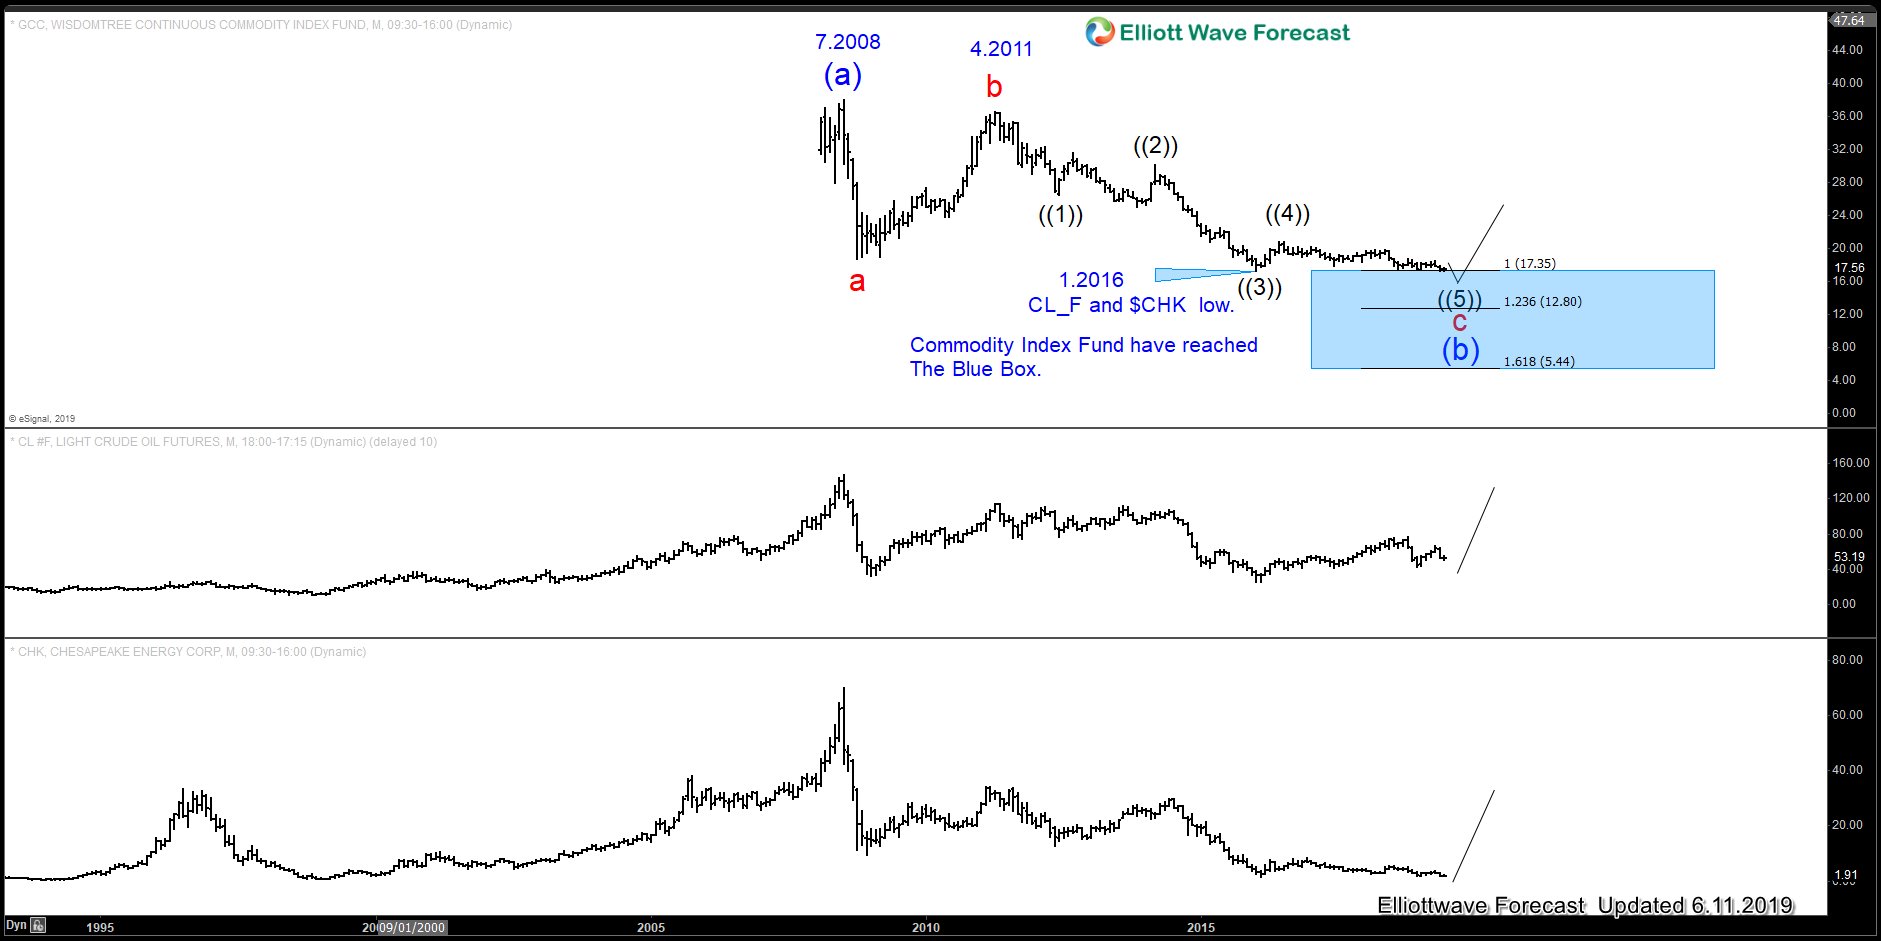
The Wisdomtree Continuous Commodity Index (GCC) has reached our long-term investor buying area (Blue Box). The Index is ending an ABC pullback from its July 2008 peak.

The minimum target to the downside was $17.35 and at this moment in time, we can count 5 waves from the April 2011 peak and consequently the price target which is the Blue Box has been reached as the chart below is showing.


GCC Elliott Wave Monthly View 6.11.2019


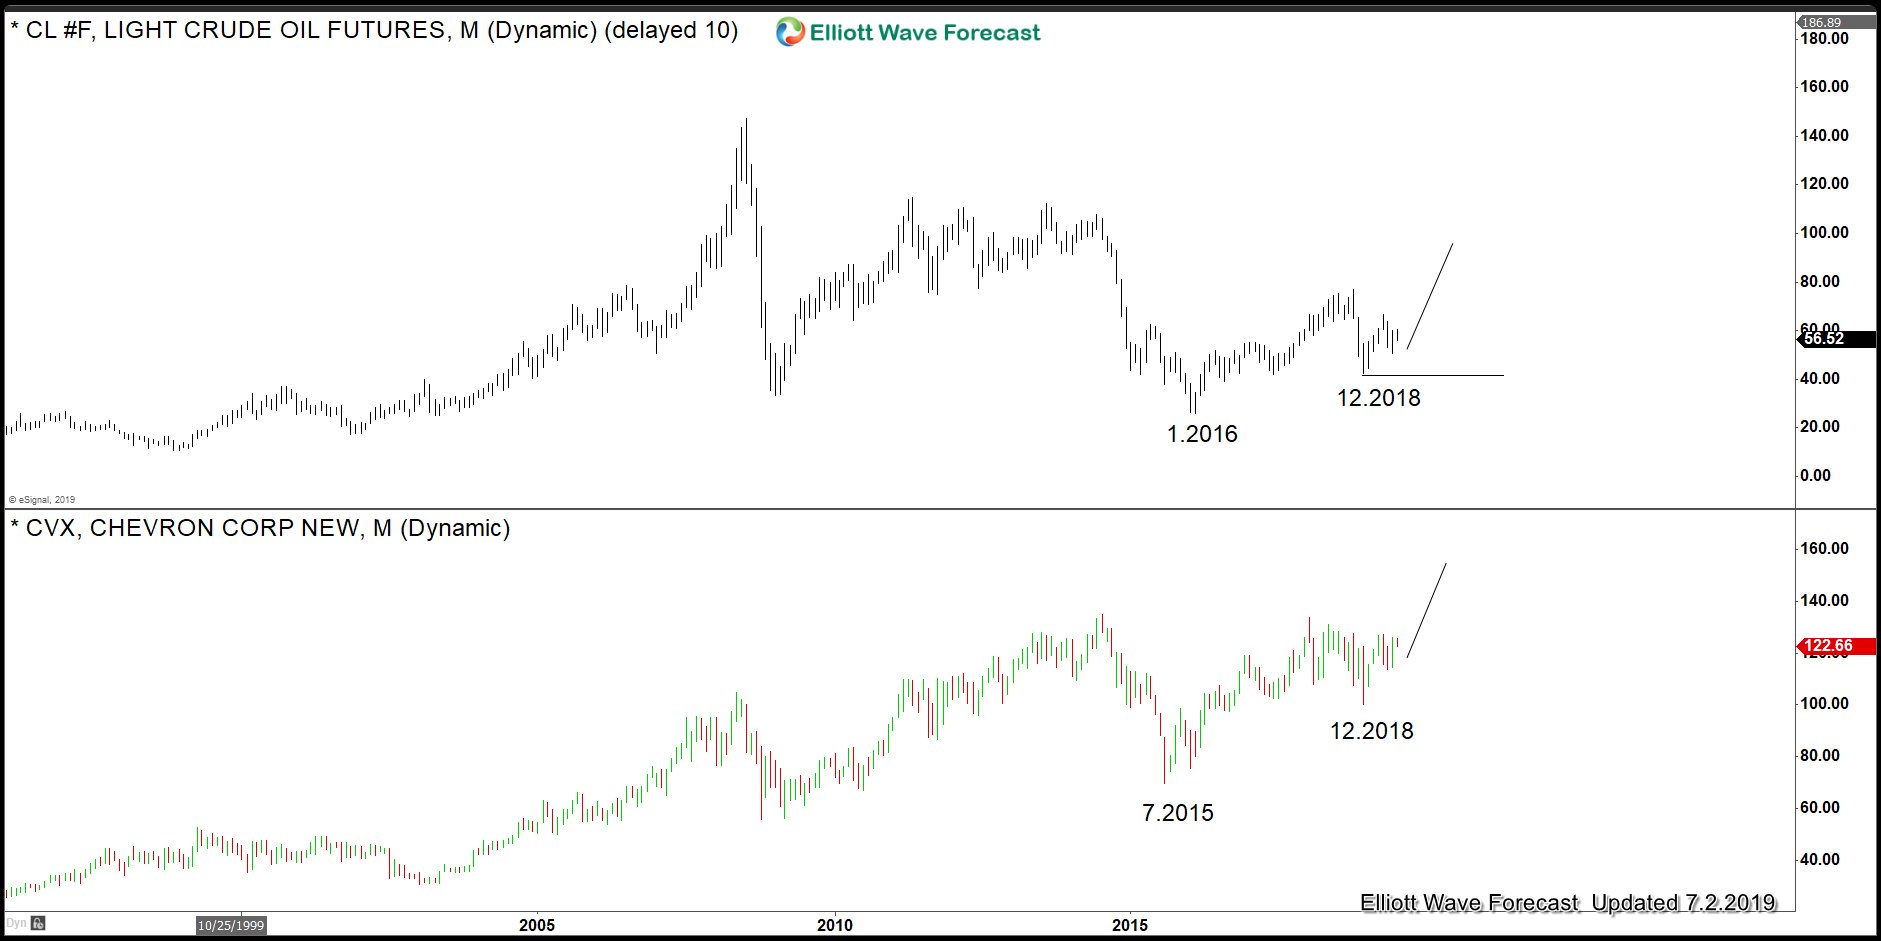
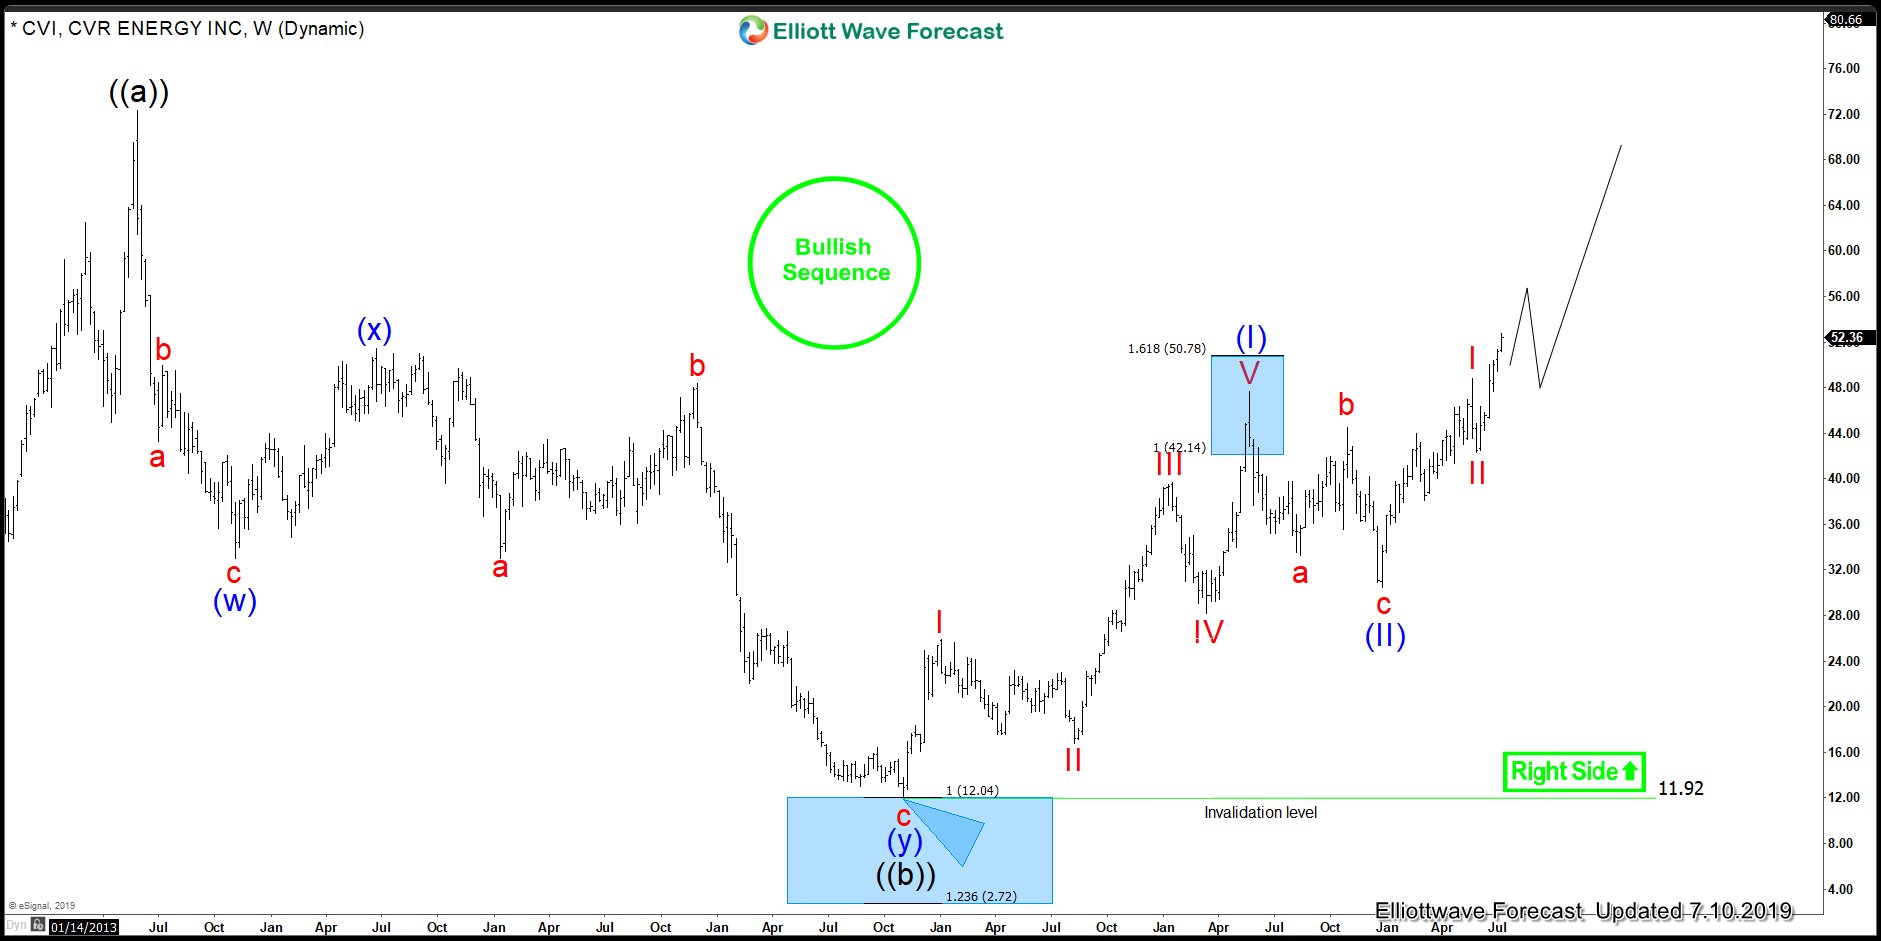
Now as we always do, we relate the instruments to each other. Today, we will relate the GCC with the Chesapeake Energy Corporation stock (CHK). The Index has a strong relationship with the CHK stock and also with Oil Futures. It can be seen in the chart below.


GCC overlay with Oil and CHK 6.11.2019


We can see how they agree in highs and lows. It is very interesting to see that all of them bottomed in 2016 and already the Index has taken the lows whereas Oil and CHK are missing the break lower.

However, this does not mean that CHK and Oil need to make new lows but we are in a process of a long term turn higher and the Index breaking it can open the downside in CHK. At this stage, it comes to the Traders Identity.

If you are a long term investor your trade should be for several months or years. The Index reached a long term buying area (Blue box). But if you are a short term trader you can still look to sell it against its April 2019 peak in 3-7 or 11 swings. It is simple how to operate in this market but sometimes traders lack and make things too complicated. The following video explains the view and goes into more detail and provides the ideas for both types of trades.
 

Elliottwave-Forecast

Master Trader
Feb 17, 2017
2,453
9
84
www.elliottwave-forecast.com
In this technical blog, we are going to take a look at the past performance of 4 hour Elliott Wave Charts of S&P 500 Futures (ES_F), which we presented to members at elliottwave-forecast. In which, the cycle from 12/26/2018 low ( $$2315.27) unfolded in an impulse structure & showed a higher high sequence in bigger time frame charts called for further upside. Also, it’s important to note that the ES_F was having green right side tag pointing higher favored members to look for buying opportunity at the blue box areas in 3, 7 or 11 swings. We will explain the ideas & structure below:

ES_F 4 Hour Elliott Wave Chart From 5/20/2019


ES_F 4 hour Elliott Wave Chart from 5/20/2019 update, in which the cycle from 12/26/2018 low ended at $2961.25 high. Down from there, the index corrected that cycle as zigzag structure & was expected to find buyers at $2728-$2625 100%-161.8% Fibonacci extension area of (A)-(B) into the direction of the right side tag. Afterward, the index was expected to resume the upside or it was expected that minimum 3 wave reaction higher should take place. Therefore, we advised members not to sell it and keep buying the dips in 3, 7 or 11 swings into the direction of right side tag.

ES_F 4 Hour Elliott Wave Chart From 6/09/2019

ES_F 4 hour Chart from a Weekend update, in which index managed to reach blue box area at $2728-$2625 & made the reaction higher as expected. Allowing members to go risk-free in the trade (stop loss at entry level) in this recent reaction higher from blue box area.

Success in trading requires proper risk and money management as well as an understanding of Elliott Wave theory, cycle analysis, and correlation. We have developed a very good trading strategy that defines the entry. Stop loss and take profit levels with high accuracy and allows you to take a risk-free position, shortly after taking it by protecting your wallet. If you want to learn all about it and become a professional trader.
 

Elliottwave-Forecast

Master Trader
Feb 17, 2017
2,453
9
84
www.elliottwave-forecast.com
American Express (NYSE: AXP) is an American multinational financial services corporation that was founded in 1850. Since it's IPO back in the seventies, AXP rallied in an initial Elliott Wave 5 waves impulsive structure which ended in 2000 with the Dot Com Bubble as a wave ((I)). In the following years, the stock did a huge Flat as 3 waves corrective Elliott Wave Structure which ended after the 2008 Financial crises.

Up from there, the stock started the next leg higher in wave ((III)) which is the strongest in the Grand Super Cycle. AXP is showing an incomplete bullish sequence from 2009 low and aiming for a higher target at extreme area $137 - $190 which can be exceeded as the 3rd wave tends to extend beyond the minimum target.

AXP Monthly Chart


The current focus is on the cycle that started from 2016 low $50 and created a connector in December 2018 low $89 as the stock managed to make new all time highs which opened a new extension to the upside targeting the 100% Fibonacci extension area $153. In addition, the impulsive rally from $89 low created further upside against the recent June 2019 low $113 which is expected to remain supported against short term pullbacks as the stock will be looking for a strong rally to take place without any deep correction based on the bullish sequence and correlation with the rest of stock market.

AXP 8 Hour Chart


In conclusion, American Express structure is unfolding as an impulsive structure form all time lows and it's still expected to continue rallying to new all time highs, therefore investor will be looking to continue buying the stock in any corrective pullbacks against June 2019 low and December 2018 low.
 

Elliottwave-Forecast

Master Trader
Feb 17, 2017
2,453
9
84
www.elliottwave-forecast.com
GBPJPY Technical Analysis

GBPJPY Daily Chart April 1/2019 : On April 1/2019 I posted chart on Twitter of the possibility that the pair could be forming a Bearish Head & Shoulders Breakout Pattern. Traders needed to be patient and wait for the right shoulder to terminate then followed by a break lower below the neck line to confirm the market pattern was valid. This was the first bearish market pattern that was clearly visible at the time which lead us to believe that the pair can possibly break lower to the next support target level in the coming weeks.

GBPJPY Daily Chart 4.1.2019


GBPJPY Daily Chart April 18/2019 : On April 18/2019 I posted chart on Twitter showing the right shoulder of the bearish Head & Shoulders pattern could have formed and advised and took the SELL (145.68) on the breakout below the black ascending trend line with stop loss above the top of the right shoulder (147.18).

GBPJPY Daily Chart 4.18.2019


GBPJPY Daily Chart May 18/2019 : The pair has moved lower and HIT the 1st Target Support Level. GBPJPY broke below the neck line of the bearish Head & Shoulders pattern as anticipated and also broke below the Descending Triangle Breakout Pattern which was the 2nd market pattern that formed. The confluence of the triangle breakout level and the H&S neck line breakout level added more traders/bears to enter the market which pushed the pair lower.

GBPJPY Daily Chart 5.18.2019


GBPJPY Daily Chart June 16/2019 : The pair has continued lower with a strong bearish momentum and has also HIT the 2nd Target support Level at 137.28 from SELL entry 145.68 which is a +840 pip move. The question now is will GBPJPY continue lower and hit the next Target Support Level ??? Only time will tell what the pair will do but for the meantime I will remain bearish.

GBPJPY Daily Chart 6.16.2019


Of course, like any strategy/technique, there will be times when the strategy/technique fails so proper money/risk management should always be used on every trade. Hope you enjoyed this article.
 

Elliottwave-Forecast

Master Trader
Feb 17, 2017
2,453
9
84
www.elliottwave-forecast.com
Australian Dollar dropped further last week as unemployment figure came out higher than expected at 5.2%. The consensus has been for a dip to 5.1%. Australian unemployment rate has now risen 0.3% since February. The official number has raised speculation that further interest rate cut will come.


RBA (Reserve Bank of Australia) has been fighting low inflation rate below 2-3% target range for several years now. In February, RBA has said that sustained increase in unemployment rate would require them to cut interest rates. On May, the central bank cut the rate by 25 basis point to a record low 1.25%. RBA provide little guidance on the direction of future cash rate. However, due to soft economic data and the fallout from China-US tariffs globally, investors bet on further aggressive rate cuts by RBA.

Futures suggest a 66% probability that RBA will further cut cash rate in July. The market also starts to price in another cut by the end of the year to 0.75% due to the mixed labour report.

EURAUD Bullish Elliott Wave Sequence Points for more Australian Dollar Weakness


Elliott Wave outlook in $EURAUD shows a 5 swing bullish sequence from July 2012 low, favoring more upside. A 100% extension in 7 swing double three structure from July 2012 targets 1.857 - 2.166 area. If pair breaks above Jan 3, 2019 high (1.679), then the next move higher has started and we should see further Australian dollar weakness. Wave b of (y) can be complete already at 1.568, but pair still needs to break above wave a at 1.679 to confirm this view.

EURAUD 4 Hour Elliott Wave Chart


$EURAUD shows a higher high sequence from April 17, 2019 low. If this sequence can extend to 100%, then it should resume higher to at least 1.663 - 1.677 area. Short term dips likely find support in 3, 7, or 11 swing as far as pivot at 1.604 low stays intact. Both the long term and short term Elliott Wave sequence therefore favors continuation higher in the pair and further weakness in Australian Dollar.
 

Elliottwave-Forecast

Master Trader
Feb 17, 2017
2,453
9
84
www.elliottwave-forecast.com
Nasdaq Futures (NQ_F) shows a higher high sequence from June 4 low, favoring further upside. Short term, rally to 7600.75 ended wave (1) and pullback to 7421.48 ended wave (2). Wave (3) rally is in progress as an impulse Elliott Wave structure. Up from 7421.48, wave ((i)) ended at 7536 and wave ((ii)) pullback ended at 7477.75. Wave ((iii)) is expected to end soon and the internal also subdivides as an internal of lesser degree.

Wave (i) of ((iii)) ended at 7541.5, wave (ii) of ((iii)) ended at 7509.25, wave (iii) of ((iii)) ended at 7721.75, and wave (iv) of ((iii)) ended at 7630. Expect wave (v) of ((iii)) to end soon, then Index should pullback in wave ((iv)) before another leg higher in wave ((v)). The 5 waves move higher from June 13 low (7421.48) should end wave 1, then Index should correct cycle from June 13 low within wave 2 before the rally resumes. We don't like selling the Index and expect the Index to continue finding support and extending higher as far as pivot at 7421.48 low stays intact. A break above April 25 peak (7879.5), if it happens, will bolster the bullish view in the Indices.

Nasdaq Futures (NQ_F) 1 Hour Elliott Wave Chart
 

Elliottwave-Forecast

Master Trader
Feb 17, 2017
2,453
9
84
www.elliottwave-forecast.com
Hello fellow traders. In today blog, we will have a look at Chevron Corporation (CVX) which is an American energy corporation based in San Ramon, California. It is one of the worlds largest oil companies. We will explain why CVX is important for commodities like Oil and how it may affect the next move it Oil.

In the chart below you can see the Elliott Wave View of CVX in the weekly chart. We can see that the instrument has a right side tag against 69.65 low. Up from there, it ended red wave I at $133.76 peak in a 5 wave Elliott Wave structure. Below from there, it managed to reach the equal legs of black ((A))-((B)) at 105.01-88.83 areas. Which were the first areas for buyers to appear. We can see nicely that CVX reached the areas and rallied in an impulsive manner, making red wave II pullback complete at its December 2018 low (100.21).

Up from its December 2018 low, it ended black wave ((1)) at 127.20 peak and also the proposed black wave ((2)) pullback at 113.80 low. Above from there, it is close to taking the black wave ((1)) peak. Key will be CVX breaking that peak because than it will show an incomplete sequence to the upside from its December 2018 low making it bullish. The possible target can be the equal legs of black ((1))-((2)) which will come at around 140.50 area.


CVX 07.02.2019 weekly Hour Chart Elliott Wave Analysis


This will have huge effects on other commodities or better said Oil-related stocks. If CVX takes the black wave ((1)) peak then Oil will be supported after all. In the chart below you can see an overlay of the Oil chart and the Chevron stock. We can observe that both are correlated to each other. And if CVX takes the key level of 127.20 then Oil could trade into its equal legs area from January 2016 low. That implies Oil trading at around 93.70-105.80 areas in the future. We did also a blog about the GCC index which is also at a very interesting long-term buying area.


Chevron 07.02.2019 weekly Hour Chart Elliott Wave Analysis


If you are a long term investor your trade should be for several months or years then this can be a good opportunity. It is simple how to operate in this market but sometimes traders lack and make things too complicated. We hope you enjoyed this blog. We wish you all good trades.
 

Elliottwave-Forecast

Master Trader
Feb 17, 2017
2,453
9
84
www.elliottwave-forecast.com
The highly anticipated meeting between the U.S. and China during G20 meeting in Japan has concluded. Both parties agree to resume the trade talks and the U.S also agreed to put on hold additional tariffs on $325 billion Chinese goods for the time being. The U.S. previously has threatened to slap 25% tariffs on all remaining Chinese goods imported to the U.S.

So far, the U.S. has raised tariffs on $250 billion of Chinese imports to 25%. In return, China has imposed 25% tariffs on $60 billion of American goods in a tit-for-tat. President Trump also signaled that he will allow U.S. firms to continue selling products to China's Huawei. He added however that the sales would be fine for equipment which does not pose national-emergency problem.

The temporary truce will buy time for the negotiators to finalize the deal. There's no specific timeline or deadline that the U.S. demanded for the truce. With 2020 election looming, President Trump understands the trade dispute can carry immense political risk. Some recent economic data from the U.S. however paints a slowdown in the economy. In June, PMI (Purchasing Manager Index) fell to 50.1, the worst reading since 2009. A reading below 50 usually signals contraction and recession in the economy.


The U.S. however appears to also have made progress. President Trump said that China will resume some of its purchase of American farm goods even when the U.S. still keeps in place the 25% tariffs.

Despite the good news, the current dispute is still ongoing and the tariffs are still in place. The longer the tariffs are in place, the worse the global economy will be. In addition, there's no certainty that the U.S. and China would come into accord soon, if at all. Nonetheless, the market may cheer the positive development and market sentiment may get a boost next week.

G20 Temporary Truce May Boost Market Sentiment and Support S&P 500 Futures


Market participants seem to position themselves for a good outcome ahead of the G20 meeting. S&P 500 Futures (ES_F) chart above shows a bullish sequence (higher high sequence) from December 26, 2018 low favoring more upside. The rally from December 26, 2018 low to May 1, 2019 high unfolded as an impulse Elliott Wave structure. Thus, the rally can either be wave ((1)) or wave ((A)) as the subdivision is in 5 waves. The Index ended the correction on June 4, 2019 low in 3 waves. The correction can either end wave ((2)) or ((B)). The Index has since rallied and broke above May 1, 2019 high suggesting the next leg higher has started.

Unless the marginal high above May 1, 2019 high is a wave (B) of expanded Flat, then the Index should continue to see more upside as far as pullback remains above June 4, 2019 low (2735). Next week, if ES_F is able to break above June 21 high (2969.25), then it suggests wave (3) has already started. Alternatively, Index still can do another leg lower within wave (2) of ((3)) as a double correction before the rally resumes.
 

Elliottwave-Forecast

Master Trader
Feb 17, 2017
2,453
9
84
www.elliottwave-forecast.com
In this technical blog, we are going to take a look at the past performance of 1 hour Elliott Wave Charts of Nifty index from India, which we presented to members at elliottwave-forecast.com. In which, the rally from 1/29/2019 low showed higher high sequence favored more upside to take place. Also, the right side tag pointed higher against 11109.98 low looking for more upside. Therefore, we advised members not to sell the index & buying the blue boxes remained the preferred path looking for 3 wave reaction higher at least. We will explain the structure & forecast below:

Nifty 4 Hour Elliott Wave Chart From 6/16/2019 Update


Nifty 4 hour Elliott Wave Chart from 6/16/2019 weekend update, in which the rally from 1/29/2019 low showed higher high sequence. Also, it's important to note here that the right side is pointing higher calling for more upside as far as dips remain above 11109.98 low. Up from there, the rally to 12103.05 high ended wave 1. Down from there, the index was expected to make a 3 wave pullback as zigzag structure within wave 2 before more upside can be seen. Therefore, our strategy remained buying the wave 2 Elliott wave dip towards the blue box area looking for more upside.

Nifty 1 Hour Elliott Wave Chart From 6/19/2019 Update


Here's Nifty 1 hour Elliott Wave Chart from 6/19/2019 London update, in which the index managed to reach the blue box area at 11667.36-11460.36 100%-161.8% Fibonacci extension area of ((a))-((b)) as expected. And provided buying opportunity to our members in that area looking for next extension higher or for 3 wave bounce at least.

Nifty 1 Hour Elliott Wave Chart From 6/20/2019 Update


Here's 1 hour Elliott Wave Chart of Nifty from 6/20/2019 London update, in which the index provided the buying opportunity ta blue box area & bounced higher as expected. Allowing members to create a risk-free position shortly after taking the trade at the blue box area. However, a break above 12103.05 high from 6/03/2019 peak remains to be seen for final confirmation of next extension higher & to avoid double correction lower in wave 2 pullback.
 

Elliottwave-Forecast

Master Trader
Feb 17, 2017
2,453
9
84
www.elliottwave-forecast.com
Kospi Long Term Cycles Remain Bullish

The KOSPI Index in the long term has been trending higher with other world indices since inception in 1983. The index began with a base value set at 100 and trended higher until it ended that cycle in 1994. The index then corrected that cycle with the dip into 1998 lows during the Asian Financial Crisis. That is where the monthly chart pictured below begins. From the 1998 lows the index did three bullish swings higher into the November 2007 highs. The pullback from there until October 2008 was strong enough to suggest it was correcting the whole cycle up from the June 1998 lows.

Secondly I would like to mention this is a swing count. It is not an Elliott Wave count. As per the rules an impulse travels in the direction of the trend in 5-9 or 13 swings. When the bullish trend renewed to the April 2011 highs it reached the .618-.764 Fibonacci extension of the June 1998 to November 2007 cycle. This is a usual area for a 5th swing of a cycle. The 6th swing dip to the September 2011 lows corrected that cycle up from the October 2008 lows. The analysis continues below the chart.

Kospi Monthly Chart


Thirdly, how these extension areas are measured. Take the Fibonacci extension tool on a charting platform. On this chart, point 1 will be at the beginning of the cycle at the 1998 lows. From there on up to the 2007 highs, marked with a 3, will be point 2. The point 3 will be down at the 2008 lows. This point is marked with a 4. The extension areas shown are the same as long as price remains above the 2008 lows. As previously mentioned from the 2008 lows the index has bounced in a 5th swing higher as well as correcting that bounce with the 2011 lows. From there the bounce higher into the April 2015 highs did not make new all time highs and the pullback into the August 2015 lows corrected that cycle from the 2011 lows.

Lastly in conclusion the bounce from the 2015 lows ended a cycle on January 2018 and the dip to the January 2019 lows corrected that cycle. It should in the near term remain above there. Until it gets back above the January 2018 highs another swing lower can not be ruled out. However the trend is up and the index should trade higher into the target area at 2700-3126+ area before it sees another pullback of similar magnitude as the one in 2011.

Thanks for looking. Feel free to come visit our website and check out our services Free for 14 days and see if we can be of help.

Kind regards & good luck trading.

Lewis Jones
 

Elliottwave-Forecast

Master Trader
Feb 17, 2017
2,453
9
84
www.elliottwave-forecast.com
Today, I want to share some Elliott Wave charts of the Tesla stock which we presented to our members in the past. Below, you see the 1-hour updated chart presented to our clients on the 06/30/19.

Tesla short-term cycle ended in a black wave ((1)). Below from there, we advised members that it should see the equal legs from 06/18/19 peak towards the areas of the 100 - 1.618 Fibonacci extension of blue wave (a)-(b) which came around 216.50-208 and unfolded as an Elliott Wave flat structure. Therefore, we expected buyers to appear in the sequences of 3, 7 or 11 swings. And that was the first area for buyers to appear to take prices to new high or a larger 3 waves reaction at least. You can see that the stock reached the blue box and reacted higher. Due to the fact that we went with the more aggressive view, by calling black wave ((2)) pullback completed at around 212 low we expected Tesla to extend higher. One of the reasons was the ES Futures. The Benchmark equity has been showing a bullish sequence. making the right side to the upside. This will project also to U.S. stocks as well.


TESLA 06.30.2019 1 Hour Chart Elliott Wave Analysis


In the last Elliott Wave chart, you can see that TSLA managed to extend very nicely to the upside. The more aggressive which we presented above proved to be the right one. The stock rallied very aggressively to the upside and eventually made a new high above black wave ((1)) peak, making it an incomplete sequence from 6/04/2019 low looking for more upside. Do please keep in mind that the 1-hour chart which I presented may have changed already. The blue boxes you see in our charts are our so-called High-Frequency boxes. Where the market ideally shows us a reaction either lower or higher.

If you are interested in how to trade our blue box areas and want to understand how Elliott Wave works. Then I recommend you to get a shot with our risk-free 14 days trial below.


TSLA 07.03.2019 1 Hour Chart Elliott Wave Analysis


I hope you enjoyed this blog. I wish you all good trades and if you interested in learning more about our unique blue box areas and also want to trade profitably. You can join for 14 days free trial. See you insight!

We believe in cycles, distribution, and many other tools in addition to the classic or new Elliott Wave Principle.
 

Elliottwave-Forecast

Master Trader
Feb 17, 2017
2,453
9
84
www.elliottwave-forecast.com
USDJPY Technical Analysis

USDJPY last week signalled bulls to enter the market. Why did traders decide to "BUY" the USDJPY pair towards the end of the week for a push higher? Some speculators will say because of fundamental analysis/news but technical traders will say because price hit a confluence zone. Trading confluence is when 2 or more trading strategies converge together and offer a high probability BUY/SELL trade setup. Using different trading strategies to all line up together in a specific price area/zone will offer the trader more confidence in taking the trade and will offer a clearer trade setup where stops, entry and targets can be set in advance. Combining different trading strategies can also be used as "trading filters" to signal the trader on which side to take the trade.

USDJPY 1 Hour Chart 6.28.2019: In the chart below, on June 28/2019 price reacts to a support/resistance zone (filter #1) that a possible bounce higher can happen. A reaction from this zone allows a trader to identify that this particular zone will be an important area where price will possibly signal which side it wants to continue moving on.


USDJPY 1 Hour Chart 7.5.2019: In the chart below, price pushes higher at the market open of the following week which then forms a possible bullish pattern (blue) where the pattern BUY entry triggers if price moves back lower and hits the BC 0.50% Fib. retracement level. The blue bullish pattern (filter #2) buy entry aligns with previous support zone that was established in the chart above. The stochastic indicator (filter #3) is also registering below the 20 level indicating that price is "oversold" and signalling traders to watch for buying opportunities. Watching the stochastic hit the "oversold" area together with price hitting the support zone triggered more buyers to enter the market. Price reacts higher from the support zone and forms an inverted bullish head and shoulders breakout pattern (green) where more buyers entered the market on the break above the neck line of the bullish pattern (filter #4). Combining trading strategies that are all aligning entry in the same area/zone and are all signalling the same possible direction will give a trader more confidence in entering the market.

Filter #1 Support/Resistance Area, Filter #2 Bullish Market Pattern (blue), Filter #3 Stochastic Indicator, Filter #4 Inverted Head and Shoulders Market Breakout Pattern (green)


Of course, like any strategy/technique, there will be times when the strategy/technique fails so proper money/risk management should always be used on every trade. Hope you enjoyed this article.
 

Elliottwave-Forecast

Master Trader
Feb 17, 2017
2,453
9
84
www.elliottwave-forecast.com
Cisco Systems, Inc. (NASDAQ: CSCO) is an American multinational technology conglomerate that develops, manufactures and sells networking hardware, telecommunications equipment and other high-technology services and products. In the age of cloud-based services, Cisco has built its business by providing top-shelf internet connectivity hardware and services for years. providing Internet Protocol-based routers and switches that move data, voice, and video packets across networks.

In today's article, we'll take a look at the technical structure of the stock using the Elliott Wave Theory.

Since December 2018, CSCO rallied higher significantly (40%) breaking above 2018 peak. The advance higher is proposed to be an impulsive 5 waves move which was followed by 3 waves pullback Zigzag Structure into the blue box area $51.28. Up from there, the stock reacted higher again in 5 waves move taking the shape of a Leading Diagonal and it managed to trade above 2019 April peak.

The break higher crated a "Bullish Sequence" is suggesting that CSCO will continue the rally higher in a similar impulsive structure as long as it remain above $51 low and it will be aiming for a target to the upside toward $68 - $79 area before another correction can take place in a similar manner.

We have created the so-called sequences and Blue Boxes and a lot of other tools which we are using on a daily basis to locate the Right Side of the market. The blue boxes in our charts are the High-frequency areas where the Markets are likely to end cycles and make a turn therefore we use them in within our high accuracy system which acts as a great trading tool.

CSCO 8 Hour Chart 07.08.2019


Elliottwave-Forecast

Master Trader
Feb 17, 2017
2,453
9
84
www.elliottwave-forecast.com
Energy Inc. (CVI) stock can be one of the most telling instruments across the Market today. The instrument is showing a Bullish sequence in the Daily and 4 Hour timeframe, making the right side to the upside.

We at Elliottwave-Forecast have taken the orthodox Elliott Wave Theory and made some changes to the existing Theory. A new concept which is more related to today's trading environment.

We have created the so-called sequences and Blue Boxes and a lot of other tools which we are using on a daily basis to locate the Right Side of the market. The initial concept is very simple to understand. Now, let's have a look at the actual Energy Inc. stock.

CVI reached perfectly in the past the equal legs of blue (w)-(x) towards 12.04+ areas and in the same year Oil created a low. The bullish sequence in CVI will eventually support Oil into the $100.00 area. This provides the clue for the whole Energy sector, making them also bullish. Instruments like XOM and CVX will be supported against the December 2018 lows and their Mai 2019 lows as well. That gets confirmed when both take their Mai 2019 peak. The following chart is showing CVI in the weekly timeframe.


Energy Inc. Weekly Elliott Wave Analysis 7.10.2019


The weekly view in Energy Inc. is showing why it is bullish and consequently should support Oil and other energy stock as well. Therefore, we would like to buy Energy Inc. against the red II low in the first and against the blue (II) in the second degree. But most importantly, we do not like selling any Energy sector related instruments because the overall right side is higher. Also, this sequence in CVI supports World Indices because they have an alignment with the right side as well.


GCC Overlay with CVI and Oil 7.10.2019


The Chart above is showing the relation between CVI, GCC and Oil which proves the idea that the Market trades the same side. Noteworthy is the idea that GCC is within a weekly Bullish buying area, which will add more conviction to the CVI bullish sequence and consequently to the whole energy sector.
 

Elliottwave-Forecast

Master Trader
Feb 17, 2017
2,453
9
84
www.elliottwave-forecast.com
EUR and GBP have seen a strong sell off against Canadian Dollar in the last few weeks and in this article we will take a look at the swing sequences in EURCAD and GBPCAD to present the path of least resistance and also look at the future targets.

EURCAD Cycle from 3.2018 Peak is Incomplete
Chart below shows the cycle from 3.2018 peak is still in progress and with the break below 10.2018 low, 1.43518 - 1.34877 is the next logical target. As far as bounces fail below the peak at point "6", the target area shown with blue box remains valid. Furthermore, there is a bearish sequence down from 1.2019 peak which also calls for more downside. Structure of the decline from 1.2019 peak could either be a Zigzag Elliott Wave structure or a corrective double three Elliott Wave structure. In either case, the target remains valid as far as bounces remain below 3.6.2019 (1.5228) peak. In case the decline from 1.2019 peak is unfolding as a Zigzag Elliott wave structure, bounces will be shallow and in case it's unfolding as a double three Elliott wave structure, we could soon see a bigger bounce to correct the decline from 3.6.2019 (1.5228) peak before pair turns lower again. In either case, bounces should find sellers in 3, 7 or 11 swings until 1.43518 - 1.34877 area is not reached. Once this area has been reached, then we expect to see the buyers appearing to produce a larger 3 waves bounce which should correct at least the cycle from 1.2019 peak.


GBP - Canadian Dollar Cycle From 3.2018 Peak is Incomplete

GBPCAD cycle from 3.2018 peak is also incomplete because it has not yet reached the ideal target at 1.59801 - 1.55502. Structure of the decline from 3.2018 peak is likely to become a zigzag because so far pair has not shown any reaction from 0.618 - 0.764 Fibonacci extension area of the decline from 3.2018 high to 8.2018 low which supports the view that it would get to 1.59801 - 1.55502 area without a major bounce in the middle but even if we do get a bigger bounce and structure of the decline from 3.2018 peak becomes 7 swings, pair should still find sellers in the bounce in 3, 7 or 11 swings until it doesn't reach 1.59801 - 1.55502.


Looking at these two charts, it becomes evident that EUR and GBP should remain weak against CAD until EURCAD doesn't reach 1.43518 - 1.34877 and GBPUSD doesn't reach 1.59801 - 1.55502 area.
 

Elliottwave-Forecast

Master Trader
Feb 17, 2017
2,453
9
84
www.elliottwave-forecast.com
eBay (NASDAQ: EBAY) is the world’s largest online marketplace that facilitates consumer-to-consumer and business-to-consumer. The company was founded in 1995 and currently operating in about 30 countries.

The stock is up nearly 40% so far this year and the move higher was supported by a better-than-expected first-quarter results which saw improvement across several key operating metrics. The company is scheduled to report earnings after today's market close Wednesday, July 17 and investors are looking for further confirmation about the recent enhancements.

We believe the market is ruled by technical aspect and the news is an after-fact event to drive the market into the pre-determined direction, therefore it's important to understanding the Nature of the Market is key for traders which doesn't have anything to do with Fundamentals or events.

Based on Elliott Wave Theory , EBAY rally from December 2018 low unfolded as an impulsive 5 waves move which ended red wave I followed by a correction in 3 waves pullback in red wave II then the stock turned to the upside again creating a higher high bullish sequence which is aiming for a target higher at equal legs area $48 - $51.

eBay 4H Chart 7.17.2019


In the above 4H chart, we are looking for eBay to remain supported above $35.45 low and ideally it will find buyers in any 3 swings or 7 swings pullbacks taking place in the short term. The bullish sequence which started form December 2018 low is part of a larger degree cycle which can be observed on the next chart.

eBay Weekly Chart 7.17.2019


The sequence tags and Blue Boxes presented in our charts alongside other tools are used on a daily basis to locate the Right Side of the market which is in the case of ebay " higher ". Consequently, as long as the stock trade above 26 then it will be aiming to continue the rally higher within the main weekly trend with a minimum target for a 5th wave at $52 - $60 area which means new all time highs will be expected to be seen in the coming weeks.
 

Elliottwave-Forecast

Master Trader
Feb 17, 2017
2,453
9
84
www.elliottwave-forecast.com
Since Prime Minister Theresa May announced she stepped down from leadership position, the market has started to adjust the expectation for a hard Brexit scenario. Selling pressure on Poundsterling has intensified as the new prime minister hopefuls Boris Johnson and Jeremy Hunt adopted a hardline approach. Under the previous leadership of Theresa May, market previously anticipated a soft Brexit. This scenario includes access to a single market or maybe a second referendum. This probability now has decreased with the leadership change.

The pound has already lost more than 2% against the dollar since early July. It is also the worst performing currency against the dollar this year. The latest Brexit deadline is October 31. This gives the new British government just over three months to secure a deal that May failed to deliver in three years. Both prime minister candidates said they can get Brussels to change the deal made by May. In order to win the approval by the parliamentary, the new deal needs to change the Irish border backstop clause.

Brexiteers believe if London took a harder line and threatened to leave the EU without a deal, Brussels would be scared and back down. However, there is little indication that the EU intends to give the new prime minister any significant concession. Below we will take a look at a couple of Elliott Wave scenarios and the impact to Poundsterling.

Hard Brexit: Poundsterling breaks below 1985 all-time low


In the worst possible outcome (Hard Brexit) scenario, Cable (GBPUSD) can do a double zigzag from April 1972 high. In the chart above, the pair can potentially break below the all-time low on February 1985 (1.052). A 100% extension from April 1972 high is 0.517. It doesn't mean the pair will go there for sure if it breaks below 1.052, but the above chart provides the worst case scenario for GBPUSD.

Soft Brexit: Poundsterling Holds above 1985 all-time low


If the new government softens the stance or the new government can secure a deal with Brussels, then Cable has the potential to hold above the 1985 all-time low. In the scenario above, the move lower from February 1991 high is unfolding as an expanded Flat where the pair is within wave c as a diagonal. In shorter cycle, the pair can continue to see pressure. The break below 1985 low however likely won't happen unless we have a clear outcome in Brexit.
 

Elliottwave-Forecast

Master Trader
Feb 17, 2017
2,453
9
84
www.elliottwave-forecast.com
Importance of an Elliott Wave ZigZag Fibonacci Extension

Firstly the point of measuring a Fibonacci extension is to get the area pinpointed that an Elliott Wave correction will move against the trend so an entry position into the market can be taken. The conventional thought is that the market will trend in impulses of 5, 9, & 13 swings as well as the corrections against the trend move in 3, 7 or 11 swings. The only exception to that is a stand alone triangle which is five sideways three swing cycles. All things considered, I think you will see how these measurements are very simple and easy to do.

There are five types of corrective patterns. Zigzag (5-3-5), Flat (3-3-5), Triangle (3-3-3-3-3), Double three that is a combination of two corrective patterns previously mentioned & lastly a Triple three that is a combination of three corrective patterns mentioned above. Continued below the zigzag graphic.


Secondly you will need a Fibonacci extension tool on your chart platform. Go to the settings where you can adjust the measurement levels. Set it to show you the 61.8%, 100.%, 123.6% & the 161.8%. Referencing the zigzag shown in the image above. This structure will subdivide (5-3-5). Wave A and C is 5 waves, either an impulse or diagonal. In addition the wave B can be any corrective structure. This works the same way in any time frame.

On this chart, point 1 will be at the beginning upper left side. Presume a bullish cycle ended there. Go from there down to the wave A low as point 2. From there the point 3 will be at the top of the wave B. This will give the projected Fibonacci extension area for the wave C which usually will be the 100.% to 123.6% of the wave A. If the proposed wave C reaches to or past the 161.8% Fibonacci extension, that gives concern something bigger is going on. It may be the third wave of an impulse and a possible trend change.

In conclusion the reason I previously mentioned the 161.8% extension is that we generally suspect we are looking at an Elliott Wave wave three when & if that extension is reached or surpassed. In the final analysis we don't normally label a conventional impulse 12345 unless the 3rd wave is 161.8% of the wave 1.

Kind regards & good luck trading.

Lewis Jones
 

Elliottwave-Forecast

Master Trader
Feb 17, 2017
2,453
9
84
www.elliottwave-forecast.com
Last week, traders got spooked by the yield curve inversion of the most closely watched 2 year vs 10 year bonds. Yield curve inversion between 2 year and 10 year bond is a powerful predictor of recession. The 2-10 yield curve inversion preceded the past seven recessions from 1969. This means that the interest rates of the 10 year Treasury bonds bonds fall below the 2 year Treasury note. In a normal market, short term debt should be safer than the longer dated one as short term debt will be paid quickly. Short term debt in normal situation therefore should provide lower interest rate to the holders than the longer term debt.

In a yield curve inversion, the short term debt offers a higher interest rate. This potentially reflects a lack of confidence in the country's near-term economic health. That's what happened last week as the yield from 2 year US treasuries note became higher than the yield from 10 year bonds. The bond market thus flashed a warning signal even though US equity market is still relatively supported.


An inverted yield curve doesn't necessarily mean the stock market will turn bad immediately. It can take 2-3 years for a recession to hit after the 2 year and 10 year curve inverts. What this means though is that equity markets may be nearing its important peak. In the last recession, the yield curve inverted on December 27, 2005, which was 2 years before the Lehman's collapse sent the economy into recession. Other parts of the curve have already inverted. Last December, the yield on 5 year Treasury note fell below the yield on 3 year note. Then in March, the yield on the 3 month Treasury Bill fell bellow the yield on 10 year note. Concerns over global slowdown and uncertainties in US China trade war have weighed heavily on longer term US Treasury yields.

S&P 500 Long Term Elliott Wave View


S&P 500 long term view above suggests that the entire rally from all-time low is in 3 waves. We can either label this move as (I)-(II)-(III) or alternatively as (a)-(b)-(c). Wave (I) / (a) ended in year 2000. The subsequent correction took the form of an expanded Flat and bottomed in 2009. Since then, we are in a 10 year bull run and the Index is now more or less reaching the 161.8% Fibonacci extension. If history is any indication, the stock market may still do last-gasp rally in wave (V) after the initial recession warning. However, at minimum, we at Elliottwave-Forecast believe cycle from 2009 is mature and lives on borrowed time. So expect at minimum a sizable pullback in wave (IV) in the next 6 months - 1 year.

The market will then decide if we only end cycle from 2009 in which case the Index then can do 1 more leg higher in wave (V). Alternatively, the entire rally from all-time low completed as (a)-(b)-(c) and we will then be in the biggest correction.

S&P 500 Shows Signs of Weakness


The chart above shows that the Index attempts to break the ascending trend line from 2018. If the selloff gains acceleration, then the next strong support is around 2125 - 2470. This area has the Fibonacci support of 23.6 - 38.2 retracement. It also has the support of 200 Weekly Moving Average (the red line) as well as the ascending trend line from 2009 low.

Please keep in mind that the Index does not need to immediately break down to this level, and at this point it can still rally and make further upside. However, the chart above is one possible scenario in a wave (IV) type of pullback. From 2125 - 2470 area, the Index has a chance to do a final rally in wave (V). Alternatively, Index can do a big 3 waves bounce before turning lower again.
 

Elliottwave-Forecast

Master Trader
Feb 17, 2017
2,453
9
84
www.elliottwave-forecast.com
GLD Longer Term Cycles and Elliott Wave Analysis

Firstly the GLD ETF fund is one of the largest as well as one of the oldest Gold tracking funds out there since it's inception date of November 18, 2004. From there on up into the September 2011 highs it ended a larger bullish cycle as did the Gold commodity in terms of US dollars. From the September 2011 highs the price decline was pretty steep however does appear corrective as a double three (a)-(b)-(c) (in blue color) into the December 2015 lows.

The analysis continues below the monthly chart.


Secondly I would like to mention that the bounce from the December 2015 lows at 100.23 into the July 2016 wave (I) highs (in blue) is clearly an Elliott Wave impulse. The bounce was strong enough to suggest it ended the cycle lower from the September 2011 highs as well thus at this point it is very much suspected to be resuming a long term bullish trend from the December 2015 lows. As shown above from there the metal made a wave (I) high in July 2016. From there it appears to have made an a-b-c (in red) running flat structure to end the wave (II) (in blue) at the August 2018 lows of 111.06.

The analysis continues below the weekly chart.


Thirdly in conclusion: From the wave (II) (in blue) lows of August 2018 lows at 111.06 the bounce higher in wave ((1)). It was strong enough to suggest it was finished with the wave (II) running flat structure.

In summary the cycle higher from the August 2018 lows appears to have an incomplete bullish sequence of five waves up in an Elliott Wave impulse. There is not a lot of time separation in the wave ((4)) (in black) related to the wave ((2)) (in black). However the technical indicators we use here suggests the pullback into the wave ((4)) lows (in black) from 8/1/2019 corrected the cycle up from the April 2019 wave ((2)) lows. The minimum target area for wave ((5)) of I has been reached. However while it remains above the 8/1/19 lows it may see the wave ((5)) equals wave ((1)) area at 148.45. Afterward it can see a pullback in the wave II (in red) correct the cycle up from the August 2018 lows before resuming higher again.