Elliottwave-Forecast

Master Trader
Feb 17, 2017
2,426
9
84
www.elliottwave-forecast.com
AUDJPY shows an incomplete Elliott Wave sequence from April 17, 2019 high, favoring more downside. The 100% target can reach as low as 75.7 – 76.3. In the chart below, the bounce to 78.94 ended wave 2. Wave 3 is currently unfolding as an Elliott Wave impulse with wave ((i)) of 3 ended at 76.77. The internal of wave ((i)) subdivided as another impulse structure of lesser degree. Wave (i) of ((i)) ended at 77.81 and wave (ii) of ((i)) ended at 78.18. Down from there, wave (iii) of ((i)) ended at 76.96, wave (iv) of ((i)) ended at 77.55, and wave (v) of ((i)) ended at 76.77.

Wave ((ii)) is in progress to correct cycle from 4/30 high as a zigzag Elliott Wave structure. Up from 76.77, wave (a) of ((ii)) ended at 77.59 and subdivided as 5 waves impulse. Wave (b) of ((ii)) ended at 77.17 and subdivided as an expanded flat. Expect wave (c) of ((ii)) to reach 78 – 78.5 before pair resumes lower again. We don’t like buying the pair and expect rally to fail at the blue box as far as pivot at 78.94 high stays intact.

AUDJPY 1 Hour Elliott Wave Chart
1AUDJPY-6020190507115511.jpg
 

Elliottwave-Forecast

Master Trader
Feb 17, 2017
2,426
9
84
www.elliottwave-forecast.com
Summary
  • The odds of trade war escalation rises after Trump sent a pair of tweets threatening to increase tariffs to Chinese goods.
  • If there is no deal by this Friday, the tariffs to Chinese goods will rise to 25% from 10% on $300 billion. Additional $325 billion of Chinese goods will also get 25% tariff.
  • The rapid deterioration is due to the reversal of China's commitment to address the U.S. core complaints.
  • U.S companies with huge presence and sales in China, like Apple, can suffer if there's trade war escalation.
  • Elliott Wave Analysis on Apple suggests another major correction can happen.
Over the weekend, President Trump sent a pair of tweets threatening to increase tariffs from 10% to 25% on $200 billion of Chinese goods. This increase will happen on Friday this week. In addition, Trump also said he will implement 25% tariff on $325 billion additional Chinese goods.


Trump sent a pair of tweets again today provoking China by saying he's very happy with the additional tariffs


These tweets left no room for the U.S. to back down. U.S. Trade Representative Robert Lighthizer also made it clear that additional tariffs will apply this Friday despite the ongoing talk. Lighthizer is one of China hawks in Trump administration. He has pushed for an enforcement mechanism

News start to surface that the U.S. lose their patience after China backtracks their commitments to address U.S. complaints. Beijing returned a draft agreement to Washington late on Friday night with reversal to concessions on core U.S demands. The U.S. complaints center on the areas of intellectual property and forced technology transfer. There are several other areas such as market access for cloud computing firm and also currency manipulation. China has apparently gone back on all the major concessions it had made during the negotiation.

Chinese negotiators said they could not change the domestic laws, as such changes will be major and can't be done quickly. They also accuse the U.S demands becoming harsher as the negotiations drag on. Vice Premier Liu He will still visit Washington on Thursday, but the odds that the two sides can reconcile after this event seems to be slim at this stage.

For months, investors and market seem to believe that the two largest economies are close to making a deal. The markets are trading at near high or all-time high when President Trump sent the tweet on Sunday. The news immediately sent the stock market and commodities into free fall on Monday open. The sell-off can keep going if there's no deal by Friday.

$AAPL Apple Elliott Wave Daily Chart


Apple has a lot of stake if the U.S and China trade war escalates. China is one of the company's biggest markets. Revenue from Greater China market made up 20% of Apple's total revenue of $229.2 billion. In terms of operating profit, Greater China accounted for 21.9% of Apple's total operating profit in last financial year. China is also one of the manufacturing base for Apple's products, such as iPhone, iPad, and Macbook.

The stock had a big 39% drop from October 3, 2018 high last year. The stock has recovered nicely after bottoming on January 3, 2019 low. However, it's now at the area where it can end the cycle from January 3, 2019 low and turn lower in 3 waves at least. If the U.S. escalates the trade war this week, the stock can start to turn lower and at least pullback in 3 waves to correct cycle from January 3, 2019 low.

Conclusion
The months long trade negotiation between China and U.S. come into the final week. Recent deterioration of the talk due to China's reversal of its commitment is a cause of concern for investors. The rising odds of escalation this week sent the stock market and commodities tumbling. The selloff can potentially continue if there's no agreement by this week. U.S. companies with significant stake in China, such as Apple, can suffer in the case of trade war escalation.
 

Elliottwave-Forecast

Master Trader
Feb 17, 2017
2,426
9
84
www.elliottwave-forecast.com
EURUSD Technical Analysis May 7/2019

EURUSD : Bearish market patterns can be seen on the EURUSD 15 minute chart. In the chart below blue bearish pattern triggers SELLS at the BC 0.50% Fib. retracement level. The orange bearish pattern already has triggered SELLS at the AB=CD 1.0% Fib. extension level signalling for more downside in the coming trading sessions. If looking to SELL EURUSD traders should be patient and wait for price to make a minimum move higher to the BC 0.50% Fib. retracement level. Waiting for price to move to the minimum BC 0.50% Fib. retracement SELL level will offer a better risk/reward trade setup. Blue bearish pattern is invalidated if price moves above point B of the blue bearish pattern and stops should be placed at this level. Also watch for the pink moving average (15 EMA) to remain below the pink horizontal line for more confirmation that the pair will extend lower. If the moving average trades above the pink horizontal line EURUSD most likely will continue higher and the trade will be stopped out for a loss. The targets (green) are based on the blue bearish pattern BC 0.50% entry. As long as the May 7/2019 high holds EURUSD has a strong probability of making another move lower. Only time will tell what EURUSD will do but at least now you are aware of the SELL ZONE where the pair can possibly reverse lower from.

EURUSD 15 Minute Chart 5.7.2019


Of course, like any strategy/technique, there will be times when the strategy/technique fails so proper money/risk management should always be used on every trade. Hope you enjoyed this article.

*** Always use proper risk/money management according to your account size ***
 

Elliottwave-Forecast

Master Trader
Feb 17, 2017
2,426
9
84
www.elliottwave-forecast.com
Short Term Elliott Wave view on GBPJPY suggests that further downside is expected. On the chart below, wave ((iii)) ended at 143.74 and wave ((iv)) bounce ended at 146.51. Pair has since broken to new low below 143.74, validating the downside bias. Internal of wave ((iv)) unfolded as a zigzag Elliott Wave structure where wave (a) ended at 145.87, wave (b) ended at 144.78, and wave (c) ended at 146.5.

Wave ((v)) is currently in progress as an Elliott Wave impulse structure. Down from 146.5, wave (i) ended at 144.96, wave (ii) ended at 145.37, and wave (iii) ended at 143.62. Internal of wave (i) and (iii) also subdivided as an Elliott Wave impulse in lesser degree. Expect wave (iv) bounce to fail in 3, 7, or 11 swing for further downside. We don't like buying the pair. Potential target for wave (iv) is 23.6 - 38.2 Fibonacci retracement of wave (iii) which comes at 144.28 - 144.48 area. Ideally the rally does not extend to more than 50% of wave (iii) at 144.48 as that can increase the risk that the cycle from May 3 high has ended. As far as wave (ii) pivot at 145.37, and more importantly pivot at 146.5 stays intact, the right side remains lower.

GBPJPY 1 Hour Elliott Wave Chart
1GBPJPY-6020190507202818.jpg


Elliottwave-Forecast

Master Trader
Feb 17, 2017
2,426
9
84
www.elliottwave-forecast.com
Last month, we looked at the bearish incomplete sequence in $KC_F (Coffee) since 11.8.2016 peak but today we would be looking at the Elliott wave structure of the decline from 11.8.2016 peak in the daily time frame and decline from 10.19.2018 peak in the 480 minute time frame to give readers an idea of where we are in the decline at the moment and what opportunities could be knocking on the door soon.

KC_F (Coffee) Daily Elliott Wave Structure
We are labelling the cycle from 2014 peak as a "c" wave diagonal of a zigzag structure down from 2011 peak. Rally to 2016 peak is labelled wave II of this proposed "c" wave Ending Diagonal structure. Down from there, Coffee dropped in 7 swings to $95.10 as a double zigzag Elliott wave structure. This labelled as ((W))-((X))-((Y)) when both ((W)) and ((Y)) unfolded as a zigzag and hence why it's called a double zigzag structure.


KC_F (Coffee) 480 minute Elliott Wave Structure
Decline from 10.19.2018 peak which is being labelled as wave IV of the proposed "c" wave diagonal is unfolding as an impulse when decline to 107.55 completed wave (1), bounce to 117.00 completed wave (2), down from there drop to 98.60 was wave 1 of (3), rally to 107.25 completed wave 2 of (3) and new lows to 86.35 could be viewed as wave 3 of (3). Swing recovery to 95.25 completed wave 4 of (3) and now new lows towards 84.25 - 80.82 should complete wave 5 of (3). Afterwards, we would expect another bounce in wave (4) in 3, 7 or 11 swings before it resumes the decline in wave (5) of ((A)) towards 75.76 area as shown on the daily chart. Failure to break below 86.35 and a break above 95.25 would suggest we are still in wave 4 as a double correction and should then still turn lower again. Alternatively, we could be in blue (5) lower already.


Elliottwave-Forecast

Master Trader
Feb 17, 2017
2,426
9
84
www.elliottwave-forecast.com
Hello fellow traders. In this technical blog we’re going to take a quick look at the Elliott Wave charts of NASDAQ. As our members know NASDAQ has been trading higher within December 2018 cycle. It has been showing incomplete bullish sequences in the cycle from the 6964.7 low as well, calling for further strength. Consequently, we advised members to avoid selling the pair and keep on favouring the long side. In the following article, we’re going to explain the Elliott Wave structure and Forecast.

NASDAQ 1 Hour Elliott Wave Analysis 4.18.2019
NASDAQ is trading within incomplete December cycle. Currently we are getting short term pull back -wave (4) blue, that can be unfoloding as Elliott Wave Double Three Pattern. Inner structure of the pull back is labled as WXY red, when we can be still in Y red. As of right now pull back looks incomplete, calling for another short term swing down toward 7663.3-7629.6 ( buyers area). We don’t recommend selling NASDAQ at this stage and favor the long side. As our members know Blue Boxes are no enemy areas , giving us 85% chance to get a bounce. The main trend is bullish and we expect to see reaction in 3 waves up from the blue box at least. As soon as the bounce reaches 50 fibs against the X red high, we will make long positions risk free and let the profit run.


NASDAQ 1 Hour Elliott Wave Analysis 4.18.2019
Eventually we got proposed leg down to complete incomplete sequences from the peak. Due to current price structure count of the pull back has been changed to ABC red- ZIG ZAG. Anyway, buyers appeared right at the blue box when pull back completed at 7660.7 low. NASDAQ has given us nice reaction up from the blue box and then sharp pull back which is very deep. We still expect price to hold above 7660.7 low. Now, we would like to see further sepparation from that low and break toward new high. We need to see break above (3) blue peak to get confirmation next leg up is in progress. At this stage all long positions should be risk free.


NASDAQ 1 Hour Elliott Wave Analysis 4.18.2019
Although short term pull backs where very deep, 7660 low has held nicely and we got expected rally. Finally we got break above (3) blue peak, confirming next leg up is in progress. As a result members who took long trades, now enjoying profits in risk free positions.

Keep in mind that market is dynamic and presented view could have changed in the mean time. Best instruments to trade are those having incomplete bullish or bearish swings sequences. We put them in Sequence Report and best among them are shown in the Live Trading Room. You can check most recent charts in the membership area of the site.


Elliottwave-Forecast

Master Trader
Feb 17, 2017
2,426
9
84
www.elliottwave-forecast.com
In this blog, I want to share with you some Elliott Wave charts of GBPAUD which we presented to our members. In the chart below You see the 4-hour updated chart presented to our clients on the 04/17/19. The higher degree trend of the pair is to the upside because of Bullish Sequence stamp. So our members know that the right side is higher. Consequently, we advised members that we like buying the pair.

GBPAUD ended the cycle from 01/11/19 low in blue wave (3) at 03/14/19 peak (1.88562). Below from there, we expected a pullback to occur in blue wave (4). The pullback unfolded in an Elliott Wave Double Three correction structure. We advised members that GBPAUD should continue higher and that we wanted to buy the pair. Therefore, we expected buyers to appear in the sequences of 3, 7 or 11 swings. At the 100 - 1.618 Fibonacci extension of red W-X which came at around 1.81998-1.78720 area and that was the first area for us to buy with a potential stop loss below 1.78720 level.


GBPAUD 04.17.2019 4 Hour Chart Elliott Wave Analysis


In the last Elliott Wave chart. You can see that the GBPAUD reacted nicely from the blue box area. Any trades from our blue box area shown in the chart above are risk-free by now, which means the stop-loss should be moved to break even, looking now for more upside. Please keep in mind that the 4-hour chart which I presented can have changed already. This blog should just illustrate how accurate our blue boxes are, and how our members trade our 3-7 or 11 swings strategy.

If you are interested in how to trade our blue box areas and want to understand how Elliott Wave works. Then I recommend you to get a shot on our 14 days free trial below. We present a lot of trading setups in our 3 Live Trading Rooms.


GBPAUD 05.07.2019 4 Hour Chart Elliott Wave Analysis


We provide precise forecasts with up-to-date analysis for 78 instruments including Forex, Commodities, ZN (10 year note yields), World Indices, Stocks, ETFs and Bitcoin. Our clients also have immediate access to Market Overview, Sequences Report, 1 Hour, 4 Hour, Daily & Weekly Wave Counts. Daily & Weekend Technical Videos, Live Screen Sharing Sessions, Live Trading Rooms and Chat room where they are provided live updates and given answers to their questions. The guidance of ElliottWave-Forecast gives subscribers the wherewithal to position themselves for proper entry and exit in the markets. We believe our disciplined methodology and Right side system is pivotal for long-term success in trading. If you want to become a member then Click on the Banner above. See you insight!
 

Elliottwave-Forecast

Master Trader
Feb 17, 2017
2,426
9
84
www.elliottwave-forecast.com
Summary
  • The months-long trade negotiation between the U.S and China has failed to reach an agreement.
  • Sticking points of the negotiation centers around intellectual property and technology transfer. The two sides can not come into agreement yet.
  • The U.S. has increased the tariffs and China has retaliated, effectively escalating the trade war.
  • One of the hardest casualties of this trade war from U.S side is U.S farmers. China has targeted them as they are Trump's political base supporters.
  • Soybean extended lower after the failure of the talk and made 10 year low. Elliott Wave outlook still looks for further downside.
In our previous article, we highlighted the risk of failure after the U.S. alleged China backtracking on their previously agreed positions. Trump followed through on his threat on raising tariffs after the breakdown in the negotiation. On Friday, the U.S. increased tariffs on $200 billion of Chinese goods. Then on Monday, China retaliated by raising tariffs on $60 billion of American goods in 5000 types of American products. China outlined their requirements for the trade deal to the state media.

There are three key demands by China:

  1. Removal of all U.S. tariff.
  2. Purchases of U.S goods needs to align with market demand.
  3. Trade agreement should have balanced text to preserve sovereignty and dignity of China.
The sticking issue is on U.S. demand to China to pass a law to provide legal option for foreign companies in China. This is to give assistance when foreign companies are forced to transfer their technology or intellectual property. The Chinese though believes that passing such law at the request of foreign power is violation of its sovereignty. To Trump's team, it's one of the ways to enforce the deal and it won't remove tariffs until they see the laws in place.

Another issue is Trump administration's demand for China to buy goods more than they need. To meet the US $1.2 trillion of additional goods to China over six years, it will require major adjustment in global supply chain.

One of the biggest casualties in this trade war from U.S side is U.S. farmers. China has purposefully targeted the agriculture industry as that's where Trump's supporter base is. Last summer, after the Trump administration announced tariffs on Chinese goods, China lowered its commitment to buy 366,000 metric tons of U.S. soybeans for the 2018. The value of soybeans exported to China from American dropped 75% from $12 billion in 2017 to only $3.1 billion in 2018. The price of a bushel of soybeans dropped more than 20% from $10.50 per bushel to $8.

With the current trade escalation, U.S. farmers are even more vulnerable. Soybean prices hit a 10-year low when markets opened on Monday. China did not levy any new tariff against U.S. soybean, but farmers have suffered since China applied 25% tariff last July. China has also said that it may stop purchasing U.S. agricultural products. With realistically no breakthrough in the near term, the pain may continue for a little longer for U.S farmers. Technical outlook using Elliott Wave for Soybean also suggests that there is still more downside.

Soybean Elliott Wave Sequence Chart


The Daily chart of Soybean above shows an incomplete 7 swing structure from June 10, 2016 high. A 100% area extension from June 2016 high can see Soybean reaching $7 - $7.74 per bushel. With trade war still ongoing with no clear resolution, Soybean can see further extension lower to reach the target area. We understand that at current price, farmers are below the break even price, so at some points supply and demand imbalance will finally cause Soybean to rally.
 

Elliottwave-Forecast

Master Trader
Feb 17, 2017
2,426
9
84
www.elliottwave-forecast.com
In this technical blog, we are going to take a look at the past performance of AUDJPY 1-Hour Elliott wave Charts that we presented to our members. In which, the cycle from 4/29/2019 peak (78.93) took place as impulse Elliott wave structure with right side tags pointing lower calling for more downside. Therefore, our members knew that selling the bounces into the direction of the right side tag remained the preferred path. We will explain the Elliott wave structure & selling opportunity our members took below:

AUDJPY 1 Hour Elliott Wave Chart Showing Selling Opportunity


From 4/29/2019 peak (78.93) the internal structure unfolded as impulse where Minutte wave (i) ended at 77.81 low. Minutte wave (ii) ended at 78.18 high, Minutte wave (iii) ended at 77.19 low and Minutte wave (iv) ended at 77.55 high. Down from there, Minutte wave (v) ended at 76.77 low which also completed Minute wave ((i)). Up from there, the pair corrected higher the cycle from 4/29/2019 peak in Minute wave ((ii)).

The internal of that bounce unfolded as Elliott wave Zigzag structure where Minutte wave (a) ended at 77.58 high. Minutte wave (b) ended at 77.18 low and Minutte wave (c) was expected to reach 78-78.51 100%-161.8% Fibonacci extension blue box inflection area. From where sellers were expected to appear in the pair looking for more downside into the direction of right side tag lower. Or for 3 wave reaction lower at least allowing members to go risk-free in the trade.

AUDJPY 1 Hour Elliott Wave Chart Found Sellers & Turned Lower As Expected


AUDJPY found sellers at 78-78.51 100%-161.8% Fibonacci extension blue box inflection area as highlighted above by ending Minute wave ((ii)) bounce at 78.05 high. And made the reaction lower as expected to allow members to create a risk-free position.

Keep in mind that the market is dynamic and the view could change in the meantime. Success in trading requires proper risk and money management as well as an understanding of Elliott Wave theory, cycle analysis, and correlation. We have developed a very good trading strategy that defines the entry. Stop loss and take profit levels with high accuracy and allows you to take a risk-free position, shortly after taking it by protecting your wallet.
 

Elliottwave-Forecast

Master Trader
Feb 17, 2017
2,426
9
84
www.elliottwave-forecast.com
Ethereum has been following a very nice Elliott Wave structure and has been playing out nicely. The Instrument did a 5 waves advance structure from its all-time lows followed by a pullback in a 7 swings Elliott Wave WXY structure. The Following chart represents the basic structure within the Elliott Wave Theory which is the 5 waves advance followed by 3 waves back or also called an ABC correction.


Sometimes the Market does what we call a WXY structure which is a 7 swings correction or a combination of 2 ABC corrections. The following chart is showing how a WXY structure looks like which is basically the internals unfolding as a 5-3-5-3-5-3-5 sequence.


Now looking at the Monthly chart of Ethereum, we can see the 5 waves advance from its all-time lows in red "I" "II" "III" "IV" "V" which ended blue wave (a) at the all-time high. Below from there, it did a 7 swings pullback lower which we have been labeling as a WXY structure. In most cases, the WXY structure ends at the 100% extension area of W-X. As we can see in the chart below, Ethereum reached the 100% extension area at 97.21 and has been reacting higher since then.

Now the instrument should trade higher ideally into its all-time highs again and by breaking that peak it will open up another extension higher. The target can be then the 100% extension from blue (a)-(b) which comes at around $1600. That would be a fantastic return on investment.


Ethereum Weekly Elliott Wave Analysis 05.15.2019


The next chart shows the Elliott Wave view from its January 2019 lows and it is a very aggressive view based on today's price action. We are labeling the move as wave 3 of wave ((3)) and going with the most aggressive view. It can be bought against the $150 lows.


Ethereum 4-hour Elliott Wave Analysis 05.15.2019


I hope you liked this blog and I wish you all good trades. And for all who are interested in learning more about our unique blue box areas and also want to trade profitably in 2019 then sign up for a free 14 days trial you can cancel anytime. Click the link and see you insight.
 

Elliottwave-Forecast

Master Trader
Feb 17, 2017
2,426
9
84
www.elliottwave-forecast.com
The Yuan (CNY) is the basic unit of the Renminbi which represents the official currency of the People's Republic of China.

The ongoing trade war between China and United States is affecting the economy for both country and the recent tension caused by U.S. Tariffs could be the trigger of more weakness in Yuan.
China’s currency had appreciated 30% against the U.S. dollar fro 20 consecutive year ( from 1994 until 2014 ). However in 2015, the People’s Bank of China (PBOC) surprised the markets with three consecutive devaluations of the yuan CNY to boost exports in support of the economy.
Following PBOC intervention, the US dollar gained 15% over the Yuan but failed to break $7 barrier in the recent 2 years which can have significant effect over market prices.

The technical picture for USDCNY will help us to identify the next path for the Yuan. As the pair has ended the downtrend cycle from 1994 then ideally it's looking for a recovery to correct that decline. Therefore, it's looking at least for a 3 waves move against the previous trend which is represented on the next chart by a proposed corrective Elliott Wave structure "Zigzag".

The initial rally from 2014 was in an impulsive 5 waves structure followed by 3 waves pullback then the pair started a new cycle higher taking 2016 peak but still failing around $6.9 area. The break higher created an incomplete bullish sequence suggesting an 5 waves move higher to a minimum target at $7.16 and ideally it can extend toward the 100% Fibonacci extension $7.4 coming from 2018 low.

Consequently, USDCNY is expected to remain supported above 2018 low at $6.2 and the next step is to take $6.9 peak which will be the key level for short term cycles to allow trades to buy pullbacks in 3 or 7 swings against March 2019 low $6.6.

USDCNY (YUAN) Weekly Chart 5.16.2019
 

Elliottwave-Forecast

Master Trader
Feb 17, 2017
2,426
9
84
www.elliottwave-forecast.com
ICICI Bank Limited is an Indian multinational banking and financial services company headquartered in Mumbai, Maharashtra with its registered office in Vadodara, Gujarat. As of 2018, ICICI Bank is the second largest bank in India in terms of assets and market capitalisation. In this technical blog, we would take a look at the cycle since 2009 low in ICIC Bank and also look at the Elliott Wave Count since 257.41 (July 2018) low and present our forecast going forward.

ICIC Bank Weekly Chart: 2009 Cycle Still Alive
Chart below shows the Weekly chart of ICIC Bank and it covers the rally from 2009 low, rally from 2009 low is overlapping and is corrective in nature and could be best described and labelled as a double three Elliott wave structure. 100 - 123.6% Fibonacci extension area of red w-x cycles would be the natural target area which gives us a target between 479.64 -553.28. Rally from 2016 low (red x) appears to be unfolding as a double zigzag Elliott wave structure , we can see 5 swings up from red x low which means sequence is incomplete and hence we see the current pull back to be corrective and another buying opportunity for a move higher toward 479.64 - 553.28 area.


ICIC Bank Daily Chart Elliott Wave Analysis
Rally from 257.41 could be viewed as a 5-3-5-3-5 leading diagonal structure which completed at 411 on 4/18. Down from there, the decline appears to be impulsive so should just be ending 1st leg of a 3 waves pull back in wave (B). Expectations are for a bounce to fail below 411 peak for another leg lower to complete a zigzag Elliott wave structure in wave (B). We don't like selling and our preferred strategy calls for buyers to appear after 3 waves down in wave (B) to resume the rally for a new high toward 479.64 - 553.28 or a 3 waves bounce at least.


Elliottwave-Forecast

Master Trader
Feb 17, 2017
2,426
9
84
www.elliottwave-forecast.com
EURJPY Technical Analysis May 17/2019

EURJPY can be possibly forming a bearish Gartley pattern. A Gartley pattern is a continuation of trend market pattern. This market pattern must form within a trending cycle and should never be traded if it forms at the beginning of a new trend cycle. The Gartley market pattern needs 5 points to form. Points X, A, B, C and D. The X-A leg is the initial move higher or lower. The A-B leg terminates at the 0.618% Fib. retracement of the X-A leg. The B-C leg terminates inside the 0.382% to 0.886% Fib. retracement of the A-B leg. The C-D leg terminates at the 0.786% Fib. retracement of the X-A leg. The point D 0.786% Fib. retracement level is where the trade entry is triggered. In the EURJPY 1 hour chart below, there is a possible bearish Gartley pattern forming (blue). Price has yet to hit the blue XA 0.786% Fib. retracement level so traders will need to wait to see if the pair makes another push higher in the coming trading sessions. If looking to SELL EURJPY traders should be patient and wait for price to make a minimum move higher to the blue XA 0.786% Fib. retracement level. Waiting for price to move to the minimum XA 0.786% Fib. retracement SELL level will offer a better risk/reward trade setup. Stops should be placed above the point X of the blue bearish pattern. Above the point X invalidates the bearish pattern. As long as price stays below point X watch for EURJPY to make newer lows below point A where targets will be waiting to get hit. If price moves below the blue point C before hitting the 0.786% level then the pattern is invalidated and trade setup should be cancelled. Only time will tell what EURJPY will do but at least now you are aware of the level where the pair can possibly sell off from.

EURJPY 1 Hour Chart 5.17.2019


Of course, like any strategy/technique, there will be times when the strategy/technique fails so proper money/risk management should always be used on every trade. Hope you enjoyed this article.
 

Elliottwave-Forecast

Master Trader
Feb 17, 2017
2,426
9
84
www.elliottwave-forecast.com
U.S. Election 2020: Many Traders always believe the Market moves are driven by fundamental outcomes. We at Elliott Wave Forecast believe that the Market follows a code which is visible and repeats itself in every single time frame.

We operate under the impression that only a few market makers make the Market. It is obvious that the so-called Market Makers cannot show and tell us the next big move in the market. Otherwise, every trader in the World will be a winner. Therefore, we need to keep a balance and there has to be Winners and Losers in the market.

We cover the code in our Live Session every day and make the case why sometimes it is hard to see the next path based on the timing. However, what we have been doing over the years is providing our members with opportunities before a big fundamental event takes place. That is our so-called blue boxes which you see in various charts from us.

That is an area where a big move should take place regardless of the fundamental outcome. The dream of every trader is anticipating the next big move. But it is hard using Fundamentals for that because they are not part of the Market Code which comes at 5-9-13 or 3-7-11. Let's have a look at a real example which we provided for our clients in the past.

Back in 2016, Brexit was a huge event and every single Forex traders were trying to guess the next big move following news and even the polls.

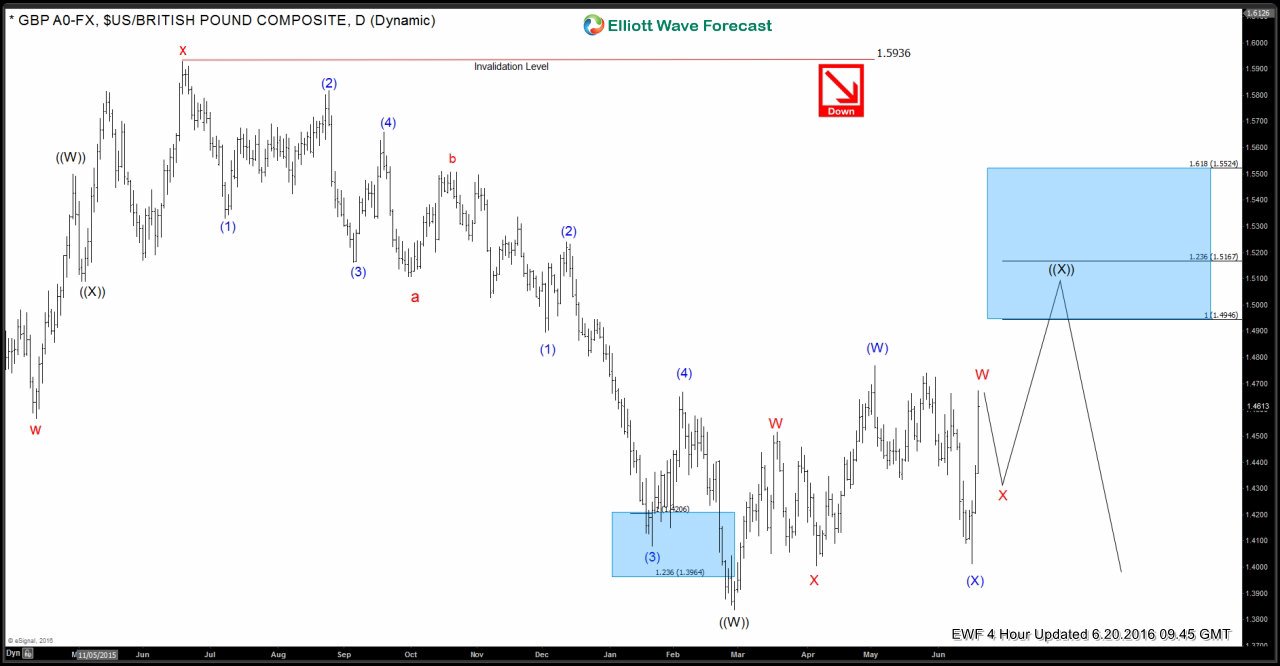
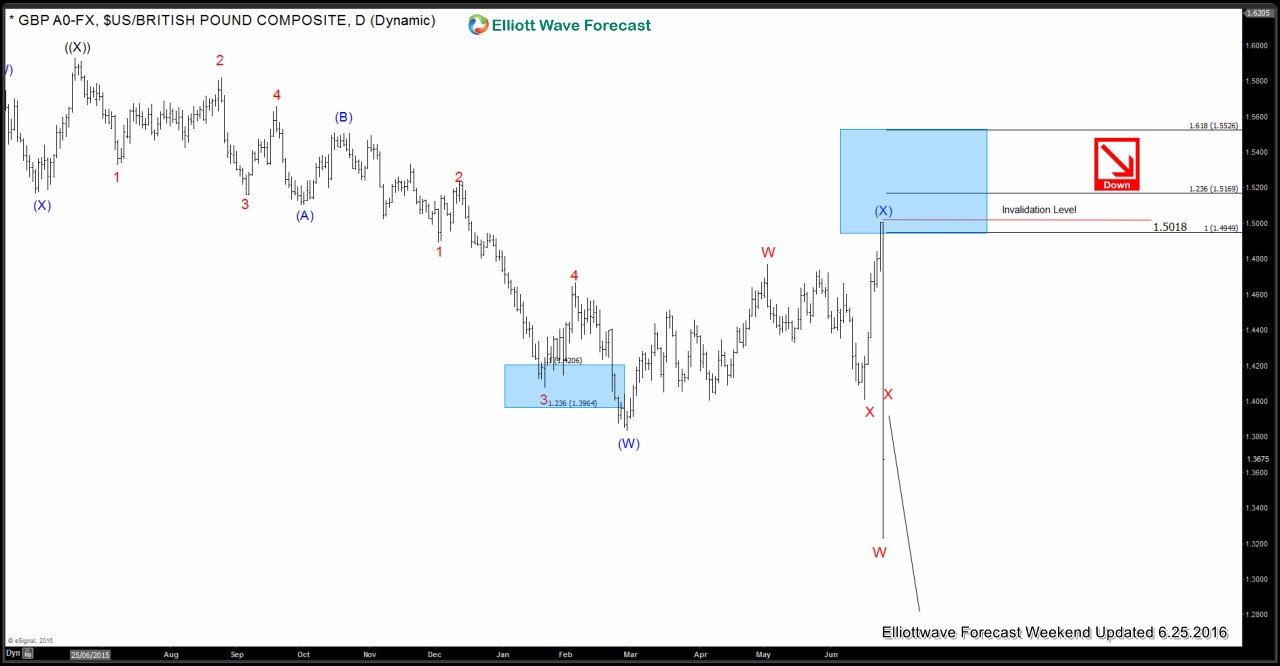
However, we knew the area because the code and price action was very clear. Market Makers hide their big moves in such important events. So retails traders believe that the move was created by the event. The following chart shows the GBPUSD before the Brexit result and our Blue Box area where we said the GBPUSD should ideally sell off and that was the area to enter the market for a short side.


GBPUSD Elliott Wave Analysis before Brexit event


The following chart shows the big reaction from the Blue Box in a very technical way regardless of the BREXIT outcome. We didn't know the results ahead of the World, we only knew the area where it should be selling off.


GBPUSD Elliott Wave Analysis after Brexit event


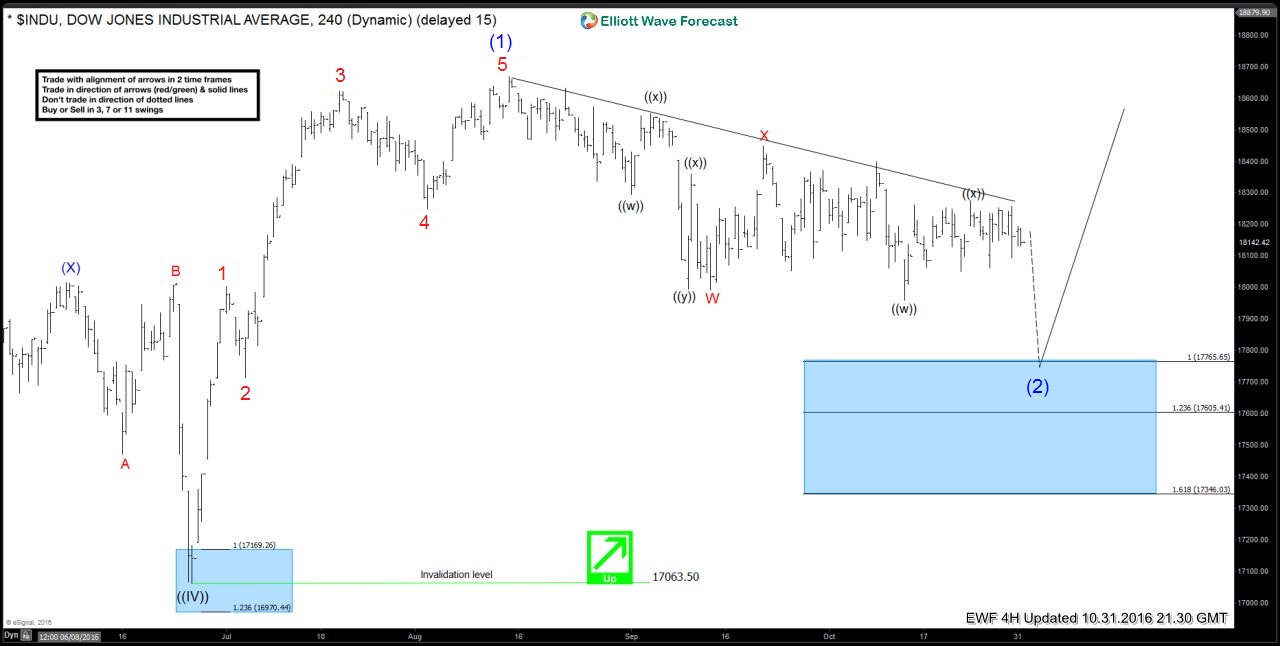
Another example was the 2016 U.S. Election. The Following chart is the Dow Jones Industrial Average before the 2016 U.S. Election.

Many across the world were calling that if Trump wins the election the Index will sell off and if Hillary wins the Index will accelerate to the upside. In the end, neither scenario happened and the Index started rallying from our Blue Box with a Trump win. We knew that the trend is higher, and the sequences were incomplete.


Dow Jones Industrial Average Elliott Wave Analysis before U.S. Election result


Now, obviously, people can say that was pure luck. Reality is that we provided the blue boxes to members before the actual event took place. And most of the big events come inline with a blue box. These are just one of many examples which we presented in the past.

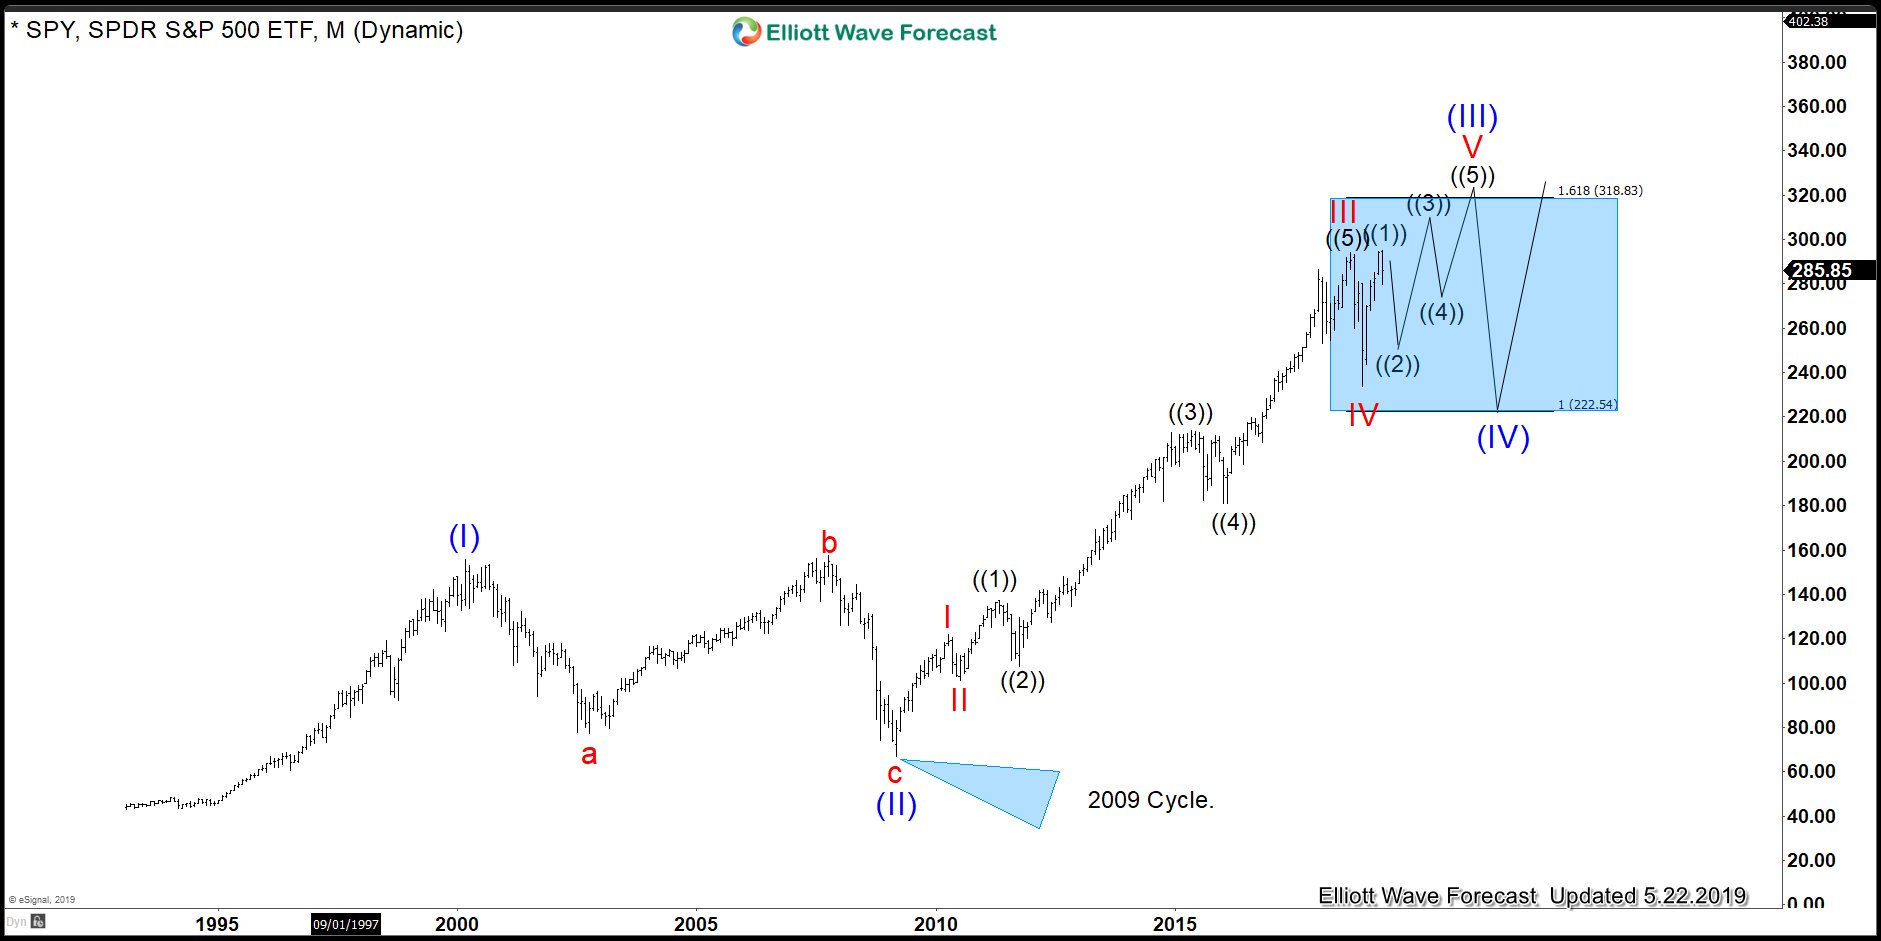
But let's get back to 2020 US Elections, this will be again a huge event which can create a Constitutional crisis in the U.S.! Due to the political environment which can be seen today and how both sides are fighting and accusing each other’s into levels never seen before. The idea is that the Grand Supercycle in the SPY ETF is getting closer to the 320.00 level which is the 1.618% extension from its all-time low and the top of the Blue Box. The following chart is showing the Blue Box and the Elliott Wave count.


SPY Elliott Wave Analysis 5.22.2019


Many Market participants are calling for the rally to extend into another 3 waves higher from 12.26.2018 but measuring the cycles and seasons, it is easy to see that U.S. Election in 2020 can create a multi-year consolidation or pullback in World Indices and the big Market Makers can be waiting for that area inline ending its 5 Elliott Wave structure from 2009 low by 2020 timing wise.

The Following chart above represents the Grand Supercycle in SPY and the levels which have been mentioning. We believe World Indices are not really close to a crash but thinking ahead, a wave (IV) can happen from the 2020 US Election results and not a very peaceful transition of power. Our member will know, how the Market will react when the time comes. But one thing they know now is to trade based on the technical aspect and follow the sequences of 3-7-11 or 5-9-11 which is nothing more than the Market Nature. They do understand a few groups of companies are bumping money into the Market every mini-second and making the Market.
 

Elliottwave-Forecast

Master Trader
Feb 17, 2017
2,426
9
84
www.elliottwave-forecast.com
In a speech to the Economic Society of Australia today, Reserve Bank of Australia (RBA) governor Phillip Lowe gave the strongest indication that the bank will cut cash rate in the next meeting. Dr. Lowe said that without interest rate cut, unemployment is not likely to fall much further and inflation remains low. The Australian Dollar immediately dropped below US69¢. The ASX200 also moved into positive territory on hopes rate cuts would support the domestic economy. The RBA last cut the interest rate in August 2016 to 1.5%. This is already the lowest level since 1959.


The easing confirmation followed the release of the May board meeting minutes. In the minutes, board members also explicitly acknowledged the likelihood of a cut if the labor market did not improve. The minutes said "Members discussed the scenario where inflation did not move any higher and unemployment trended up, recognizing that in those circumstances a decrease in the cash rate would likely be appropriate." Recent data in April however shows a worse-than-expected 5.2% unemployment rate, bolstering the case for cutting cash rate.


AUDJPY Weekly Chart Bearish Sequence


Weekly chart above shows a 5 swing sequence from April 11, 2013 high, favoring further downside. A 5 swing sequence is part of a 7 swing WXY structure. In Elliott Wave Theory, this structure is called a double three. Swing #5 can be complete already at 80.72 on April 17, 2019 high. Pair however still needs to break below swing #5 on January 3, 2019 low (70.66) to confirm the next leg lower has started. Pair has a 100% extension target towards 49.4 - 57.2 and likely continue to weaken with RBA signalling lower rates going forward. In addition, if Indices start to turn lower due to a risk off sentiment, then it can also drag the Yen pairs lower. Alternatively, pair still can do a double correction in swing #6 before it turns lower and continue swing #7. As far as pivot at 90.5 high stays intact, expect the pair to eventually resume lower.

AUDJPY 1 Hour Elliott Wave Chart


Short Term $AUDJPY Elliott Wave chart above calls the rally to 76.39 as wave 2. This suggests that near term, as far as bounce stays below there, pair should extend lower. Pair still needs to break the previous low at 75.3 on May 17 to confirm that the next leg lower has resumed and avoid a double correction. Until then, technically we still can not rule out a double correction in wave 2 before the decline resumes.

Please keep in mind that market is dynamic, and the view may have changed since the time of the writing.
 

Elliottwave-Forecast

Master Trader
Feb 17, 2017
2,426
9
84
www.elliottwave-forecast.com
President Donald Trump threatened on Thursday to impose new tariffs on Mexico if the country does not step up its immigration enforcement actions, combining his boiling border-related frustrations with his preferred method of punishing foreign countries.

Trump said in a White House statement that the first round of tariffs would begin on June 10 at 5% "on all goods imported from Mexico." (source CNN)

This resulted in a sell off in the World Indices starting in the Asian session on Friday. Was the drop really due to this announcement or was the market already technically positioned to drop and this news just acted a catalyst for the drop? Let's take a look at some charts below to see why we think the drop was purely technical and happened from the blue boxes presented on our charts to members.v

ES_F 30 May 1 Hour Elliott Wave Chart (Before New Tariffs on Mexico announced)
Chart below was published at 10:15 GMT on 30th May well before President Trump announced new 5% Tariff on Mexico, the chart showed the red Right side tag which suggested the right side was lower and decline was expected to resume after corrective bounce ended. Shaded blue box area showed the area for the corrective bounce to end and then decline to resume to new lows or a 3 waves reaction lower at least to take place from the blue box.


E-mini S&P 500 futures reached the blue box and reacted lower but didn't break the lows. Then, we got the news of new Tariffs on Mexico which acted as a catalyst for a new wave of selling to new lows. Let's take a look at the chart below

ES_F 31 May 1 Hour Elliott Wave Chart (After New Tariffs on Mexico announced)


Nasdaq Futures 30 May 1 Hour Elliott Wave Chart (Before New Tariffs on Mexico announced)
Chart below was published at 10:15 GMT on 30th May well before President Trump announced new 5% Tariff on Mexico, the chart showed the red Right side tag which suggested the right side was lower and decline was expected to resume after corrective bounce ended. Shaded blue box area showed the area for the corrective bounce to end and then decline to resume to new lows or a 3 waves reaction lower at least to take place from the blue box.


Nasdaq Futures 30 May 1 Hour Elliott Wave Chart (After New Tariffs on Mexico announced)


This is yet another proof that markets are very technical and news just acts as a catalyst. We always advise our members to cut the noise and follow the Technicals and we aim to provide an edge to our members through Right Side tags and blue box areas to help identify the right side of the market and entry / profit taking areas. Also, by not trading against the right side tags or trading the turning arrows, members can avoid being on the wrong side of the market.
 

Elliottwave-Forecast

Master Trader
Feb 17, 2017
2,426
9
84
www.elliottwave-forecast.com
In today's blog, we will have a look at the latest price action of the Pivotal Software stock. The stock is trading at the New York Stock Exchange.

Pivotal Software Inc. is an American company which is based in San Francisco. It is a software solution company with several other offices and divisions. They are specialized in developing software solution for customers and also provide cloud-based applications platform services in the United States. It was founded in April 2013.

The company released last week its earning and plunged over 30%. In the peak, it is down almost 45%. Consequently, the company lost almost half its market value in one day. It is the worst day since the IPO. A very black day for the company. In comparison, the SP-500 was almost 1% up on that day.

However, with every drop, there can arise also an opportunity. Let's have a look at the Elliott Wave structure.


Pivotal Software Daily Elliott Wave view 06.09.2019


In the chart above, you can see the daily chart of Pivotal Siftware Inc. The stock ended the cycle from its Zero line at 6/14/2018 peak ($31.36). Below from there, it has been correcting that cycle in the sequences of 3-7 or 11 swings. With the recent gap down it opened up an incomplete sequence to the downside from 6/14/2018 peak towards the equal legs of $7.97-3.99 areas (blue box). The current pullback in blue wave (x) is proposed to unfold as an Elliott Wave ZigZag Structure. Which ended red wave a at $14.47 low and wave b bounce at $24.68. Below there it made a new low indicating more downside in wave c.

The c leg lower has been now unfolding as a 5 waves Elliott Wave impulse. Which could still be in black wave ((3)). Before a bounce in wave ((4)) can be seen followed by another push lower into the blue box area (7.97-3.99). From that area, we should get a bigger reaction higher in 3 waves at least which should help the company again to rise in value. That area can be used for a long-term to buy based on the Elliott Wave hedging principle.

I hope you liked this blog and I wish you all good trades.
 

Elliottwave-Forecast

Master Trader
Feb 17, 2017
2,426
9
84
www.elliottwave-forecast.com
In this blog, we revisit Turkish Lira Elliott wave analysis presented back in August 2018 and present the latest USDTRY Elliott Wave Analysis. We were looking for a bounce to fail below August 2018 peak for another leg lower to complete a larger 3 waves correction down from August 2018 peak before buyers entered the market again.

Let's take a look at USDTRY Daily chart below to see how price action unfolded since August 2018

USDTRY Elliott Wave Analysis - Daily Time Frame
We can see the bounce failed below August 2018 peak as expected and price turned lower again. It reached blue box which was 100 - 123.6 extension area of black ((A)) - ((B)) where buyers appeared as expected and produced a bounce. The bounce appears to be in 5 swings as we will show in the 4 Hour chart below.


USDTRY Elliott Wave Analysis - 480 Minute Time Frame
Preferred view suggests that cycle from 11/29/2018 low (5.129) ended at 5/9/2019 (6.199). This move can be counted in 11 swings and hence appears to be a diagonal structure. We have labelled this as wave (( 1)) and now expected a wave (( 2 )) pull back in 3, 7 or 11 swings. Pair is already showing 3 waves down from the peak and as far as it stay above 5.67306 level, expect a 3 waves bounce in wave (X) to correct the decline from 5/9/2019 peak before another 3 swings lower are seen to complete wave (( 2)) pull back as a double three Elliott Wave structure. A break below 5.67306 would suggest decline from 5/9/2019 peak could take the form of an impulse in the first leg when pair would still need a 4,5 to complete the 1st leg as an impulse i.e. wave (A) before we get a bounce in wave (B) and lower again to complete wave (( 2 )) pull back as Zigzag Elliott Wave Structure. We don't like selling and consider the buying after 7 swings lower in wave (( 2)) to be a safer strategy.


In the end, we will revisit the Weekly chart and present an alternate path in the weekly time frame.

USDTRY Weekly Elliott Wave Analysis


USDTRY Weekly Elliott Wave Analysis - Alternate view
 

Elliottwave-Forecast

Master Trader
Feb 17, 2017
2,426
9
84
www.elliottwave-forecast.com
Microsoft: More Upside within the Super Cycle Degree
Microsoft (MSFT) has been in a tremendous rally since the lows at 2009. Without a question, the stock is developing into a nice 5 waves advance. The Elliott Wave Theory's main pattern is an advance in 5 waves with the trend and a 3 waves pullback against the trend. In an impulse, as a guideline, wave (III) typically has an extension relative to wave (I). In this case, we have more than enough extension as the stock has passed the 1.618% fibonacci extension at 112.51 area. The following chart is showing the Monthly chart of $MSFT


As the chart above shows, MSFT has already shown 5 waves from the lows at 2009. This low is also the same low across the World Indices. We believe the stock will extend higher within wave V, as far as the lows on December 2018 remains in place. The move higher will also end Super Cycle degree wave (I) and start the biggest correction. The move is very technical and cycles are very well defined. A great opportunity into a multi month buy will come sometimes by the end of the Summer.

Similar to many World Indices, we are looking at important peak sometimes at the end of year 2020. However, like we mentioned before , as far as the last significant low on December 2018 holds, buying in 3-7-11 should be the right side. We want to highlight and acknowledge that the stock has already shown 5 waves since 2009, so technically it can also end and do bigger pullback. However, based on correlation with other stocks such as $BABA and $TESLA, we are calling extension within the wave V.
 

Elliottwave-Forecast

Master Trader
Feb 17, 2017
2,426
9
84
www.elliottwave-forecast.com
The BEL20 Index is correcting the cycle up from the 2009 lows.

Firstly the BEL20 Index has trended higher with other world indices since the benchmark was established. The index remained in a long term bullish trend cycle into the May 2007 highs. From there it made a sharp correction lower that lasted until March 2009 similar to other world indices. That is where the index corrected the whole long term bullish cycle from the all time lows. At this point is where this bullish trend, cycle and swing analysis begins. The analysis continues below the monthly chart.

BEL20 Monthly Chart


Secondly, the 2009 lows corrected the whole longer term cycle higher from inception in the benchmark index. The bounce from the March 2009 lows into the January 2018 highs was a clear five swing impulse. The pullback lower from that high is strong enough to suggest it is correcting the whole cycle up from the March 2009 lows. This is determined by reading the RSI and other momentum indicators.

Thirdly, previously mentioned earlier, the pullback from the January 2018 high to the December 2018 lows was strong enough to suggest it is correcting the cycle up from the March 2009 lows.At this point the index could have possibly completed a corrective sequence against the uptrend however some related instruments suggest an otherwise deeper pullback. This pullback Fibonacci extension area shown on the chart is measured by the following. Take the Fibonacci extension tool on a charting platform and use January 2018 high as point one. Go down from there to the low of December 2018 as point two. From there make the point three at the April 2019 highs which gives the Fibonacci extension target area shown.

In conclusion, this double three correction is a typical and common Elliott Wave corrective structure. Previously mentioned earlier, this is correcting the cycle from the 2009 low. At this point in time the preferred view is while bounces fail below the April 2019 highs the index can see some further weakness toward the shown extension area. Afterward it can resume the longer term bullish trend.

Thanks for looking and feel free to come visit our website.

Lewis Jones of the ElliottWave-Forecast