Hello fellow traders. In today's blog, we will have a look at Boeing and the recent price action. The Boeing Stock peaked in March,1,2019 and since then have been trading lower in a series of lower lows and lower highs. The following chart is illustrating the view:
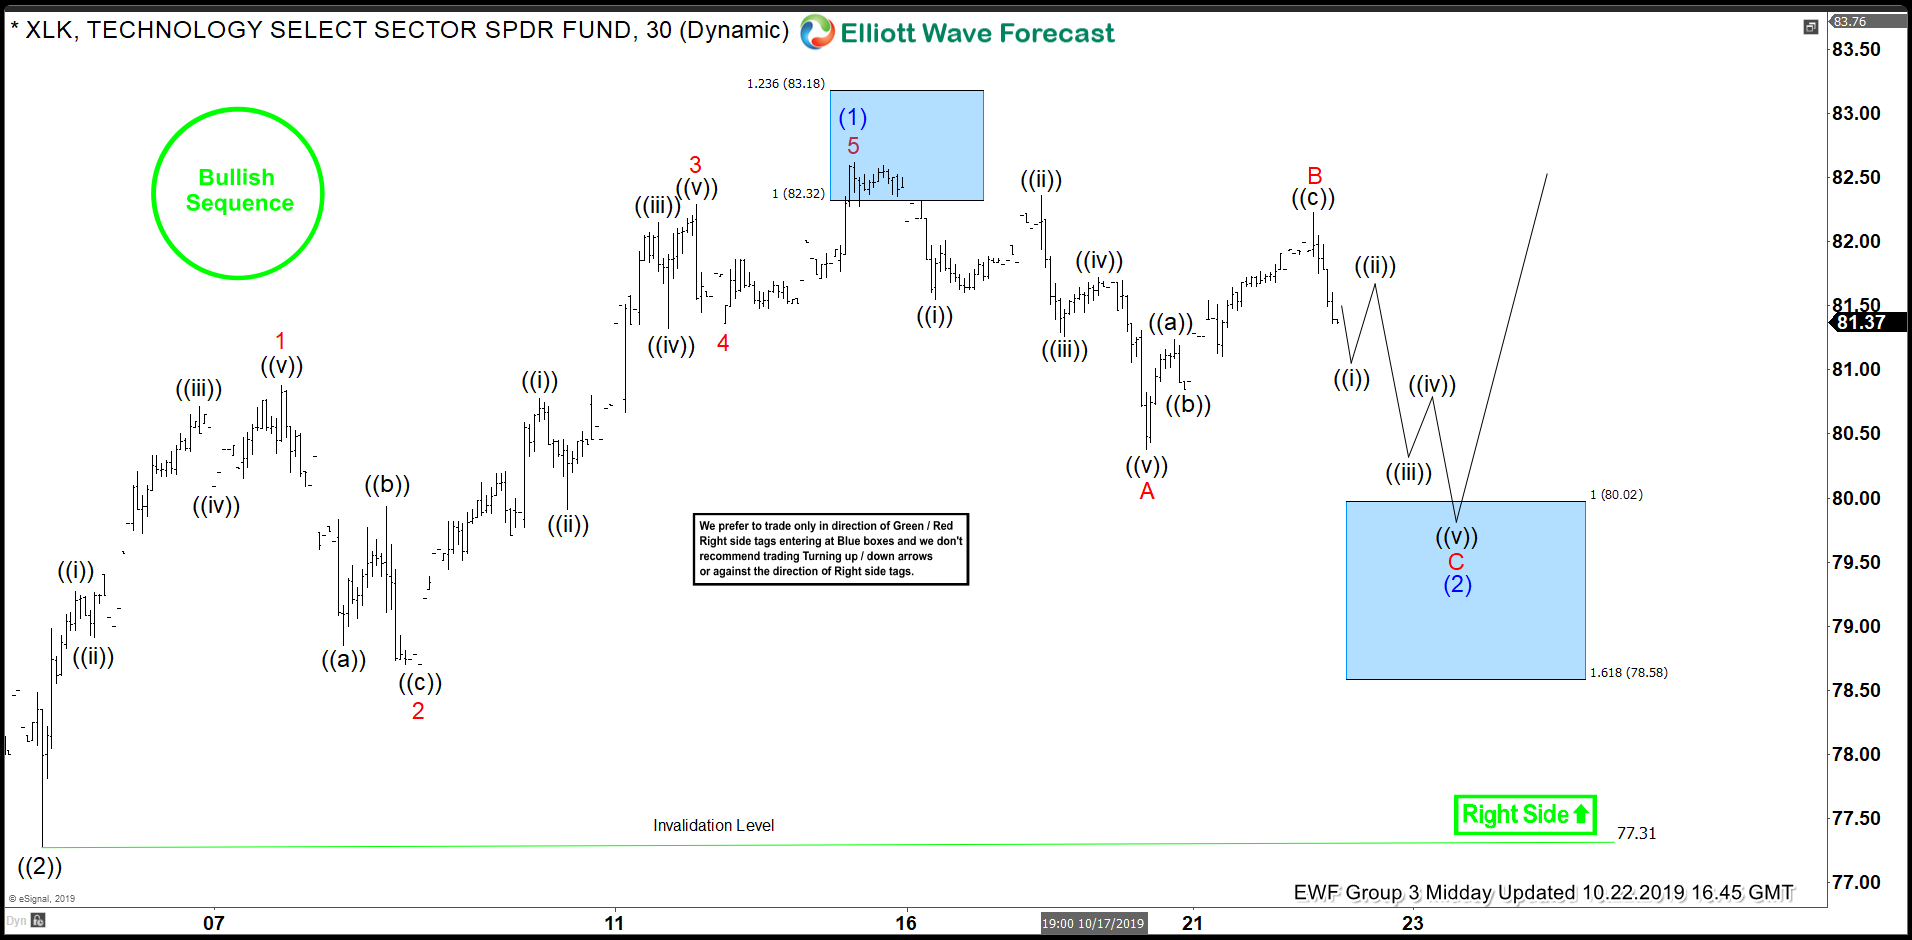
Boeing 4 Hour Elliott Wave Analysis 10.21.2019

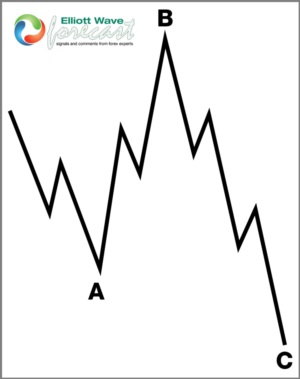
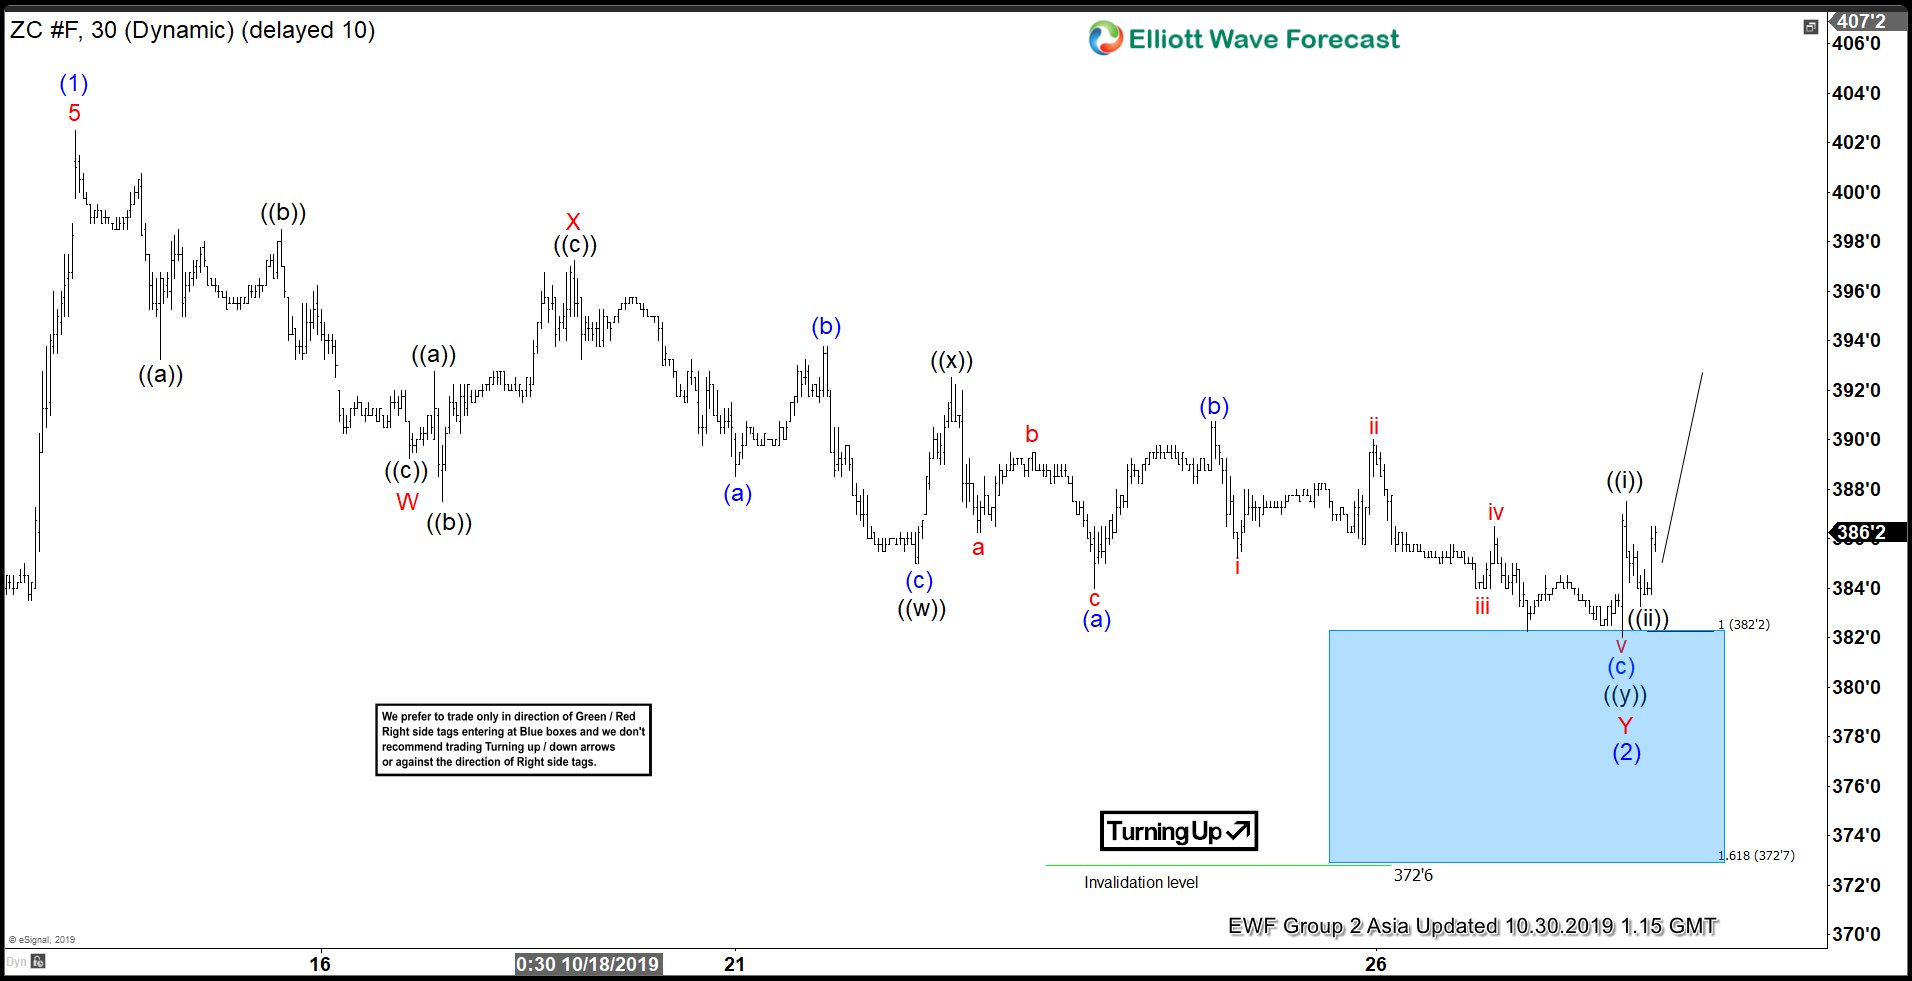
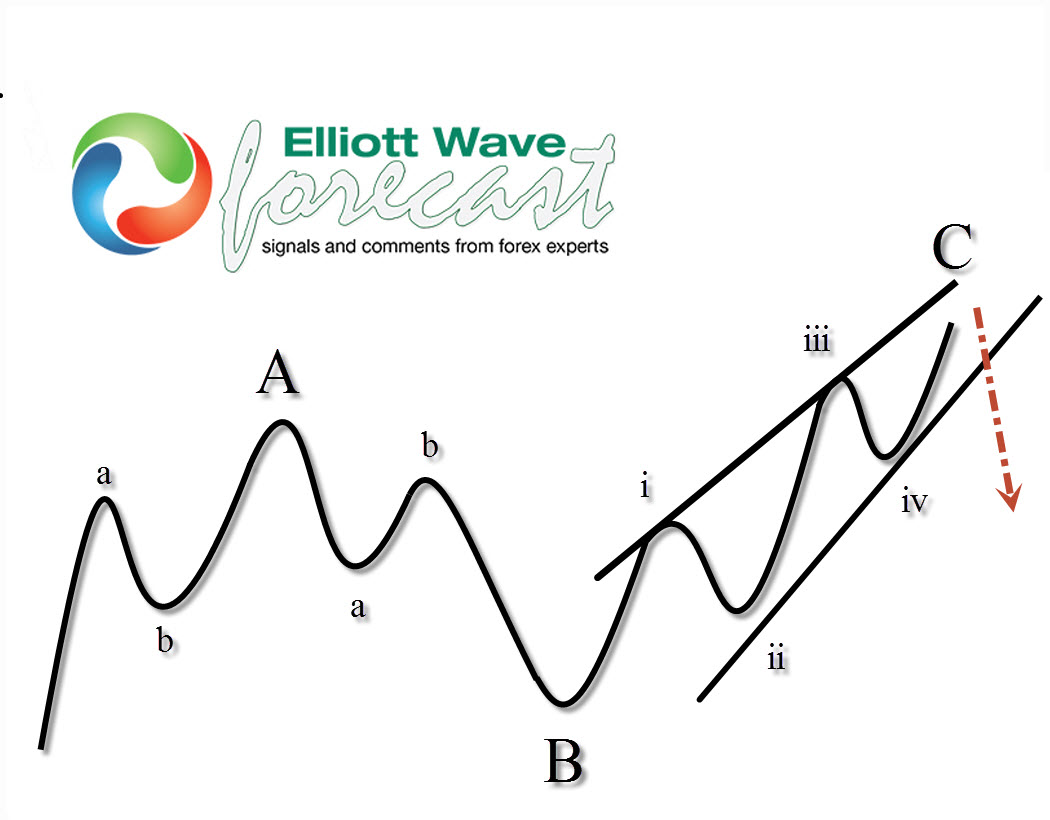
The Instrument is showing a 5 swing sequence from 3.1.2019 peak into the lows to 8.15.2019. We Elliott Wave Forecast understand the Market Nature and we knew that a flat which is an Elliott Wave structure which allows a wave (B) below the beginning of the previous low and a new high above the previous peak as we showing in the following chart.

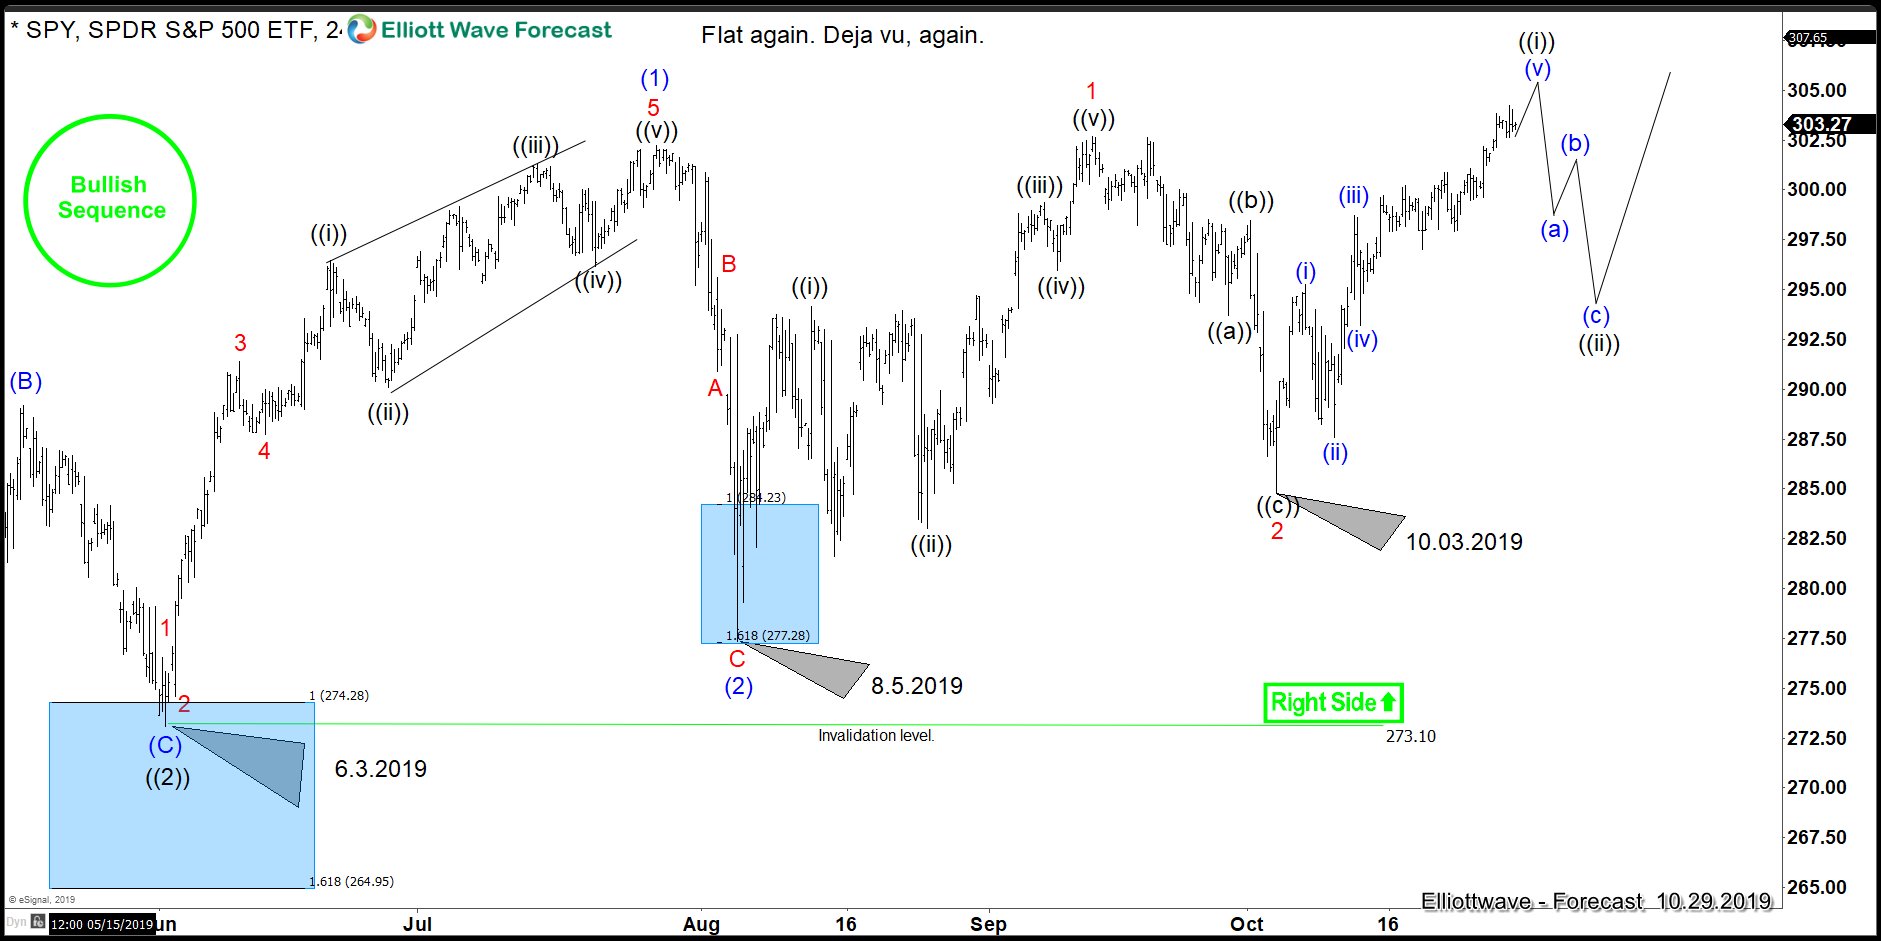
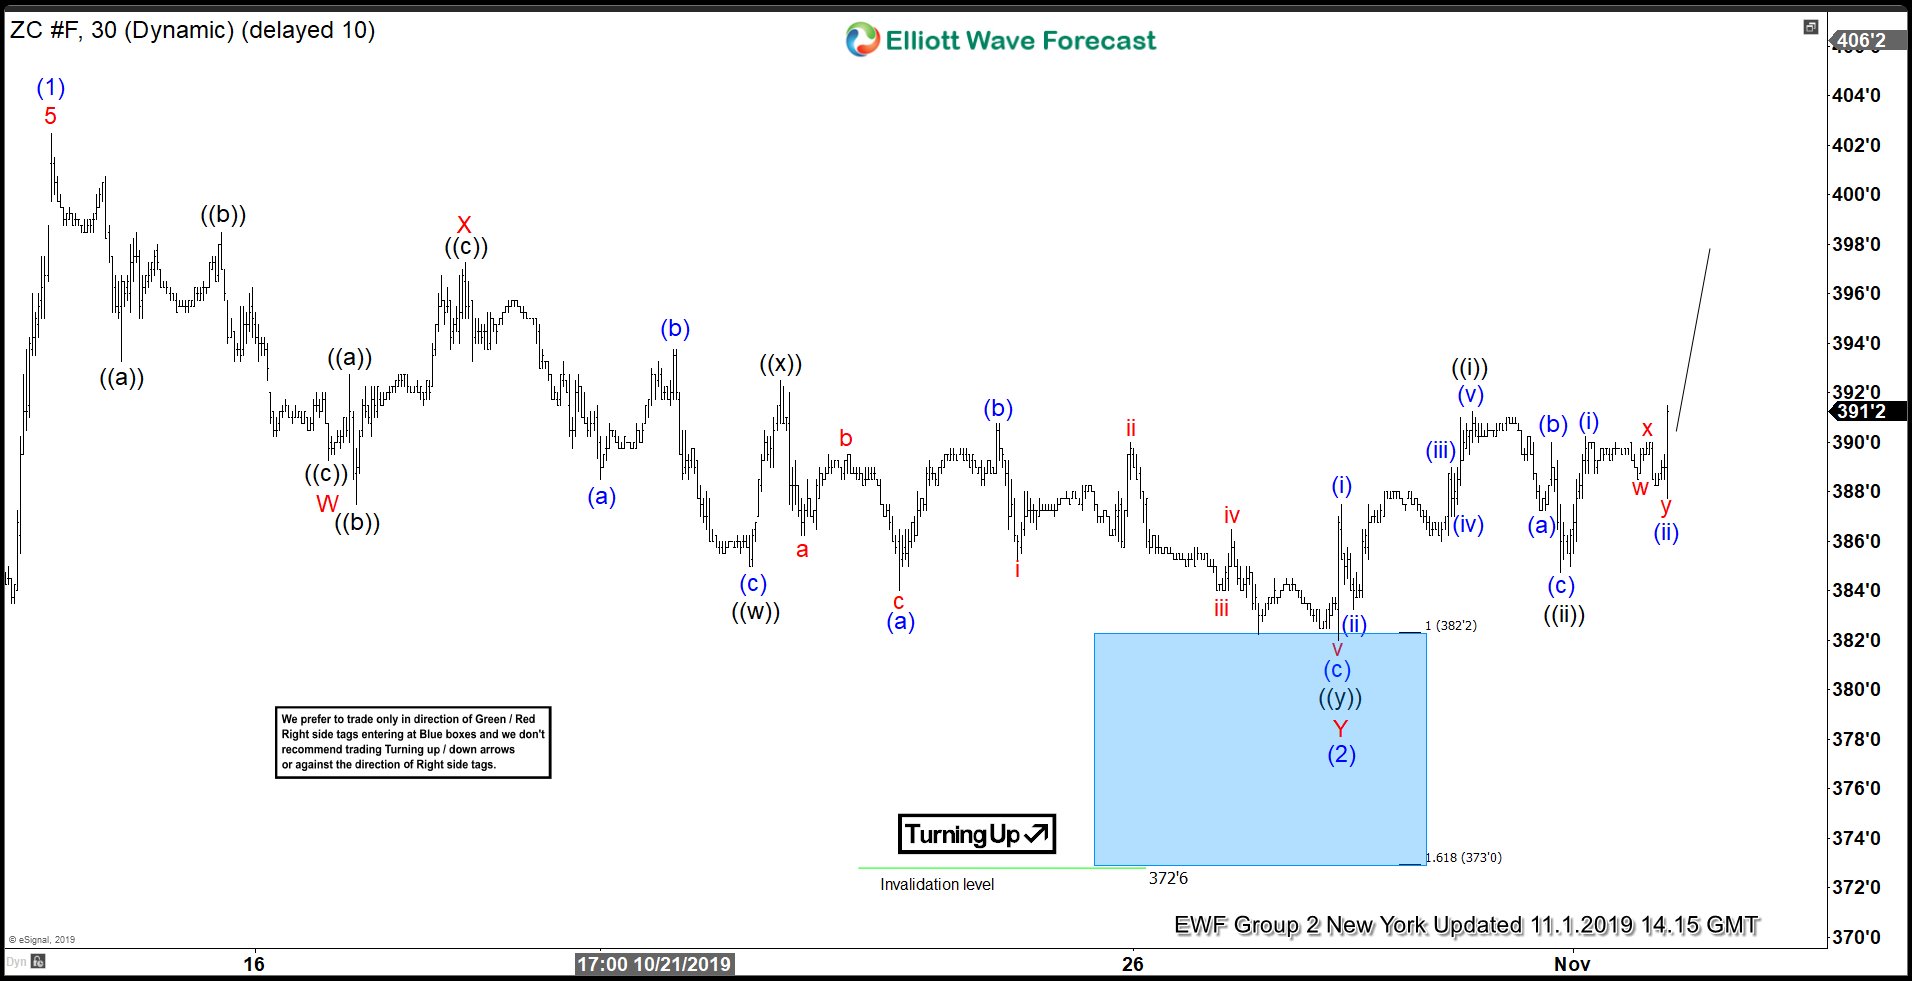
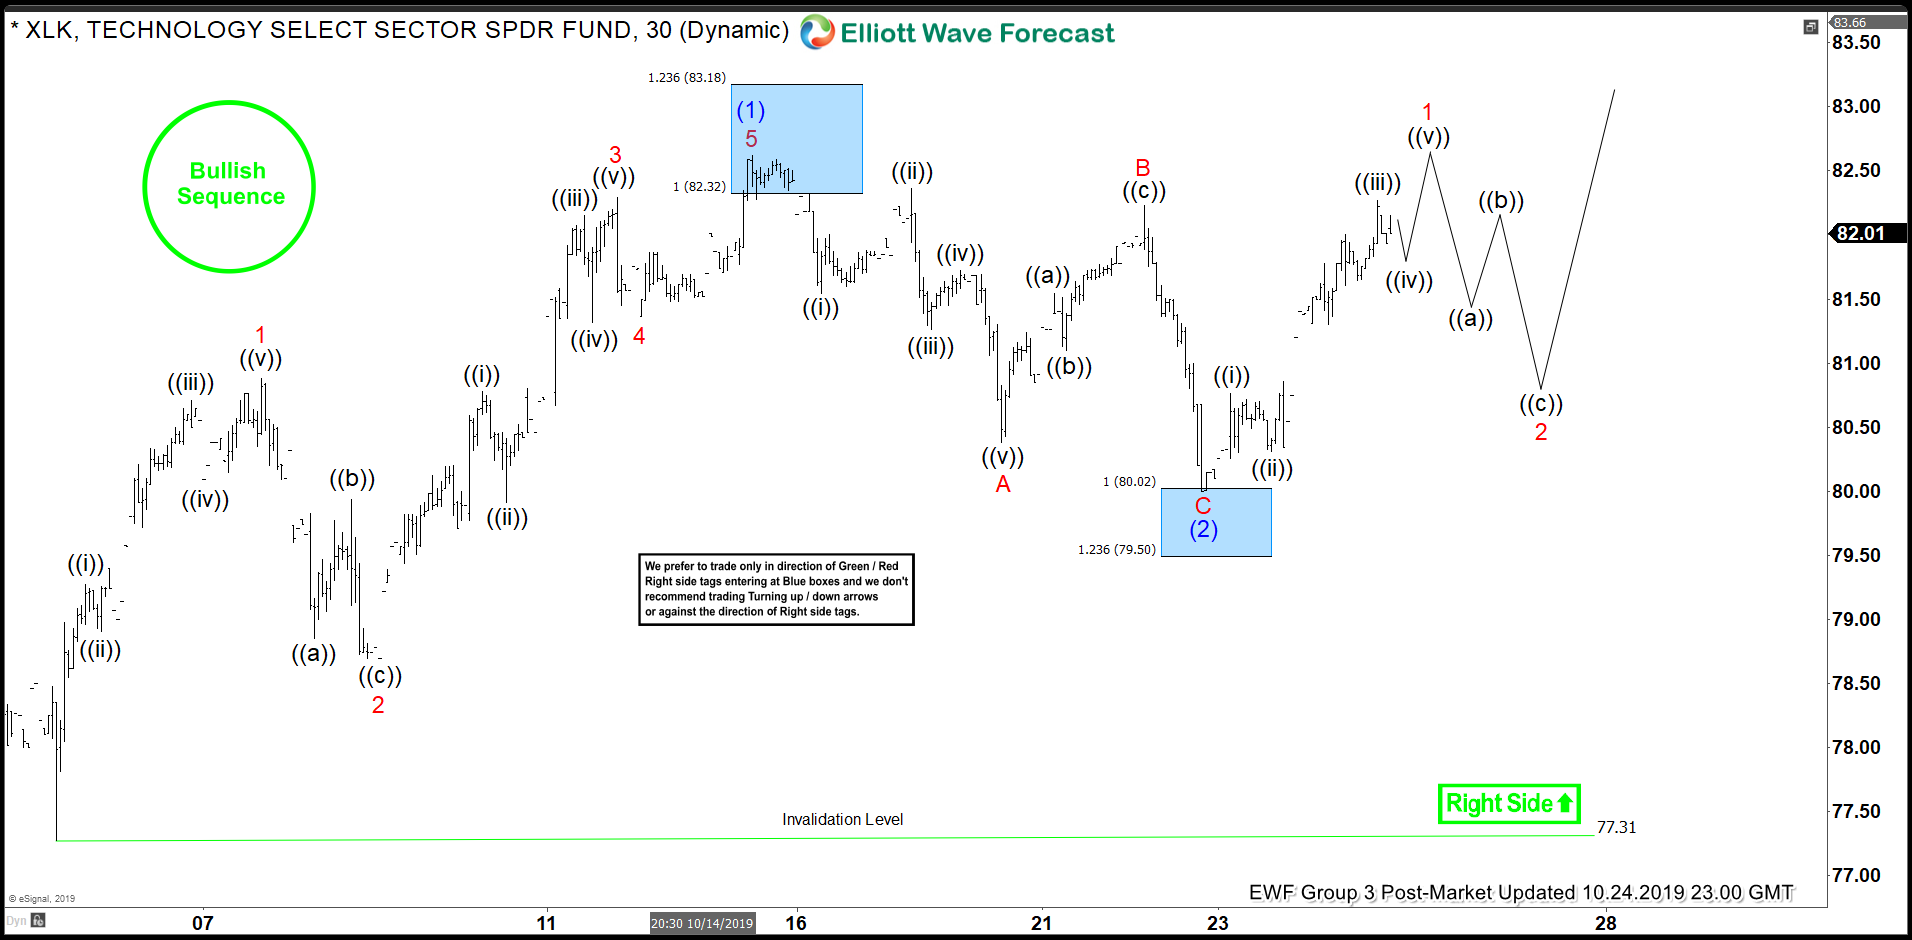
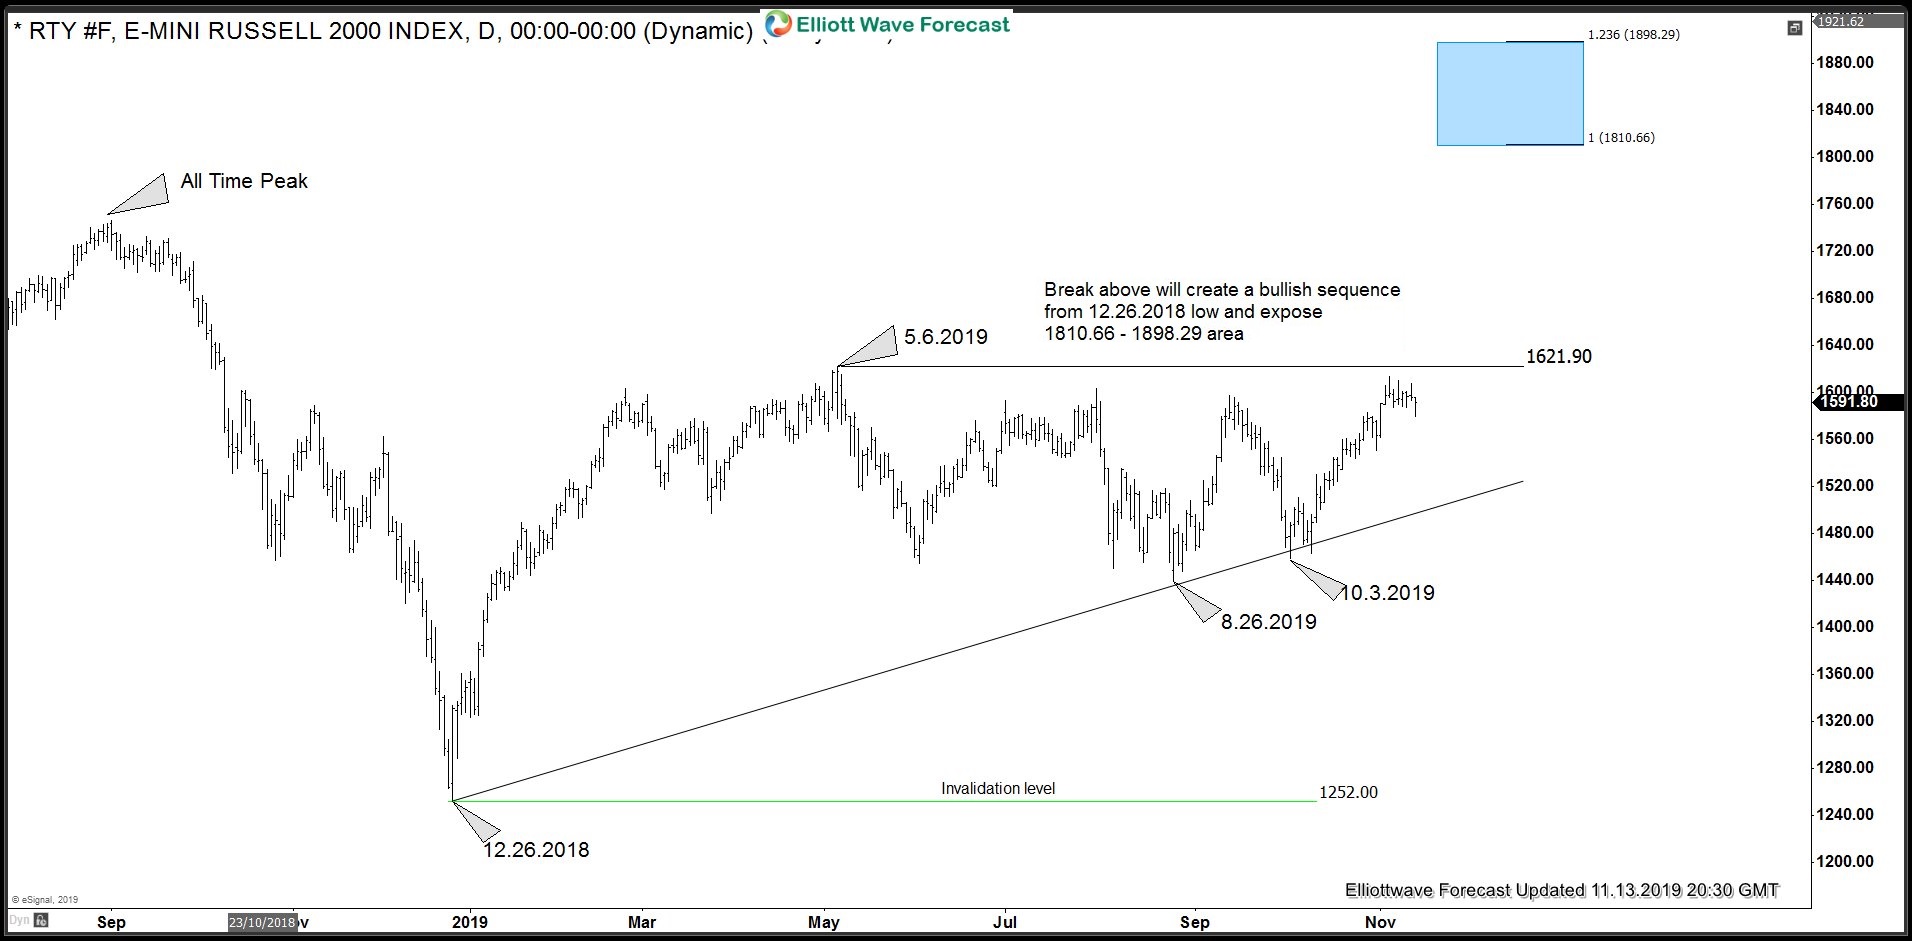
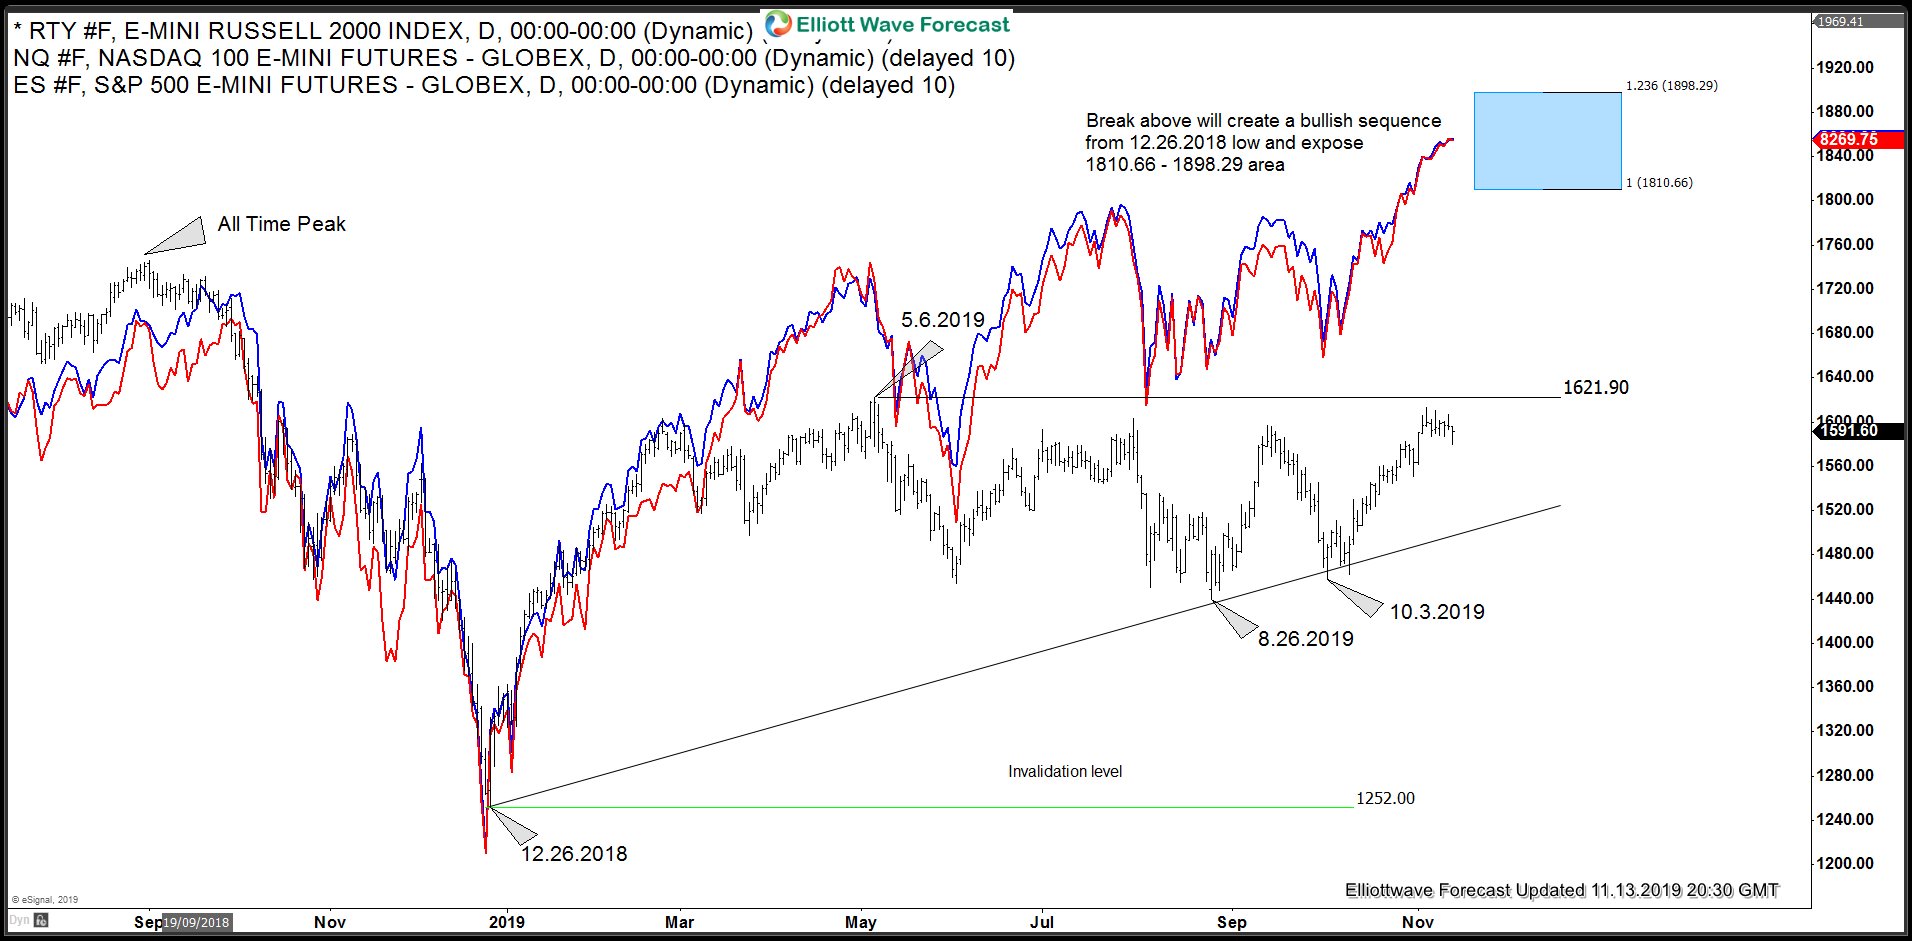
Boeing ended the Flat structure and has renewed now the move lower. We believe the instrument will trade lower into the $275.00 area and until then the World Indices will be sideways or lower using what we call second dimension correlation in which instrument agree in swing direction, but not agree on the overall direction. We understand that reaching the $275.00 target will make world indices bullish in 4 hours. The reaction higher from the Blue Box will make others to rally and Indices like $SPY, $SPX, $INDU among others will be making all-time highs.
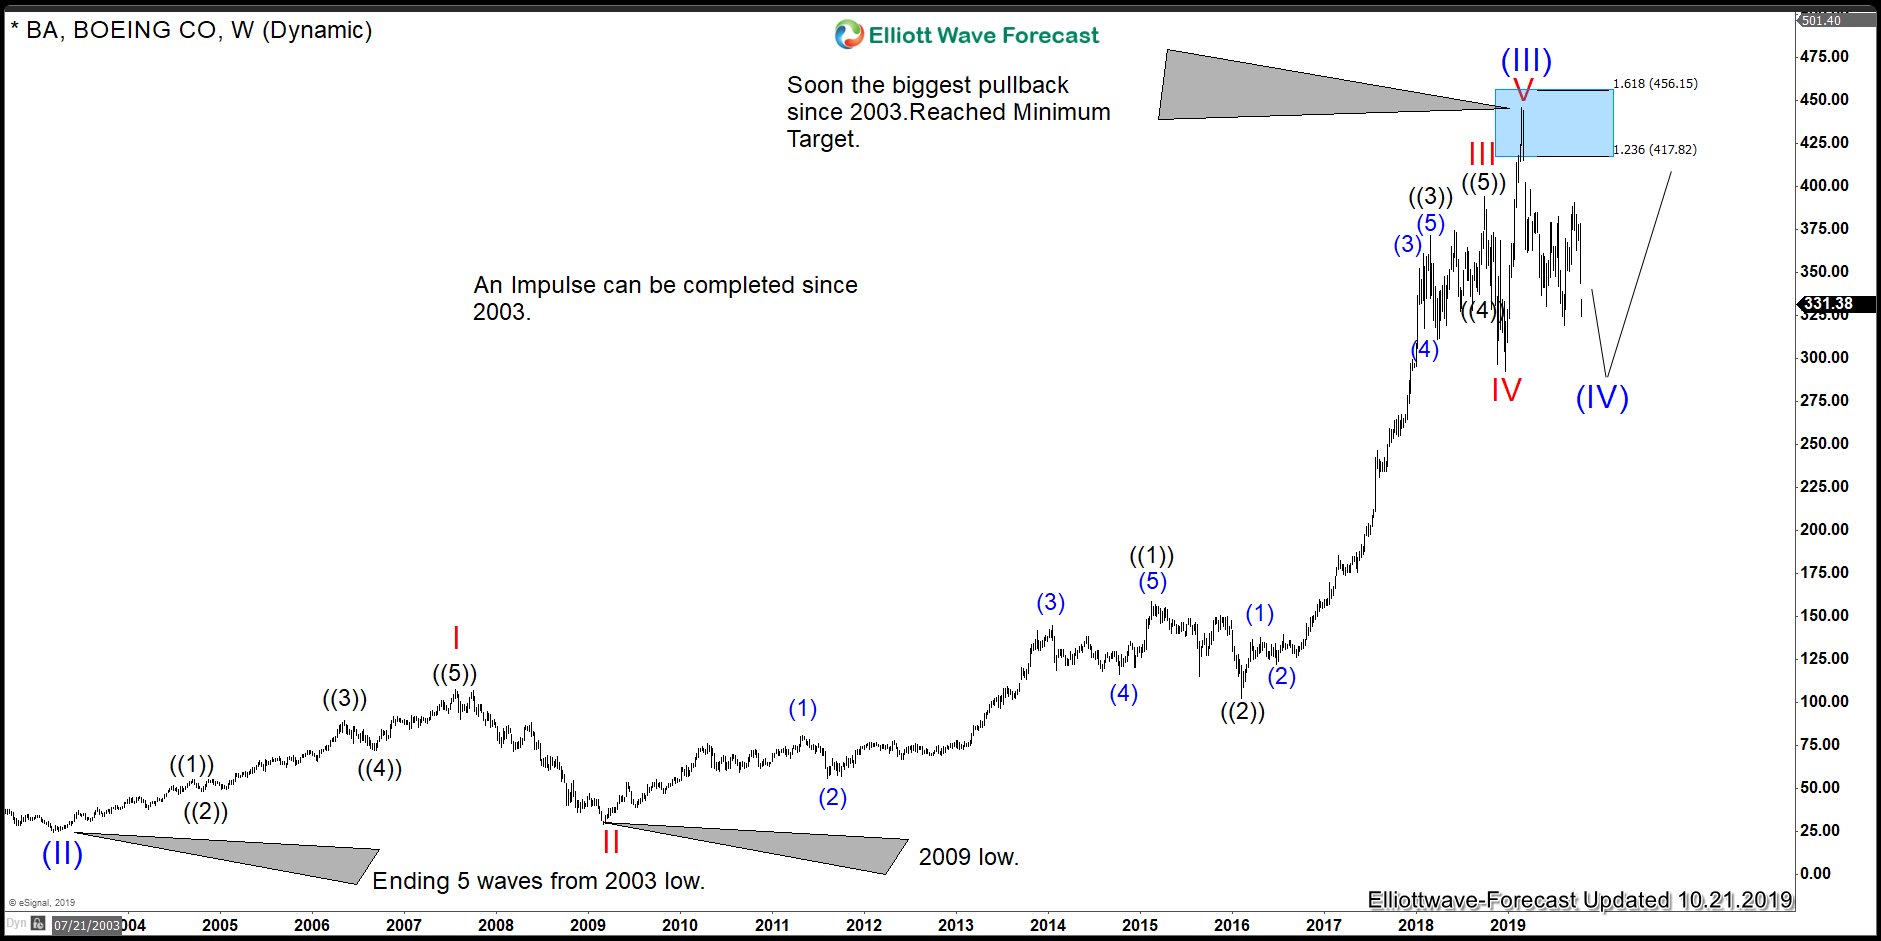
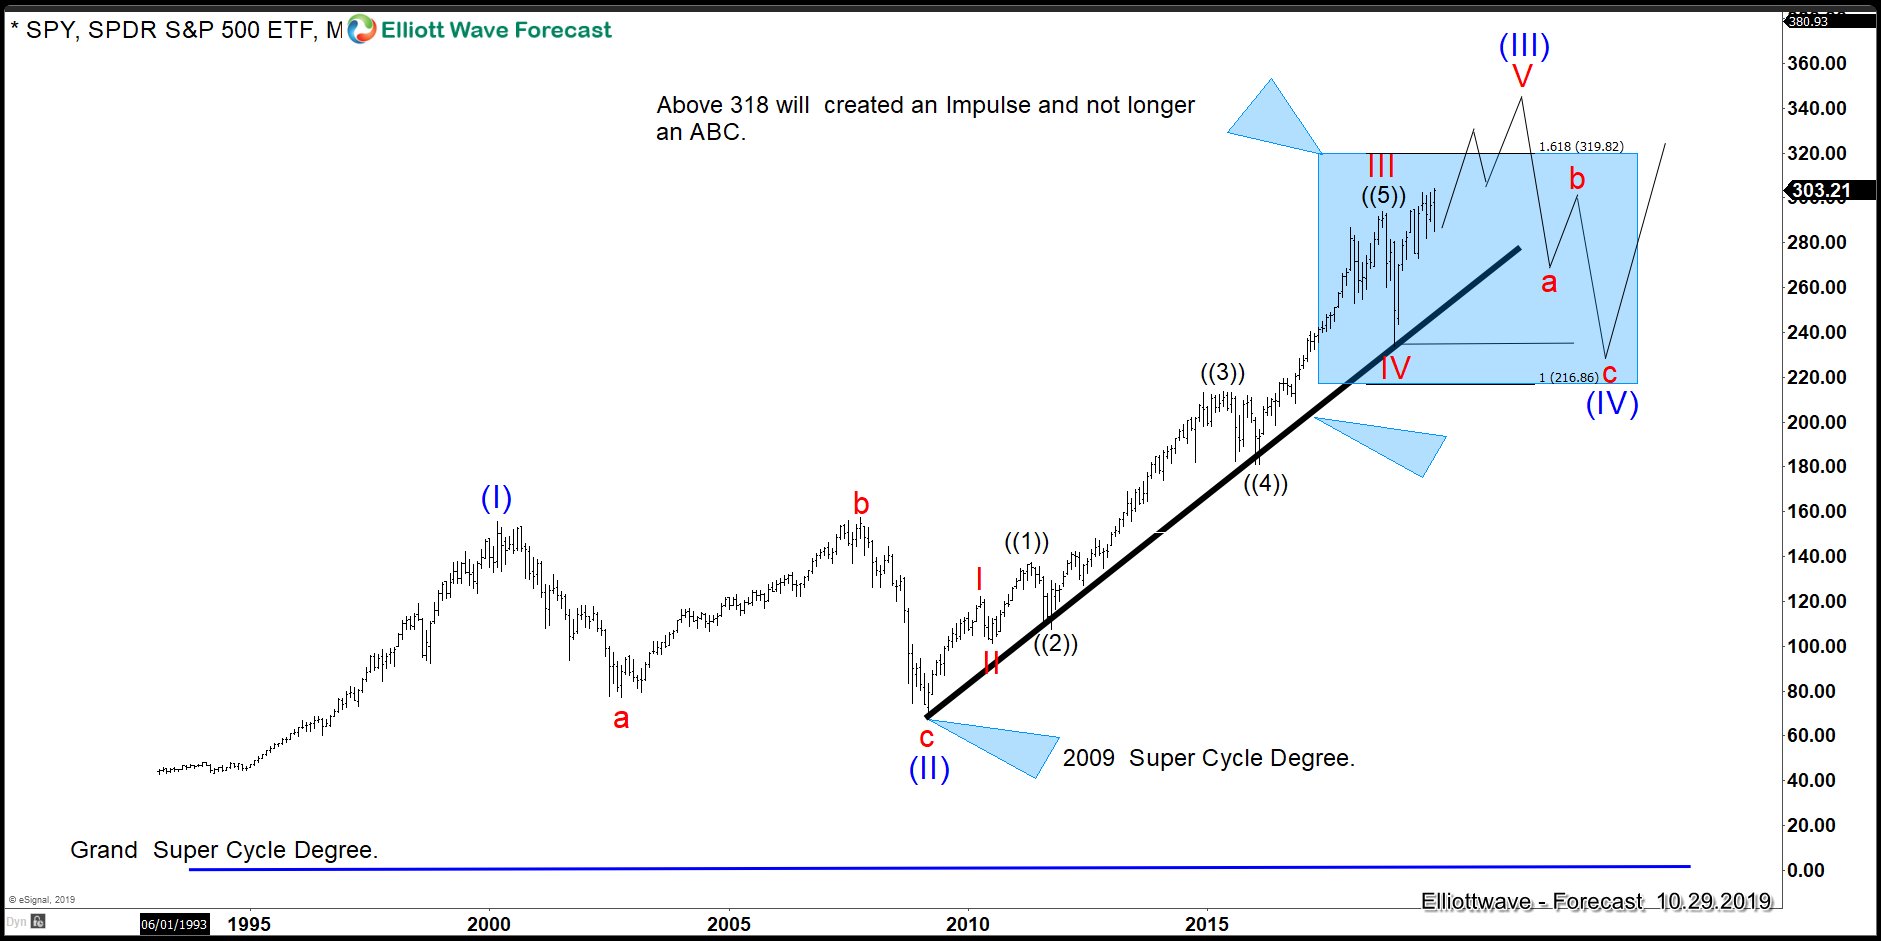
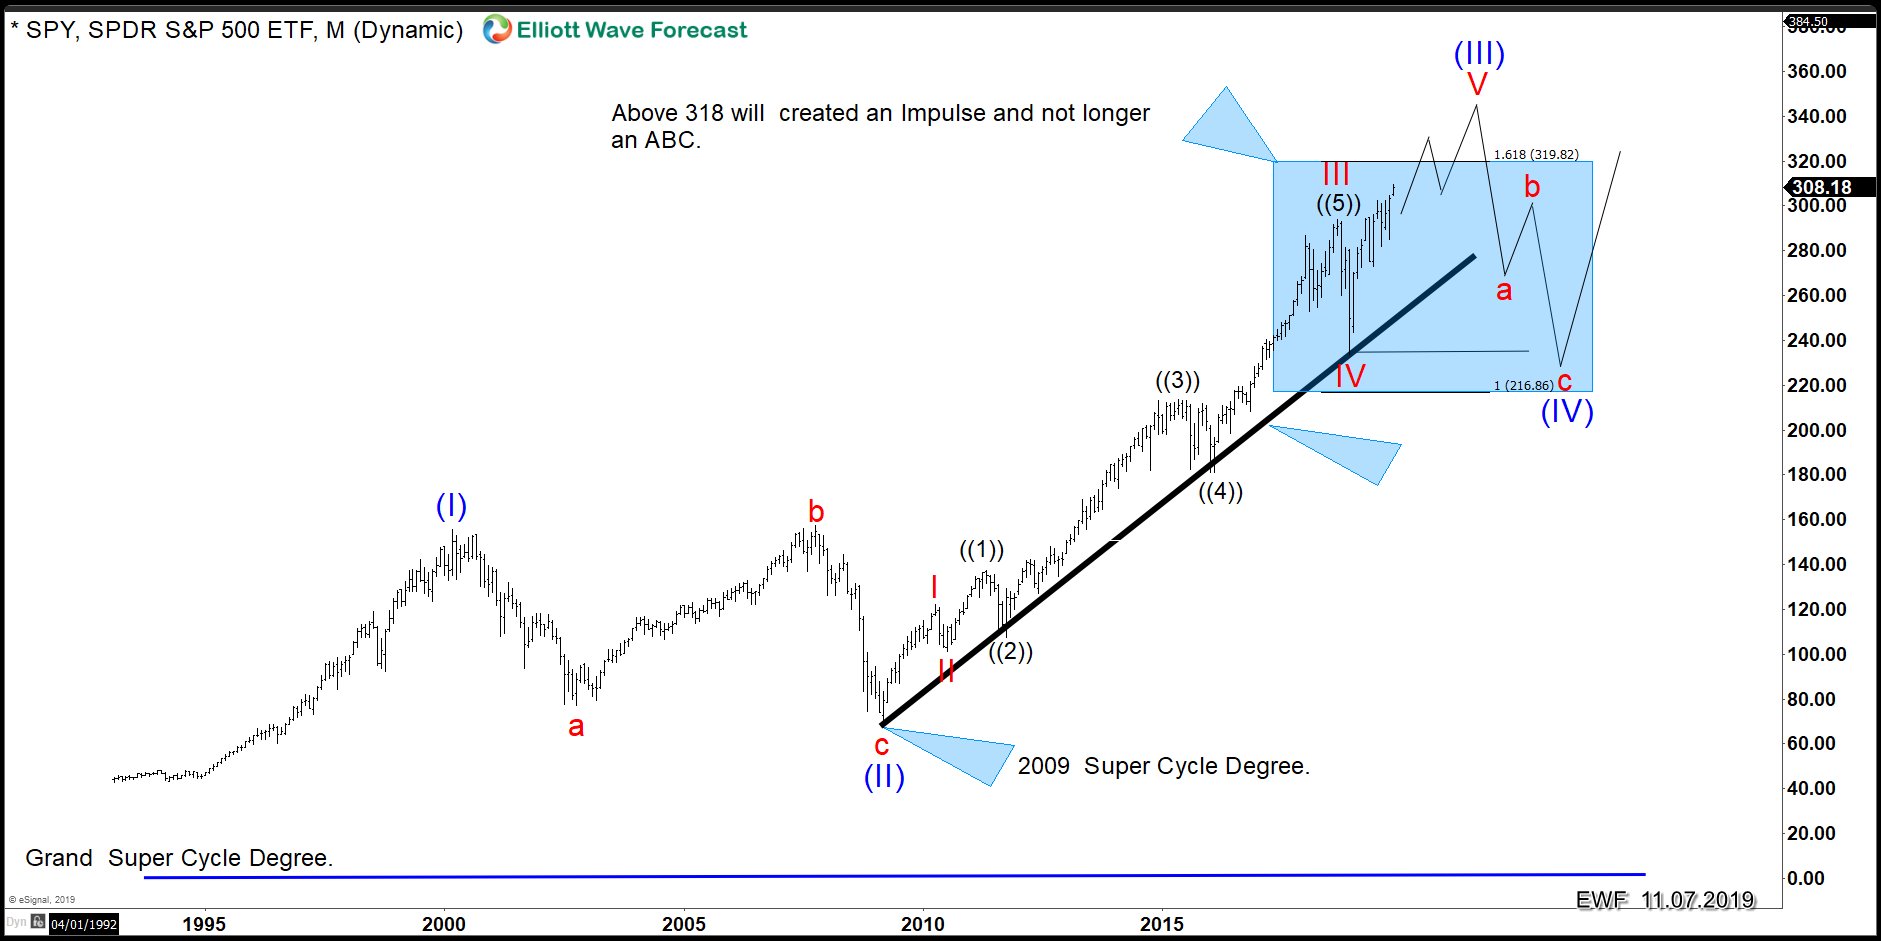
In the chart below you can see Boeing in the Weekly chart within the Supercycle since lows either from 2003 or 2009. SPY still has not shown any signs of weakness, otherwise, we have been sitting at the highs and even making new highs. The bounces in Boeing from $275.00 will make the Index to extend into the 340-370.00 area before a turn lower can be happening. As we will be explaining in the video below. Boeing can make new highs above 3.1.2019 and will be still within the blue wave (V). Retesting the highs will be enough for the World Indices to extend within the 2009 cycle.
Boeing Weekly Elliott Wave Analysis 10.21.2019

Boeing 4 Hour Elliott Wave Analysis 10.21.2019
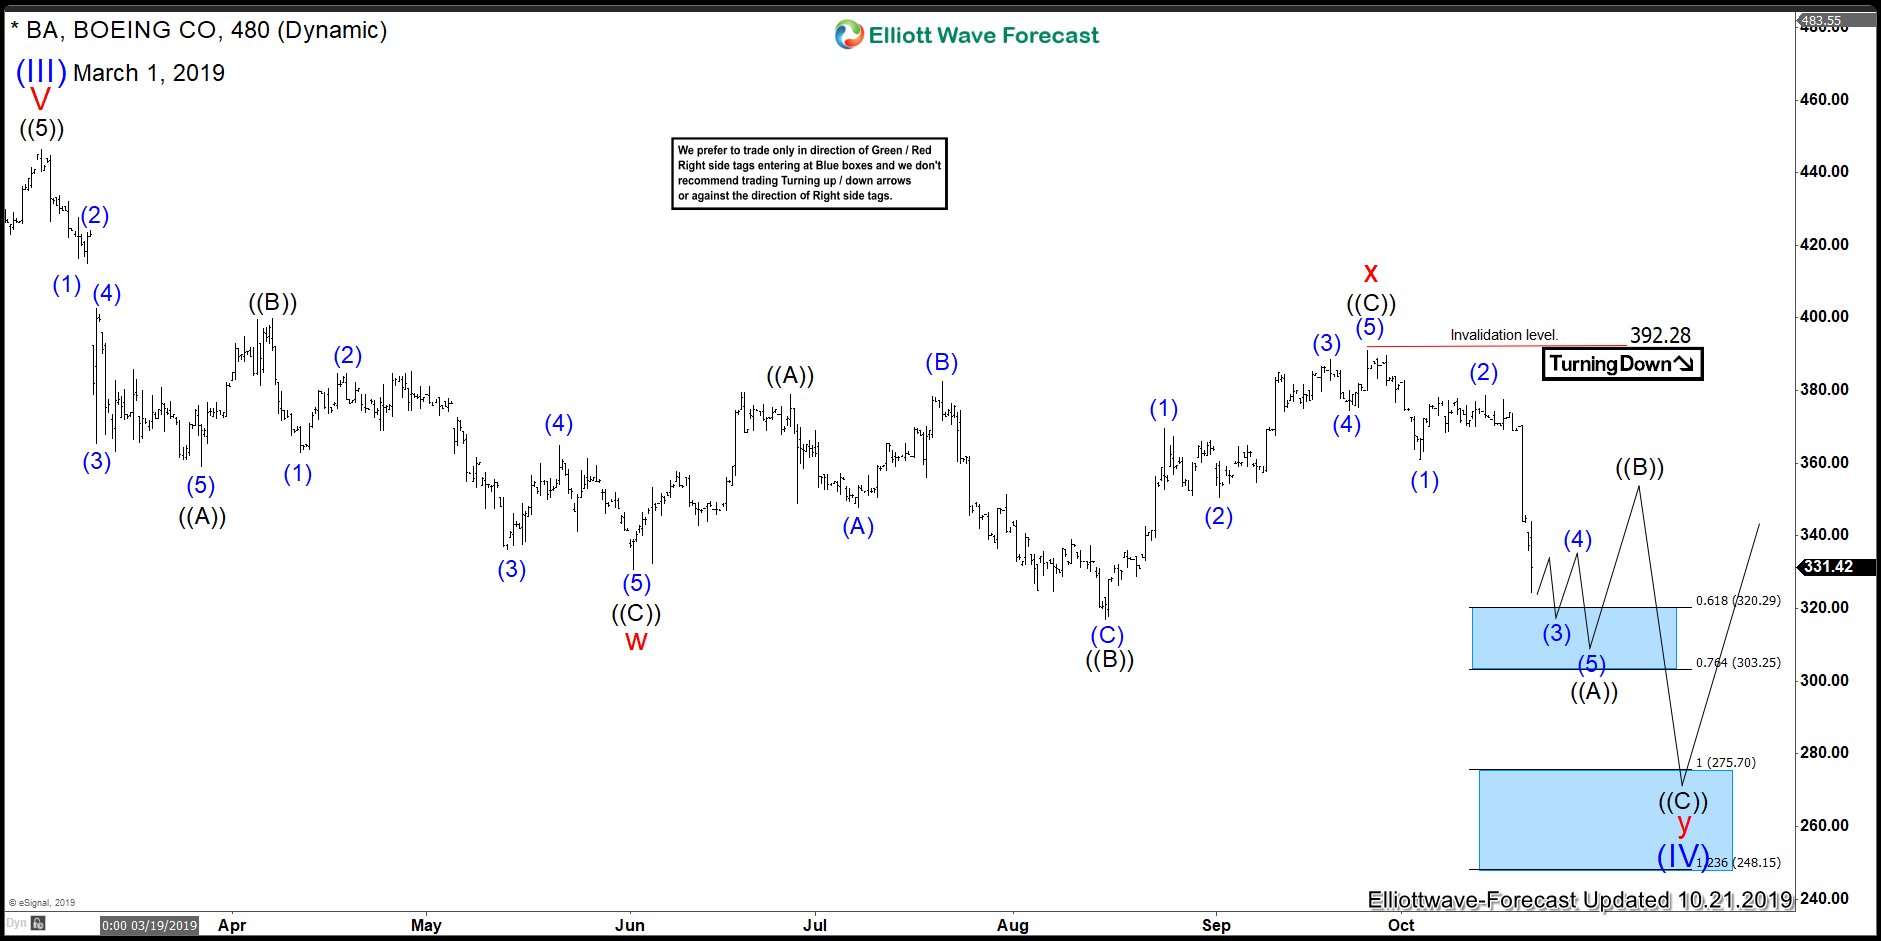
The Instrument is showing a 5 swing sequence from 3.1.2019 peak into the lows to 8.15.2019. We Elliott Wave Forecast understand the Market Nature and we knew that a flat which is an Elliott Wave structure which allows a wave (B) below the beginning of the previous low and a new high above the previous peak as we showing in the following chart.
Boeing ended the Flat structure and has renewed now the move lower. We believe the instrument will trade lower into the $275.00 area and until then the World Indices will be sideways or lower using what we call second dimension correlation in which instrument agree in swing direction, but not agree on the overall direction. We understand that reaching the $275.00 target will make world indices bullish in 4 hours. The reaction higher from the Blue Box will make others to rally and Indices like $SPY, $SPX, $INDU among others will be making all-time highs.
In the chart below you can see Boeing in the Weekly chart within the Supercycle since lows either from 2003 or 2009. SPY still has not shown any signs of weakness, otherwise, we have been sitting at the highs and even making new highs. The bounces in Boeing from $275.00 will make the Index to extend into the 340-370.00 area before a turn lower can be happening. As we will be explaining in the video below. Boeing can make new highs above 3.1.2019 and will be still within the blue wave (V). Retesting the highs will be enough for the World Indices to extend within the 2009 cycle.
Boeing Weekly Elliott Wave Analysis 10.21.2019