Elliott Wave Analysis by EWF

Marvell Technology, Inc., (MRVL) provides data infrastructure semiconductor solutions & spanning data center core to network edge in the US & internationally. It comes under Technology – Semiconductors & trades as “MRVL” at Nasdaq.

MRVL is bullish impulse in daily & continue higher against 6.09.2026 low. The buyers can look for rally targeting $362.7 - $400.09 area to extend April-2025 rally in III sequence.

MRVL - Elliott Wave Latest Daily View:​

Since inception, it ended I in proposed diagonal I at $127.48 high in January-2025 & II at $47.09 low in April-2025. Currently, it favors rally in III towards $362.7 or higher. It placed ((1)) of III at $102.77 high, ((2)) at $70.69 low, ((3)) at $339.6 high, ((4)) at $242 low & favors rally in ((5)). Within ((1)), it ended (1) at $85.27 high, (2) at $61.44 low, (3) at $94.66 high, (4) at $73.62 low & (5) at $102.77 high. Within ((3)), it placed (1) at $83.78 high, (2) at $75.24 low, (3) at $218.26 high, (4) at $194.7 low & (5) at $339.6 high.

MRVL - Elliott Wave Latest 2-Hour View:​

The buyers can look for rally targeting $362.7 - $400.09 area to extend June-2026 rally in ((5)) to end III. Short term pullback in 3, 7 or 11 swings will remain supported above 6.09.2026 low to extend higher. Currently, it favors rally in 3 of (1) & expect few highs before correcting in wave (2). Buyers can wait for entering the longs in (2) in extremes against 6.09.2026 low. Also, buyers can get another opportunity later in IV extremes, once III ends within April-2025 cycle. Do not recommend selling in any pullback. Buyers also can enter next extreme area in double correction, if it breaks below 6.09.2026 low without new high.

Source: https://elliottwave-forecast.com/stock-market/mrvl-target-400-expansion-signals-powerful-upside/
 
The Tadawul All Share Index (TASI) is the benchmark of the Saudi Exchange, tracking the performance of all listed companies on its main market. Established in 1985, it reflects the overall health of Saudi Arabia’s equity market and is closely followed by regional and global investors. Calculated using free‑float market capitalization, TASI spans diverse sectors including energy, banking, petrochemicals, telecom, and real estate. Its movements are strongly influenced by oil prices and heavyweight listings such as Saudi Aramco, making it a key barometer of both local sentiment and broader economic trends.

TASI Latest Elliott Wave Monthly Chart From 6.16.2026​

TASI All Share Index Maintains Sideways Correction


The latest chart highlights the long‑term cycle from the 2009 low, unfolding with overlapping corrective price action. This supports the idea of a leading diagonal structure:

  • Wave I ended in three swings at the 11,159 level.
  • Wave II retraced in another three swings to the 5,327 low.
  • A rally to 13,949 marked the end of Wave III.
  • Below that peak, TASI continues to consolidate within the Wave IV pullback.
Internally, the correction appears to be forming a 7‑swing structure:

  • Wave ((W)) ended at 9,930.
  • A bounce to 12,883 completed Wave ((X)).
  • As long as price stays below 12,883, the index can extend lower in Wave ((Y)) toward the 8,831–6,332 extreme area to complete its weekly correction.
  • A decisive break below 9,930 would confirm the next leg lower.
Source: https://elliottwave-forecast.com/indexes/tasi-all-share-index-maintains-sideways-correction/
 

Tesla: Beyond Automotive Growth, Expanding into Technology and Infrastructure​

Tesla (NASDAQ: TSLA) remains one of the most closely followed companies in global markets. While many investors focus on electric vehicle deliveries and short-term earnings, Tesla’s long-term growth story extends far beyond the automotive sector. The company is expanding into artificial intelligence, autonomous driving, energy storage, robotics, and advanced manufacturing.

Over the last decade, Tesla has transformed into a global technology leader. It has built a scalable production network and established one of the strongest brands worldwide. Beyond vehicle sales, Tesla invests heavily in Full Self-Driving (FSD), Robotaxi services, Megapack energy storage, and the Optimus humanoid robot project. Each of these initiatives could become meaningful contributors to future revenue growth.

These projects give Tesla exposure to several large and rapidly expanding markets. The global shift toward electrification, rising energy storage demand, and advances in artificial intelligence represent secular trends that may support growth for years. As these segments mature, Tesla may increasingly be viewed as a technology and infrastructure company rather than solely an automaker.

Financially, Tesla maintains a strong balance sheet and substantial liquidity. This flexibility allows management to pursue long-term strategic objectives while remaining positioned to capitalize on future opportunities, even during periods of economic uncertainty.

Elliott Wave Structure and Technical Outlook​

From a technical perspective, Tesla’s price action continues to support the broader bullish thesis. Short-term corrections and volatility are normal within any major trend, but the larger Elliott Wave structure suggests Tesla completed a significant correction in January 2023. Since then, the stock has been building a new bullish cycle.

Tesla completed a five-wave advance within its Grand Super Cycle, culminating in the all-time high on November 1, 2021. From that peak, the stock entered a corrective decline that unfolded in a clear Elliott Wave structure. The correction reached the Blue Box buying area in January 2023, where support was found and the decline ended.

TSLA-Weekly20230611094900-1024x525.jpg

Since the January 2023 low, Tesla has produced higher highs and higher lows, confirming that the larger trend remains bullish. However, the advance has been overlapping. In Elliott Wave terms, this means the rally cannot be classified as a traditional impulsive Wave III. Instead, the structure suggests a bullish nesting sequence, with multiple (I)-(II) and I-II formations. These nesting structures often precede strong advances, as they represent the market building energy before a breakout.

Tesla Weekly Elliott Wave Chart​

TSLA-Weekly-20260615211014-1024x508.jpg


As a result, while many traders may be looking for opportunities to sell the stock after its substantial recovery, the Elliott Wave structure continues to favor the bullish side. As long as Tesla remains above the February 1, 2023 low, the larger cycle remains constructive and supports the view that the next significant move should unfold to the upside.

More recently, Tesla peaked in December 2025 and has been correcting that advance. The pullback has developed as a three-wave structure, which is another important signal. At Elliott Wave Forecast, we follow the principle that corrections unfold in sequences of 3, 7, or 11 swings. As long as the stock corrects in a three-wave manner, we prefer to align with the dominant trend.

Whether Tesla finds support against the April 9, 2026 low and resumes higher immediately, or extends lower toward the $293 area, weakness should be viewed as a buying opportunity. Any decline into the right support zone would be considered a gift for investors positioning with the trend before the next acceleration phase.

The current structure suggests Tesla may still be in the early stages of a much larger bullish sequence. As long as the January 2023 low remains intact, the path of least resistance favors higher prices. Our preferred Elliott Wave count supports a long-term target near $774, with potential for even higher levels as the broader cycle matures.

The video below explains the complete Elliott Wave structure, the preferred bullish path, and the alternative scenarios we are monitoring as Tesla continues to develop what could be the next major advance toward significantly higher levels. For a detailed look at the charts and real-time updates, visit www.elliottwave-forecast.com.

Tesla Elliott Wave Video​


Tesla may still be in the early stages of a much larger bullish sequence.

Source: https://elliottwave-forecast.com/vi...ontinues-to-support-higher-prices-toward-774/
 
American Express (AXP) should deliver steady third‑quarter growth. Analysts expect stronger card‑fee revenue and resilient premium spending. The company continues to expand travel and entertainment volumes, which support revenue momentum. Moreover, rising net interest income should lift earnings despite credit‑cost pressure.

Investors should watch guidance updates. Analysts see mid‑to‑high single‑digit revenue growth if spending trends stay firm. However, valuation limits near‑term upside. Still, AXP can outperform if travel demand accelerates and card‑fee growth remains strong.

Elliott Wave Outlook:

Elliott Wave Outlook: AXP Weekly Chart March 08th, 2026


In the March update, we expected AXP to complete the impulse that started in April 2025. We marked that advance as wave ((1)) and looked for extension. However, the strong reaction from the extreme zone indicated that the 2020 cycle likely ended.

We expected a solid rebound that would confirm the end of wave a. Then we projected that rebound would fail and restart the decline. That’s why we stayed cautious, since AXP could still break below 200 dollars.

Elliott Wave Principle Behind the Market Structure​

Impulse

An impulse is a clean 5‑wave pattern that drives the trend forward.

  • Waves 1‑3‑5 are strong and directional.
  • No overlap between waves 1 and 4.
  • Wave 3 is usually the strongest.
  • Structure is clear, with increasing momentum.

ChatGPT-Image-3-mar-2026-07_24_10-a.m.png

Elliott Wave Outlook:

AXP-Weekly.jpg

AXP continues to advance within the bullish cycle that started in 2020. The price reached the 1.236 and 1.618 extensions, which confirms strong momentum and supports the larger corrective structure. The count shows wave a already ended, and the market now develops the correction in wave b. This structure allows wave b to be complete and wave c already in progress. However, the chart still allows one more high toward 350–360 before the corrective cycle turns lower again.

After that potential high, we expect AXP to turn down and deepen wave c. In that scenario, we monitor the 200–250 region, where we project the end of wave (II). That zone should show clear signs of exhaustion and set the foundation for the next bullish cycle.

Source: https://elliottwave-forecast.com/stock-market/axp-may-be-entering-the-next-downside-phase/
 
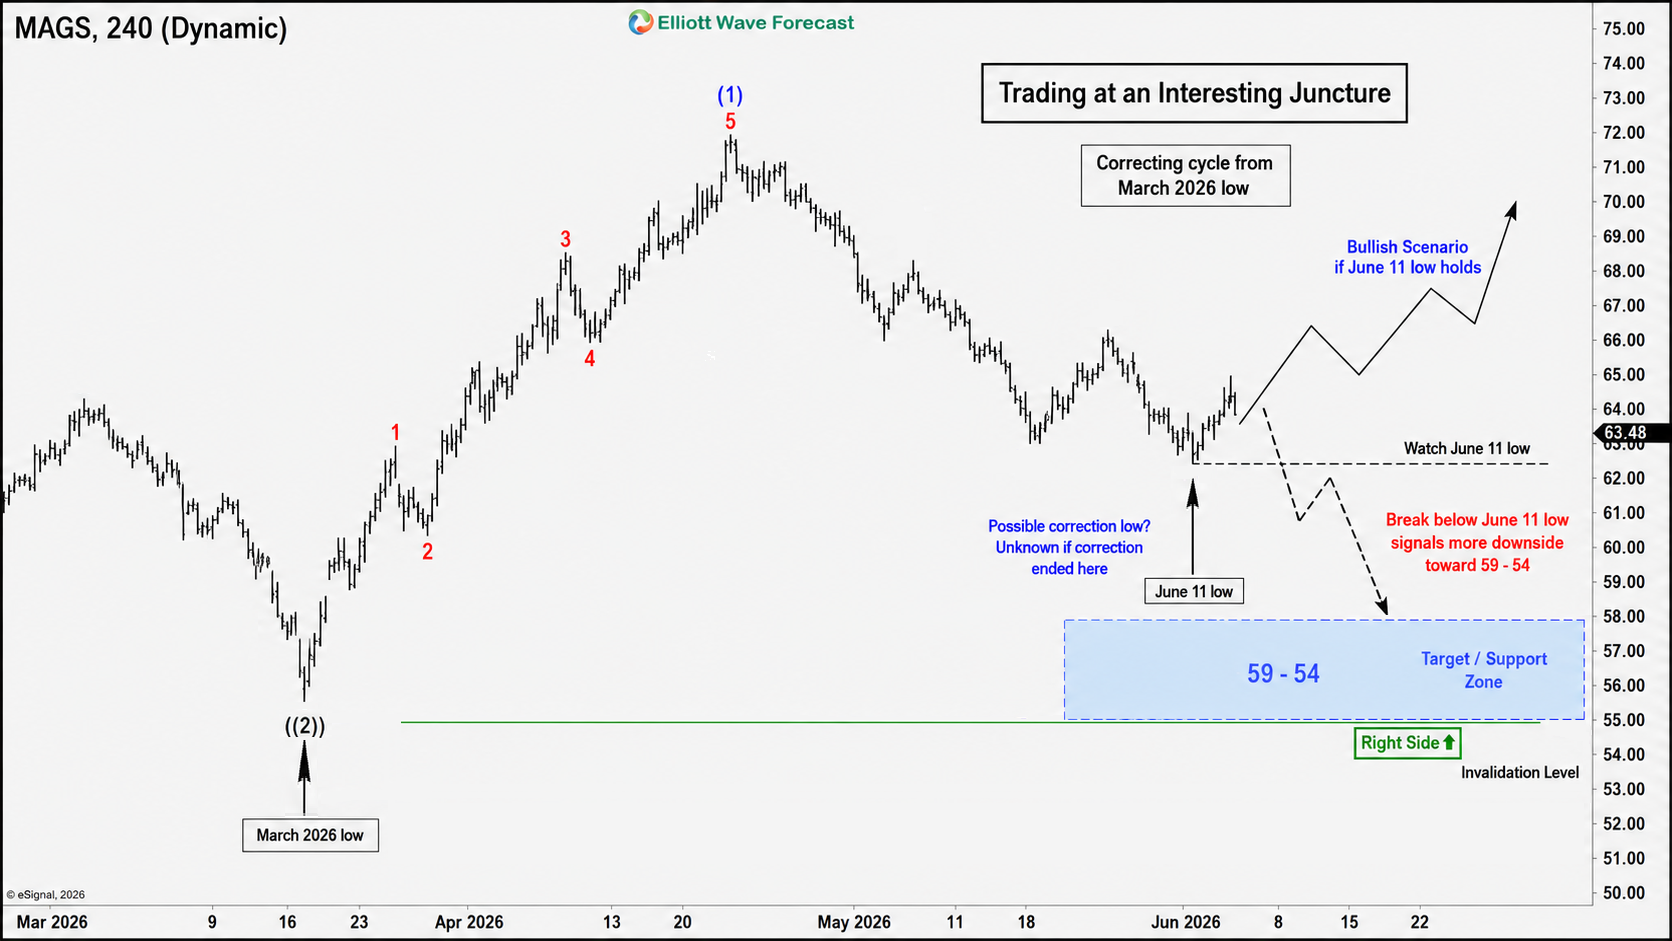
In this Elliott Wave update, we take a look at the latest structure in Roundhill Magnificent Seven ETF ($MAGS). The ETF is trading at an interesting juncture as it continues to correct the cycle from the March 2026 low. At this stage, it remains unclear whether the correction has already ended at the June 11 low or whether one more leg lower is still needed before buyers regain full control.

That uncertainty makes the June 11 low the key pivot in the short term. If price continues to hold above that level, the pullback may already be complete and the next leg higher can start to develop. However, if $MAGS breaks below the June 11 low, then the correction likely remains incomplete and more downside can unfold toward the March low area at 59–54.

$MAGS Is Correcting the Cycle From the March 2026 Low​

$MAGS

Looking at the 4-hour chart, $MAGS started a strong bullish cycle from the March 2026 low and rallied into a spring peak. After that advance, the ETF turned lower and entered a corrective phase. Since then, price action has remained choppy and overlapping, which supports the view that the move lower is corrective rather than a fresh impulsive bearish trend.

Even so, the correction has not yet provided a fully confirmed completion signal. As a result, traders now need to focus on the June 11 low as the line that can help determine the next directional move.

June 11 Low Is the Decision Point​

Most importantly, the June 11 low now acts as the key near-term support. If buyers continue to defend that pivot, then $MAGS may have already completed the pullback and could resume higher from current levels. In that scenario, the recent rebound would likely mark the early stages of a new push higher within the broader bullish sequence from March.

On the other hand, if price breaks below the June 11 low, that would strongly suggest the correction is not finished yet. In that case, the ETF can extend lower and revisit the March lows again, with the next important downside zone coming in around 59–54.

What the 59–54 Area Means​

The 59–54 area stands out as the next major support region if the June 11 low fails. This zone sits near the March low region and would represent an important area where buyers may try to step back in again. Therefore, a break below June 11 would not just signal weakness in the short term. It would also increase the probability that the market needs a deeper retracement before the broader bullish cycle can resume.

For that reason, the current structure should be monitored closely. The market is not yet offering a fully resolved bullish or bearish outcome. Instead, it is sitting at a pivot where the next break should provide the answer.

Near-Term Outlook for $MAGS​

In the near term, two scenarios remain in play. First, if the June 11 low holds, $MAGS can continue building a recovery and push higher from the current area. Second, if that low breaks, the correction should extend lower toward 59–54 before a more meaningful low is in place.

Accordingly, traders should stay flexible and let price confirm the next path. The setup is clear: hold above June 11 and the bullish case improves, break below it and the downside opens toward the March lows.

Technical Summary​

To summarize, $MAGS is correcting the cycle from the March 2026 low and is now trading at an important inflection point. At the moment, it remains unknown whether the correction ended at the June 11 low or whether more downside is still ahead.

As long as the June 11 low holds, the ETF can recover and resume higher. However, a break below that level would signal that the correction remains incomplete and can send $MAGS back toward the March support area at 59–54.

Source: https://elliottwave-forecast.com/st...ng-juncture-as-june-11-low-becomes-key-pivot/
 
Launched in 2010, the Global X Silver Miners ETF (SIL) offers investors diversified access to leading silver mining companies worldwide. By tracking the Solactive Global Silver Miners Total Return Index, it provides a simple, single‑trade entry into the sector. In the following discussion, we present its Elliott Wave technical outlook.

SIL (Silver Miners ETF) Monthly Elliott Wave Chart​


SIL-Monthly20260622114327.jpg


The monthly Elliott Wave chart of the Silver Miners ETF (SIL) indicates that the instrument achieved a fresh all‑time high in January of this year, reinforcing a bullish right‑side outlook. A major low completed in January 2016 at $14.94, which we identify as Grand Super Cycle wave ((II)). From this base, SIL has begun to nest higher within wave ((III)).

Advancing from wave ((II)), wave I concluded at $54.34. A corrective decline followed in wave II that bottomed at $16. The ETF then rallied in wave ((1)) to $52.87, with the subsequent pullback in wave ((2)) ending at $21.26. A powerful advance in wave ((3)) carried prices to $119.24. Currently, the ETF is undergoing a corrective phase in wave ((4)). The pullback subdivides into a seven‑swing structure from the September 2022 low. Once this correction completes, SIL should resume its upward trajectory in alignment with the larger bullish cycle.


Silver Miners ETF Daily Elliott Wave Chart​


SIL-Daily20260622121752.jpg


The daily Elliott Wave chart of the Silver Miners ETF (SIL) indicates that the rally in wave ((3)) has concluded, and a corrective pullback in wave ((4)) is currently unfolding within a seven‑swing double three structure. From the peak of wave ((3)), wave (W) ended at $77.58, followed by a rally in wave (X) that terminated at $104.19. The subsequent decline in wave (Y) is now in progress, targeting the extreme blue box area between $37 and $62.60. This zone is expected to attract buyers and set the stage for the next bullish cycle continuation in alignment with the broader Elliott Wave outlook.

Source: https://elliottwave-forecast.com/vi...e-potential-remains-with-unfinished-sequence/
 
In the world of trading, precision is everything. Reacting to a market move after it happens is easy but anticipating where buyers will step in before a single green candle prints is where the real edge lies.

Today, we’re breaking down a textbook technical setup on Apple Inc. (AAPL) using Elliott Wave theory, focusing on our high probability "Blue Box" forecasting area.

The Setup: Mapping the Correction

When analyzing the price action of AAPL, our primary focus was tracking a clear corrective structure against the dominant uptrend. In technical analysis, markets rarely move in a straight line; they breathe in impulses and breathe out in corrections.

As shown in the chart AAPL from 06.01.2026 chart below, AAPL completed a multi-wave bullish cycle and began pulling back in a corrective sequence. Instead of guessing a random support level, we utilized Elliott Wave structures and Fibonacci extensions to identify a precise inflection point.

AAPL-1-hr-1-june-before.png


The Anatomy of the Blue Box

Our chart highlighted a highly reliable area known as the Blue Box. For those unfamiliar with our methodology, a Blue Box represents a high-probability technical zone where 3, 7, or 11 waves of a corrective pattern are expected to terminate, clearing the path for the market to resume its primary trend.

  • The Pattern: The correction unfolded as a double three structure, labeled (w)‑(x)‑(y). Later, as charts progress, this can transition into ((a))‑((b))‑((c)) with charts moving to future.
  • The Target Zone: The 100%–161.8% Fibonacci extension of the initial leg down gave us a defined value range between 307.73 and 304.33.
  • The Directive: Right on the chart, our system displayed two clear, disciplined reminders:
"Right Side ⬆" (indicating the primary trend remains bullish)
"We Do Not Recommend Selling"

The Execution: Precision Inside the Blue Box

When we first looked at the setup, AAPL was completing a corrective sequence. Rather than chasing the market or guessing support levels blindly, we trusted our system's Blue Box—our signature high-probability inflection zone.

As seen in the updated chart AAPL 06.04.2026 chart below, the price followed our blueprint with incredible technical accuracy.

AAPL-1-hr-4-june-after.png


The Result: A Powerful Bullish Turn

Once wave ((c)) wrapped up inside the blue box, the "Right Side ⬆" bullish trend reasserted itself with authority.

As captured in AAPL 06.04.2026 chart above, AAPL launched out of the blue box into an aggressive, multi-wave impulsive rally. The stock quickly cleared previous short-term resistance levels, pushing up toward the $315–$316 region to complete subsequent impulsive waves (iii) and (v) allowing longs to take partial profits.

This textbook reaction gave disciplined traders an incredibly low-risk entry point with maximum reward potential, proving once again why we emphasize waiting for the market to come to the blue box rather than forcing trades.

Why the Blue Box Works?

Many traders make the mistake of trying to "catch a falling knife" during a pullback. The Blue Box acts as a filter. It tells us to be patient, wait for the market to reach an area where buyers have a mathematical advantage, and then look for the turn.

By looking at AAPL chart from 06.01.2026, our members knew well in advance exactly where the correction was projected to exhaust itself. This completely eliminates the emotional guesswork from trading.

Source: https://elliottwave-forecast.com/bl...wave-analysis-nailed-the-aapl-bullish-bounce/
 
Royal Bank of Canada., (RY) operates as diversified financial service company worldwide. It operates through personal finance, commercial banking, wealth management & Insurance segments. It comes under “Financial services” sector & trades as “RY” ticker at NYSE.

As mentioned in last article, RY continue impulse rally in 1 of (3). It already broke the trend channel upward, favoring continuation for target above 226.9 or higher. Buyers can look to buy the pullback in 3, 7 or 11 swings against March-2026 low.

RY - Elliott Wave Latest Weekly View:​

RY-W6.jpg

Since March-2020 low as (II), it started rally in (III) in weekly. It placed I of (III) at $119.41 high in January-2022 & II at $77.90 in October-2023 low. It ended ((1)) of III at $128.05 high, ((2)) at $106.10 low & favors rally in ((3)) as nest from April-2025 low. Within ((1)), it ended (1) at $176.19 high, ended (2) at $156.91 low & favors rally in (3) towards $226.96 - $270.2 area. In (1), it placed 1 at $149.26 high, 2 at $143.13 low, 3 at $174.61 high, 4 at $164.95 low & 5 at $176.19 high.

RY - Elliott Wave View From 4.13.2026:​

RY-W5.jpg

It managed to break the trend channel upward, confirming rally to be (3). The RSI should erase the momentum divergence for further confirmation to be (3). It out-performs the Finance sector & market. Currently, it favors rally in 1 of (3), expected as April-2026 update. It expects more upside in 1 before correcting in 2. We like to buy the clear pullback in 3, 7 or 11 swings at extremes in 2 against 3.30.2026 low. It proposed most bullish case as nesting in III. So far the high shows momentum divergence & if breaks below March-2026 low, it can end ((1)) at last peak before correcting against October-2023 low in alternate scenario before rally continue.

Source: https://elliottwave-forecast.com/stock-market/ry-forecast-wave-3-targets-226-96-270-20/
 
XLF (State Street Financial Select Sector SPDR ETF) has shown a bullish impulse since the June 3, 2026 low. The 1‑hour Elliott Wave structure favors further upside as the ETF has been making higher highs and higher lows, which supports a buy‑the‑dip approach at defined blue box areas.


Elliott Wave Technical View From June 19 2026​

  • The rally from the June 3 low is unfolding as an impulse.
  • The advance completed wave ((iii)) at $54.89.
  • A corrective wave ((iv)) followed, unfolding as a zigzag:
    • Wave (a) ended at $53.90.
    • Wave (b) bounced to $54.61.
    • Wave (c) reached the blue‑box area near $53.62–$53.00 (equal‑legs zone).
  • Buyers were expected to appear in that blue box, offering a low‑risk long entry and the potential for at least a three‑wave bounce.
XLF Rally from Blue Box Delivers Risk‑Free Setup


Updated 1‑Hour View From June 23 2026​

  • After the blue‑box reaction, XLF produced a clean rally that allowed members to establish risk‑free long positions once protective stops were in place.
  • A break above the prior $54.89 high is required to confirm the next leg higher.
  • Initial upside targets on confirmation are $55.29 and $55.94 before a likely profit‑taking pullback that may unfold in 3 or 7 swings.
XLF Rally from Blue Box Delivers Risk‑Free Setup


Key Levels and Rules​

  • Invalidation / Critical Support: below the blue‑box low near $53.00 (use chart‑specific invalidation).
  • Short‑term confirmation: break and hold above $54.89.
  • Targets on confirmation: $55.29; $55.94.
Trade plan: buy dips into blue boxes using 3, 7, or 11‑swing sequences; place stop‑losses below the invalidation pivot and scale into winners.


Trading Insight​

  • Maintain a bullish bias while the impulse structure and higher‑high sequence remain intact. Use corrective pullbacks to the blue‑box zones as defined entry areas, then manage positions with clearly defined stop‑losses and profit targets. This approach lets you create risk‑defined or near risk‑free positions once the trade is in your favor. Discipline in risk and money management, combined with a working knowledge of Elliott Wave and cycle relationships, is essential to execute this plan consistently.
Source: https://elliottwave-forecast.com/bluebox-wins/xlf-rally-from-blue-box-delivers-risk-free-setup/
 

Long-Term Bullish Trend Remains Intact

Teradyne Inc. (NASDAQ: TER) continues to display a strong bullish Elliott Wave structure on the monthly chart, suggesting the long-term uptrend remains intact. The stock completed a major wave II correction in 2025 after finishing a larger A-B-C corrective pattern. Buyers responded aggressively from the low, confirming the end of the correction and the start of a new impulsive cycle. The sharp rally from the 2025 low supports the view that Teradyne has entered wave III, which is typically the strongest and longest wave in an Elliott Wave sequence. The current advance has already produced strong bullish momentum, reinforcing the positive long-term outlook.

From an Elliott Wave perspective, the current rally appears to be in the early stages of wave III. Based on Fibonacci relationships, we expect wave III to extend toward 498.87, which represents the 2.618 Fibonacci extension of wave I. This level serves as the next major upside target before the stock enters a corrective wave IV. After wave IV completes, we expect another rally in wave V, which should carry Teradyne to fresh all-time highs and complete the larger impulsive sequence.

TER_2026-06-26_06-52-34-scaled.png

Elliott Wave Forecast

The preferred outlook remains bullish while price holds above the 65.50 invalidation level. As long as this level remains intact, the larger Elliott Wave count continues to favor additional upside.

We do not recommend selling into the current strength. Instead, we continue to favor buying pullbacks in 3, 7, or 11 swings, as these corrections often provide high-probability opportunities to join the prevailing trend. The projected path suggests Teradyne should continue higher toward 498.87, followed by a healthy wave IV correction before the final advance in wave V.

Conclusion

Teradyne remains in a strong long-term bullish Elliott Wave cycle following the completion of wave II. As long as price stays above 65.50, we expect wave III to extend toward the 498.87 target before a wave IV pullback. The larger structure continues to favor higher prices and new all-time highs in the current bullish cycle.

Source: https://elliottwave-forecast.com/stock-market/teradyne-elliott-wave-wave-iii-targets-498-87/
 

Coinbase Correcting After Completing Wave I​

Coinbase Global Inc. (NASDAQ: COIN) remains in a bullish Elliott Wave structure despite the recent weakness from its 2025 high. The weekly chart suggests the stock completed a large impulsive wave I before entering a corrective wave II, which remains in progress. The advance began from the 2022 low, where Coinbase completed waves ((1)) and ((2)) before extending into a strong wave ((3)). After a corrective wave ((4)), buyers returned once again, driving the stock higher to complete wave ((5)). This final advance completed the larger degree wave I, confirming the end of the first impulsive cycle from the 2022 low.

Wave II Moving Toward the Blue Box Support Zone​

Following the completion of wave I, Coinbase has entered a larger degree wave II correction. The decline is still unfolding and appears incomplete, suggesting additional downside before the correction reaches its conclusion.

Our preferred support area lies between 118.44 and 86.59, which represents the 50% to 61.8% Fibonacci retracement of the entire wave I advance. At Elliott Wave Forecast, we identify this blue box as a high-probability reversal area where corrective structures frequently end and buyers return. As the stock approaches this region, we will monitor the price action for a completed corrective sequence that can signal the end of wave II.

COIN_2026-06-26_07-25-32-scaled.png

COIN Elliott Wave Forecast​

From an Elliott Wave perspective, we do not recommend selling into the current decline. Instead, we continue to favor buying corrective pullbacks once they reach our blue box support area. As long as Coinbase remains above the long-term invalidation level at 31.55, the larger bullish count remains valid. Once wave II completes, we expect the stock to begin wave III, which should resume the long-term uptrend and eventually break above the previous wave I high.

The larger structure continues to favor higher prices, making the current correction a potential buying opportunity rather than the start of a new bearish trend.

Conclusion​

Coinbase remains within a larger bullish Elliott Wave cycle despite the ongoing wave II correction. We expect the decline to find support in the 118.44–86.59 blue box before buyers regain control. As long as price stays above 31.55, the preferred scenario remains for wave III to resume the uptrend and carry Coinbase to new highs.

Source: https://elliottwave-forecast.com/st...-key-support-area-could-spark-the-next-rally/
 
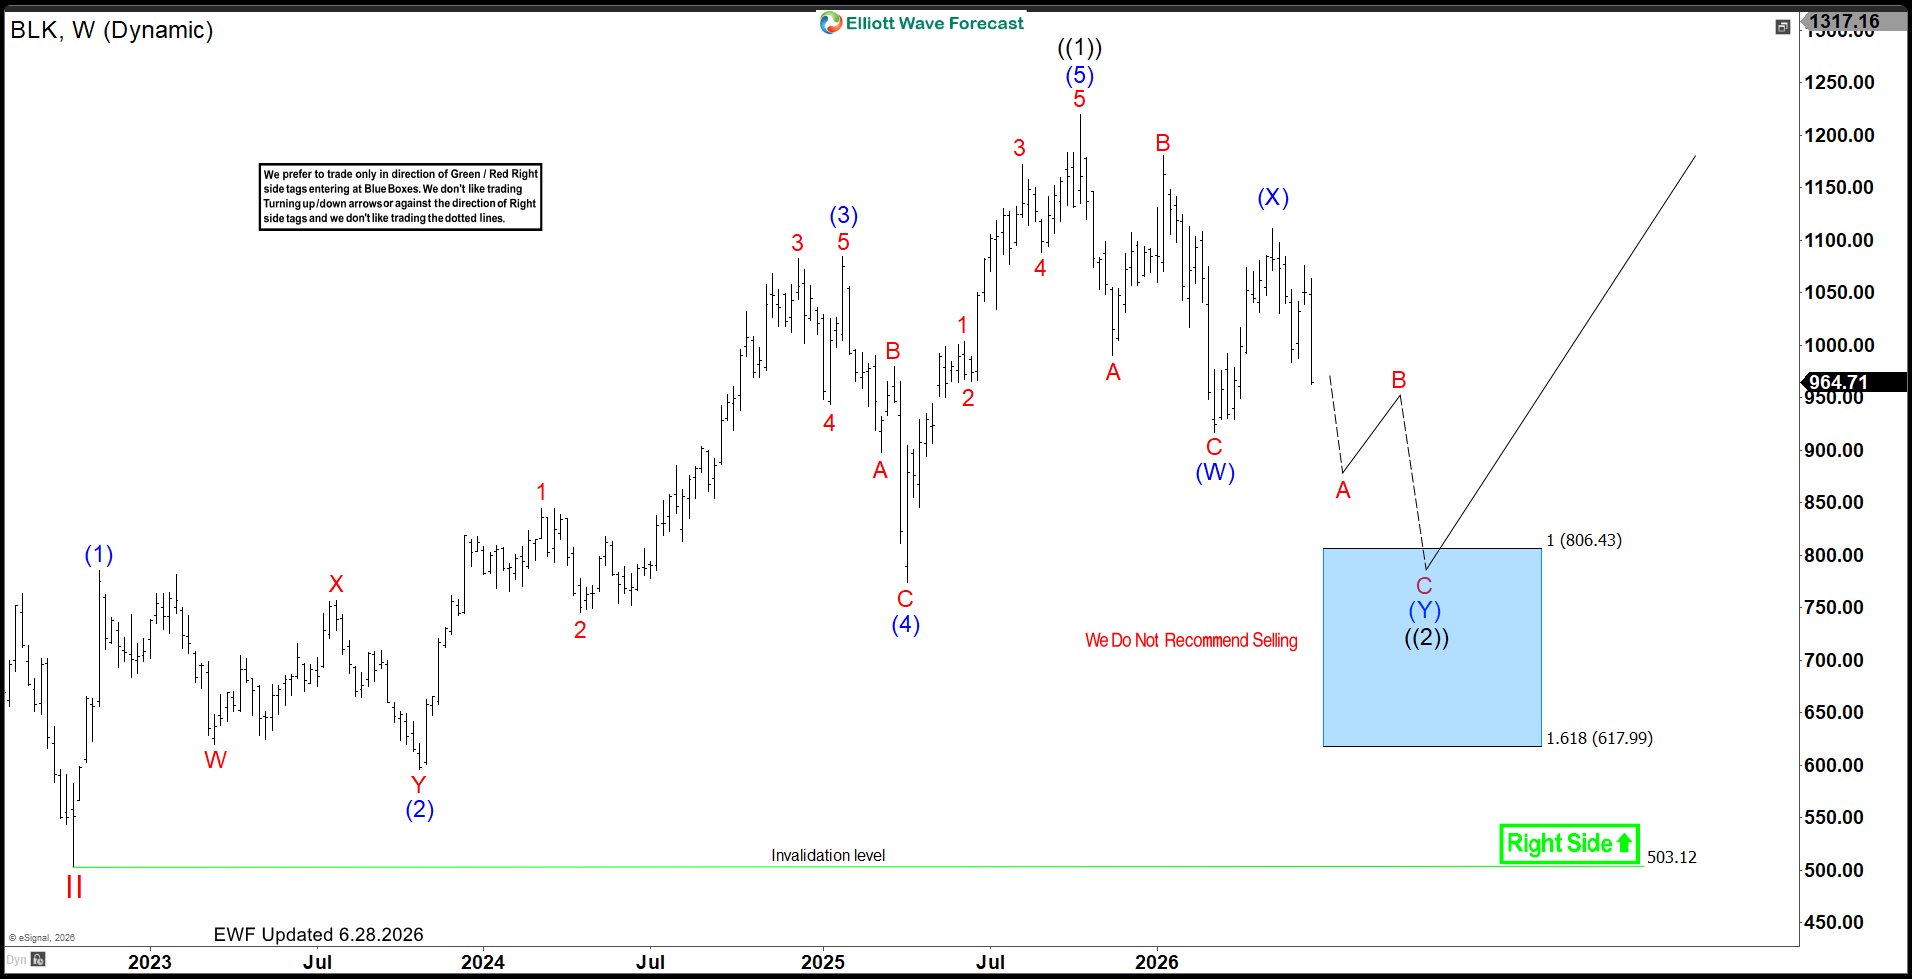
In this Elliott Wave update, we take a look at the latest structure in BlackRock Inc. ($BLK). The stock appears to have completed a 5-wave advance from the October 2022 low and has now turned lower in a broader corrective phase. At this stage, the move down looks corrective rather than impulsive, which supports the view that BLK is pulling back in a 7-swing correction. However, the next important signal comes from the March 12th low. If price breaks below that level, more downside should open toward the 807–618 area.

5 Wave Impulse + 7 Swing WXY correction​

BLK Appears to Have Ended 5 Waves From the October 2022 Low​

$BLK

Looking at the bigger picture, $BLK started a strong bullish cycle from the October 2022 low and advanced in what looks like a completed 5-wave impulsive sequence. The rally carried the stock into a major peak before momentum started to fade.

After that high, $BLK failed to extend higher and instead began to trade lower in a more overlapping and corrective fashion. Consequently, the stock now appears to be correcting the entire cycle from the October 2022 low rather than starting a fresh bullish leg right away.

Pullback Is Unfolding in 7 Swings​

So far, the decline does not look like a straight five-wave bearish impulse. Instead, the structure looks more consistent with a 7-swing correction, which is a common Elliott Wave pattern after a completed bullish cycle.

This matters because 7-swing pullbacks often develop in a choppy and overlapping way before they reach an extreme support area. Therefore, the current weakness should be viewed as part of a broader correction, not necessarily as the start of a long-term trend reversal.

March 12th Low Is the Key Pivot​

Most importantly, the March 12th low now acts as the key level to watch. As long as $BLK remains above that low, the market can still try to stabilize and keep the correction contained. However, if the stock breaks below the March 12th low, that would strongly suggest that the correction remains incomplete and that another leg lower is still needed.

In that bearish scenario, the next downside zone comes in around 807–620. That area stands out as the broader support region where the 7-swing correction can continue to mature.

Why the 807–618 Area Matters​

The 807–618 area is the next major downside target if the March 12th low gives way. This zone represents a deeper retracement area where the larger correction may begin to find support. In other words, a break of March 12th would increase the probability that $BLK needs to revisit much lower levels before a stronger bullish reaction can develop.

For that reason, traders should treat the March 12th level as the decision point. Hold above it and the correction may stay more contained. Break below it and the path opens toward the 807–618 area.

Near-Term Outlook for BLK​

In the near term, $BLK remains in correction mode. The price action suggests the stock is still working through the pullback from its major high, and the market has not yet confirmed that the decline is over.

Accordingly, traders should stay patient and let the key pivot decide the next move. If $BLK breaks below March 12th, the bearish correction should extend. On the other hand, if the stock holds that level, it may continue to consolidate before the next larger move becomes clearer.

Technical Summary​

To summarize, $BLK appears to have ended a 5-wave advance from the October 2022 low and is now pulling back in a 7-swing correction. The March 12th low is the key support to watch. If price breaks below that level, the correction likely remains incomplete and the stock can extend lower toward the 807–618 area.

For now, $BLK trades at an important juncture, and the next break should help confirm whether the correction still has more room to run.

Source: https://elliottwave-forecast.com/st...from-october-2022-and-pulls-back-in-7-swings/
 
In the world of trading, timing is everything. The EURGBP chart below highlights an important lesson in market analysis: waiting for the right area of interest can make the difference between chasing price and positioning with a clear plan.

Using Elliott Wave analysis, the market structure suggested that EURGBP was not in a favorable area to Sell immediately. Instead, the focus was placed on waiting for price to complete its corrective pattern and reach the projected Blue Box area, where a higher-probability reaction was expected.

EURGBP-4-hr-18-june-before.png


The Elliott Wave Roadmap

The chart shows EURGBP developing a corrective structure. The analysis identified that price was moving through a wave sequence and that the final leg higher was expected to complete inside the Blue Box area.

Rather than buying into strength or reacting emotionally to short-term movements, the forecast highlighted:

  • A potential completion zone for the correction
  • A defined area where Sellers could become interested
  • A clear invalidation level that would determine whether the idea remained valid
This approach demonstrates one of the biggest advantages of Elliott Wave analysis: it provides traders with a roadmap instead of a reaction.

Why the Blue Box Matters?


The Blue Box represents a high-probability reversal zone derived from Fibonacci relationships within the Elliott Wave structure.

The key idea was simple:

Do not sell in the middle of the move. Wait for price to reach the area where the wave structure suggests the correction may be complete.

Many traders struggle because they enter too early. They see price moving and fear missing out. However, Elliott Wave encourages discipline by allowing the market to come to your planned level.

The Importance of Patience in Trading

The chart also includes the message:

"We do not recommend buying"

This is a powerful reminder that not every price movement creates an opportunity. Sometimes the best trade decision is no trade at all.

A disciplined trader understands:

  • A setup is not complete until all conditions are met
  • Patience protects capital
  • Waiting for confirmation improves risk management
Managing Risk with Invalidation

Another important element shown on the chart is the invalidation level above the projected zone.

Every Elliott Wave setup requires a point where the analysis becomes incorrect. This allows traders to define risk before entering.

A proper trading plan includes:

  1. Where price is expected to react
  2. Where the idea is invalid
  3. The potential reward compared to the risk (Inside Members Area)
Without invalidation, a forecast becomes a guess.

The Forecast: Waiting for the Blue Box

The initial EURGBP analysis showed price moving into a corrective phase. Instead of buying before confirmation, the forecast identified the Blue Box as the area where the wave structure suggested buyers could become exhausted and sellers could step in.

The key principles were:

  • Wait for price to reach the projected zone
  • Avoid entering in the middle of the move
  • Use invalidation levels to control risk
  • Trade only when structure aligns with the forecast
The Blue Box represented a high-probability area based on the Elliott Wave pattern and Fibonacci relationships.

What Happened After Price Entered the Blue Box?

Once EURGBP reached the Blue Box area, price reacted exactly as the forecast anticipated.

The market pushed into the target zone, completing the expected wave structure. After reaching the area, momentum started to weaken and price failed to continue higher.

Instead, EURGBP reversed lower and moved away from the Blue Box. Se bellow chart.

EURGBP-4-hr-25-june-after.png


This reaction demonstrated the importance of having a predefined trading area. The forecast did not rely on predicting every candle — it focused on identifying where the market had a higher probability of changing direction.

The Power of Having a Trading Plan

Many traders struggle because they enter after a move has already happened. They buy after price rallies or sell after price falls, often placing themselves in poor positions.

The EURGBP example shows a different approach:

  1. Identify the wave structure
  2. Mark the potential completion zone
  3. Wait patiently for price to arrive
  4. Look for confirmation and manage risk
The Blue Box created a framework where traders could prepare instead of react emotionally.

Elliott Wave and Market Timing

Elliott Wave analysis is not about predicting the future with certainty. It is about understanding market structure and probabilities.

In this case, the structure suggested that the corrective move had a likely completion area. When price reached that zone, the market responded with the expected reversal.

This is why patience is one of the most important skills in trading.

The Lesson from EURGBP

The EURGBP setup highlights three important trading lessons:

  1. The market rewards patience
    The best entries often come after waiting, not chasing.
  2. A forecast needs a location
    Knowing where price may react is more valuable than simply knowing the direction.
  3. Risk management is part of the analysis
    A valid setup includes both an opportunity zone and an invalidation level.
The EURGBP Blue Box reaction is a reminder that disciplined trading is about waiting for the market to reach your level — then acting with confidence when the setup appears.

Source: https://elliottwave-forecast.com/bluebox-wins/eurgbp-sells-off-from-extreme-area-blue-box/

 
Astera Lab, ALAB, is retreating after over 340% gain between April and June 2026. How deep can the pullback go before the stock enters the next bullish phase?

Astera Labs is a semiconductor company that builds high-speed connectivity chips and software for AI and cloud data centers. Its products help CPUs, GPUs, memory, and networks communicate faster and more efficiently, making large AI systems and data centers perform better. Founded in 2017 and headquartered in San Jose, California, Astera Labs is a key beneficiary of the growing demand for AI infrastructure.

ALAB Elliott Wave Analysis - Daily Chart

The stock launched its IPO on 19th March 2024 at $36 per share. It got listed on 20th March 2024 with a ticker ALAB (NASDAQ) and immediately traded at $50.6 before jumping to $95.2 about a month after. However, from that top it dropped gradually in nearly 5-month period hit it's lowest price of $36.2. From that low, it never looked back. Thus, the Elliott wave forecast in this post starts from the low of August 2024.

ALAB-Daily-120260629005547-1024x500.jpg


ALAB started the first bullish cycle from the all-time low to $147 on 6th January 2025 where it completed wave ((1)). Wave ((1)) completed a clear impulse wave structure. From the top of ((1)), wave ((2)) began and completed a double zigzag structure at the low of $47 on 4th April 2025. From the 4th April 2025 low, the 3rd swing started and completed an impulse wave structure on 18th September 2025 at $244 before the 4th swing followed with a double zigzag structure that ended on 30th March 2026.

However, the 4th swing entered into the territory of the 1st swing. Thus, it can't be the 4th wave of a larger degree impulse eave structure. As a result, we can consider a nest of ((1))-((2))-(1)-(2) leading to a strong impulse wave sequence in the primary degree. Wave (2) of ((3)) ended at 97.89. From the early looks, it appears wave ((3)) will be extended. One of the guidelines of the Elliott wave theory is that one of the 1st, 3rd or 5th wave of an impulse structure will be extended.

The biggest surge since inception followed and reached a record high of $421. This surge could be wave (3) as it's strong and fast. Thus, the pullback emerging can easily be wave (4) of ((3)). By Fibonacci projection, wave (4) could extend to 309.87-269.30 before the next bullish phase begins. Thus, at the extreme of wave (4) buyers will have find trade opportunities again.

ALAB Elliott Wave Analysis - Daily Chart - ALTERNATIVE COUNT

ALAB


In case the pullbacks gets very deep below $269, the above chart shows the alternative. This means, the nesting will extend to the minor degree. Thus, the current pullback will be wave 2 of (3) of ((3)). This scenario suggests a more extended waves ((3)) and (3) than the first count. However, the implications are similar for both count. Buyers should focus on the pullback from June 22, 2026 top and buy at the extreme if it completes a 3, 7 or 11 swing structure.

Source: https://elliottwave-forecast.com/st...trend-remains-intact-amid-corrective-retreat/
 
CBA-ASX, Commonwealth Bank of Australia (ASX: CBA) is extending the bearish cycle from June 2025 high. it could be eyeing the blue box where it becomes attractive to buyers again.

Commonwealth Bank of Australia (ASX: CBA) is Australia's largest bank and one of the country's most valuable publicly listed companies. Founded in 1911 and headquartered in Sydney, the bank provides retail, business, institutional, and wealth management services to millions of customers across Australia and New Zealand.

CBA-ASX is widely recognized for its strong market position, digital banking leadership, and consistent profitability. Its core businesses include home lending, deposits, business banking, credit cards, payments, and institutional banking, making it a cornerstone of Australia's financial sector.

CBA-ASX Elliott Wave Analysis - Weekly Chart

CBA has been in an all-time bullish cycle since its launch in September 1991. It completed wave I of the cycle degree in November 2007. Afterwards, a wave II pullback followed to the lows of January 2009. From the lows of January 2009, an impulse wave structure emerged to complete wave ((1)) of III in March 2015 before a simple zigzag corrected it in wave ((2)). Wave ((2)) finished in March 2020. From the low of March 2020, a strong impulse wave sequence emerged for wave ((3)) to a fresh record high as the weekly chart below shows.

cba-asx


The chart above shows shows the clear sub-waves of wave ((3)). Having established a bullish sequence, buyers will focus on finding entries from the dips. Thus, wave ((4)) pullback would be a very good opportunity for long term buyers to position again. As the chart above shows, the wave ((4)) pullback is emerging as a double zigzag structure. The completion of the wave (X) connector helps us to identify the blue box zone at 140.31-112.35. Going forward - either wave ((4)) extends deeper into the blue box to trigger long positions or breaks higher without reaching for the wave (W) low. If the latter happens, we can identify end of wave ((4)) at the current (W) low. Thus, we can expect wave ((5)) at 202-219 at least.

If the double zigzag emerges lower as expected, traders can consider this trade idea from the blue box.

Long at 140.3

Stop at 111.4

Target 219
Source: https://elliottwave-forecast.com/stock-market/cba-asx-eyes-blue-box-to-return-higher/
 
The Global X Uranium ETF (URA) provides broad access to companies involved in uranium mining and the production of nuclear components. It serves as a strategic instrument for investors seeking exposure to the accelerating nuclear energy transition. Beyond its role as a sector proxy, URA reflects the growing importance of uranium in global energy policy, where decarbonization and energy security are driving renewed demand for nuclear power.

In this discussion, we turn to Elliott Wave analysis to evaluate the ETF’s long‑term technical structure. By examining its larger degree cycles and internal subdivisions, we aim to highlight the potential trajectory of uranium equities within the broader commodity supercycle. This perspective not only frames the ETF’s historical context but also identifies key inflection zones where investors may anticipate renewed momentum.

URA Elliott Wave Chart Monthly Chart​

URA20260629115158.jpg


The monthly Elliott Wave chart of the Uranium Miners ETF (URA) shows that Grand Super Cycle wave ((II)) concluded at $6.95, establishing a long‑term base. From this low, the ETF initiated a new bullish cycle within wave ((III)), unfolding as a five‑wave impulse.

Advancing from wave ((II)), wave I terminated at $31.60. A corrective decline in wave II followed which bottomed at $17.65. The ETF then resumed higher within wave III. The internal subdivision is also an impulse: wave ((1)) ended at $33.66, while wave ((2)) completed at $19.50. From there, URA nested higher within wave ((3)), with wave (1) of ((3)) reaching $62.28.

As long as price remains above $6.95, corrective pullbacks are expected to attract buyers in 3 or 7 swing sequences. It sets the stage for further upside in alignment with the larger bullish cycle.

URA Daily Elliott Wave Chart​


URA-Daily20260629115843.jpg


The daily chart of the Uranium ETF indicates that the rally from the wave ((2)) low on April 7, 2025 culminated in wave (1) at $62.28, forming a five‑wave diagonal. The subsequent pullback in wave (2) is unfolding as a seven‑swing corrective structure, commonly identified as a double three.

From the peak of wave (1), wave W concluded at $44.76. A rebound in wave X followed which reached $59.97. Wave Y is now in progress to complete wave (2). It has a 100%–161.8% Fibonacci extension target zone of $30.71 - $41.49 (the blue box area). This region should attract buyers, providing the foundation for renewed upside.

Source: https://elliottwave-forecast.com/stock-market/uranium-miners-etf-ura-near-support-at-37-41/
 
Palantir (PLTR) will likely post another strong quarter, supported by rapid U.S. commercial growth and expanding AIP adoption. Moreover, analysts expect higher revenue near $1.80B and EPS near $0.33, which signals continued momentum.

Additionally, demand still exceeds capacity, so management may highlight scaling challenges and rising costs. Even so, guidance trends remain bullish, suggesting sustained growth and improving profitability through the next quarter.

Elliott Wave Outlook: PLTR Daily Chart Analysis March 09, 2026

Elliott Wave Outlook: PLTR Daily Chart Analysis March 09, 2026


In March 2026, we saw the impulse finish inside the projected zone with both waves (III) and (V) extending. Moreover, wave IV retraced deeply yet still respected all Elliott Wave rules, which kept the structure valid despite its sharp form.

At that time, we believed a Grand Super Cycle had completed after the strong decline. Furthermore, the retracement looked sufficient to suggest the correction might be done, even though downside risk remained. If price broke 126.23, we expected buyers to appear inside the $104–$80 zone to complete wave ((II)) pullback.

Elliott Wave Principle Behind the Market Structure​

Impulse

An impulse is a clean 5‑wave pattern that drives the trend forward.

  • Waves 1‑3‑5 are strong and directional.
  • No overlap between waves 1 and 4.
  • Wave 3 is usually the strongest.
  • Structure is clear, with increasing momentum.

Impulse

Wave Extensions


Extensions occur when one impulsive wave becomes significantly longer and more powerful than the others.

Most commonly, wave 3 extends, creating the longest and most explosive leg.
An extended wave subdivides into a clear, elongated 5‑wave pattern.
The other two impulsive waves remain shorter and more proportional.
Extensions highlight where the market’s strongest momentum is concentrated.

Wave Extensions


Elliott Wave Outlook: PLTR Daily Chart Analysis June 27, 2026

Elliott Wave Outlook: PLTR Daily Chart Analysis June 27, 2026


The new update shows the structure changed as the market moved lower in a leading diagonal ending wave (a). Moreover, we saw a three‑wave rebound that confirmed wave (b) because price broke below wave (a).

While price stays below wave (b), we expect more downside toward 77.96–25.02 to complete wave ((II)). Consequently, we anticipate that zone will finish the correction and allow the market to resume its bullish trend.

Source: https://elliottwave-forecast.com/stock-market/pltr-breaks-lower-key-support-rally-recharge/
 
Johnson & Johnson (JNJ) engages in research & development, manufacture & sale of range of products in the healthcare sector worldwide. It operates through Innovative Medicine & MedTech. It comes under Healthcare sector & trades as “JNJ” at NYSE.

The JNJ favors rally in ((5)) targeting $271.37 or higher to extend January-2025 rally expected before. It favors rally in (3) of ((5)) from blue box area. Short term pullback in 3, 7 or 11 swings remain supported in 9 swing impulse rally.

JNJ - Elliott Wave Latest Daily View:​

JNJ-D7.jpg

In weekly, it ended (I) impulse at $186.69 high in April-2022 & (II) correction at $140.68 low in January-2025. The pullback in (II) as choppy double three structure. Within (II), it ended w at $150.11 low, x at $175.97 high & y at $140.68 low. Above April-2025 low, it ended ((1)) of I at $169.99 high, ((2)) at $141.50 low, ((3)) at $251.71 high, ((4)) at $220.37 low & favors upside in ((5)). It is showing extended ((3)) sequence. In ((3)), it ended (1) at $159.44 high, (2) at $146.12 low, (3) at $215.19 high, (4) at $200.91 low & (5) at $251.71 high.

JNJ - Elliott Wave Daily View From 5.25.2026:​

JNJ-D4.jpg

Within ((4)), it ended (W) at $232.24 low (3.24.2026), (X) at $247.21 high (4.02.2026) & (Y) at $220.37 low (5.11.2026). It placed (1) at $232.13 high, (2) as flat at $220.84 low & favors (3) in five swings. Within (3), it placed 1 at $241.60 high, 2 at $227.50 low & favors 3 towards $261.1 – $269.1 area before 4 starts. It is trading in fifth swing & expect pullback to remain supported to continue higher. Buyers can buy intraday pullback in 4 or (4) for next leg higher. Once it breaks above $271.37, it can extend rally towards $305.3 in daily.

Source: https://elliottwave-forecast.com/stock-market/jnj-elliott-wave-bullish-rally-targets-271-37-beyond/
 

Parker-Hannifin Remains in a Strong Long-Term Bullish Elliott Wave Cycle​

Parker-Hannifin Corporation (NYSE: PH) continues to exhibit a strong bullish Elliott Wave structure on the monthly chart. Since completing a major blue wave II correction in 2020, the stock has maintained a powerful uptrend, confirming that the larger bullish cycle remains intact. The rally from the 2020 low has unfolded in a clear impulsive sequence and is currently progressing within blue wave (III). Within this larger wave, Parker-Hannifin completed red wave I, followed by a corrective red wave II, an extended red wave III, and a corrective red wave IV. The recent pullback labeled red wave IV now appears complete, and the latest price action suggests the stock has already resumed higher in red wave V, the final leg expected to complete the larger blue wave (III).

The completion of red wave IV keeps the long-term bullish outlook firmly intact. Instead of signaling a trend reversal, the recent pullback appears to have provided another buying opportunity within the ongoing impulsive cycle. With wave IV likely complete, the stock has entered red wave V, which should continue driving prices higher over the coming months. The current Elliott Wave structure suggests the broader trend remains healthy, with higher highs still expected before a larger corrective phase begins.

PH_2026-07-01_05-55-48-scaled.png

PH Elliott Wave Forecast and Price Targets

From an Elliott Wave perspective, we continue to favor the upside while price remains above the long-term invalidation level at 85.43. As long as this level holds, the current wave count remains valid, and we do not recommend selling into strength. Using the Fibonacci external retracement levels of wave IV, the first upside objective for wave V comes in at 1,086.48, representing the 1.236 external retracement. If bullish momentum remains strong, the rally could extend toward 1,170.54, the 1.618 external retracement of wave IV. This target zone is where we expect the larger blue wave (III) to complete.

Once blue wave (III) finishes, Parker-Hannifin should enter a larger degree blue wave (IV) correction before resuming its long-term advance in blue wave (V). Until then, we continue to favor buying pullbacks in 3, 7, or 11 swings, which often provide high-probability opportunities to join the prevailing trend.

Conclusion​

Parker-Hannifin remains in a strong long-term bullish Elliott Wave cycle, with red wave IV likely complete and wave V already underway. As long as price stays above 85.43, we expect the current advance to continue toward 1,086.48 and potentially 1,170.54, where the larger blue wave (III) is projected to complete before the next corrective phase begins.

Source: https://elliottwave-forecast.com/stock-market/parker-hannifin-wave-v-targets-1086-1170/
 
Datadog (NASDAQ: DDOG) continues to display a strong bullish Elliott Wave structure after completing a lengthy corrective phase that lasted from late 2021 into early 2026. Following its all-time high, the stock entered a complex W-X-Y corrective pattern, eventually completing wave II near the 98.01 invalidation level. The strong reaction from that area confirmed the end of the correction and signaled the beginning of a new impulsive cycle. Since the February 2026 low, Datadog has rallied sharply, producing a clear impulsive five-wave structure at lower degrees. The recent advance confirms that wave III is in progress, which is typically the strongest and most dynamic phase of an Elliott Wave sequence.

The chart indicates that wave (3) has already completed after a strong vertical advance. More importantly, the recent pullback has also completed wave (4), holding well above the wave (1) peak and respecting Elliott Wave rules. The stock has now turned higher again, suggesting wave (5) is already underway. This recovery reinforces the bullish outlook and indicates buyers continue to control the larger trend. As long as the price remains above the 98.01 invalidation level, the preferred count continues to favor higher prices.

DDOG_2026-07-01_06-42-29-scaled.png


Wave (5) Outlook and Long-Term Targets​

We are currently trading around the 100% Fibonacci extension of wave I at 268.12, suggesting that black wave ((1)) is becoming mature. However, the internal Elliott Wave structure still appears incomplete, indicating there could be one final push higher within wave (5) before black wave ((1)) finishes. A break above 278.71 would provide additional confirmation that wave ((1)) has completed. Once that happens, we expect a corrective pullback in black wave ((2)), which should unfold in 3, 7, or 11 swings and offer another buying opportunity for investors. After wave ((2)) completes, the larger bullish trend is expected to resume, targeting at least the 1.618 Fibonacci extension of wave I near 373.56, with the potential for further upside as the higher-degree impulsive sequence continues to unfold.

Summary

Datadog has completed both its larger wave II correction and the recent wave (4) pullback, confirming that wave (5) is now in progress. The stock remains firmly bullish while holding above 98.01, with upside targets at 268.12 and potentially 373.56 over the longer term. Any corrective pullbacks after wave ((1)) completes should continue to attract buyers within the ongoing bullish trend.

Source: https://elliottwave-forecast.com/st...elliott-wave-analysis-wave-5-targets-278-373/