Most Elliott Wave Practitioners think that 5 wave move off a high / low provides them with a Trading Edge as according to Elliott Wave Theory, a 5 wave move should be followed by 3 waves back and another 5 wave move in the direction of the first 5 wave move. Experience has taught us that many a times, 5 wave moves can turn out to be part of an Elliott Wave FLAT which is a 3-3-5 structure and if so, representing the end of a corrective cycle rather than start of a new cycle and hence setting a trap for the traders. Therefore, we at Elliottwave-Forecast rely more on Swing Sequences than 5 wave moves to look for our “Trading Edge”.
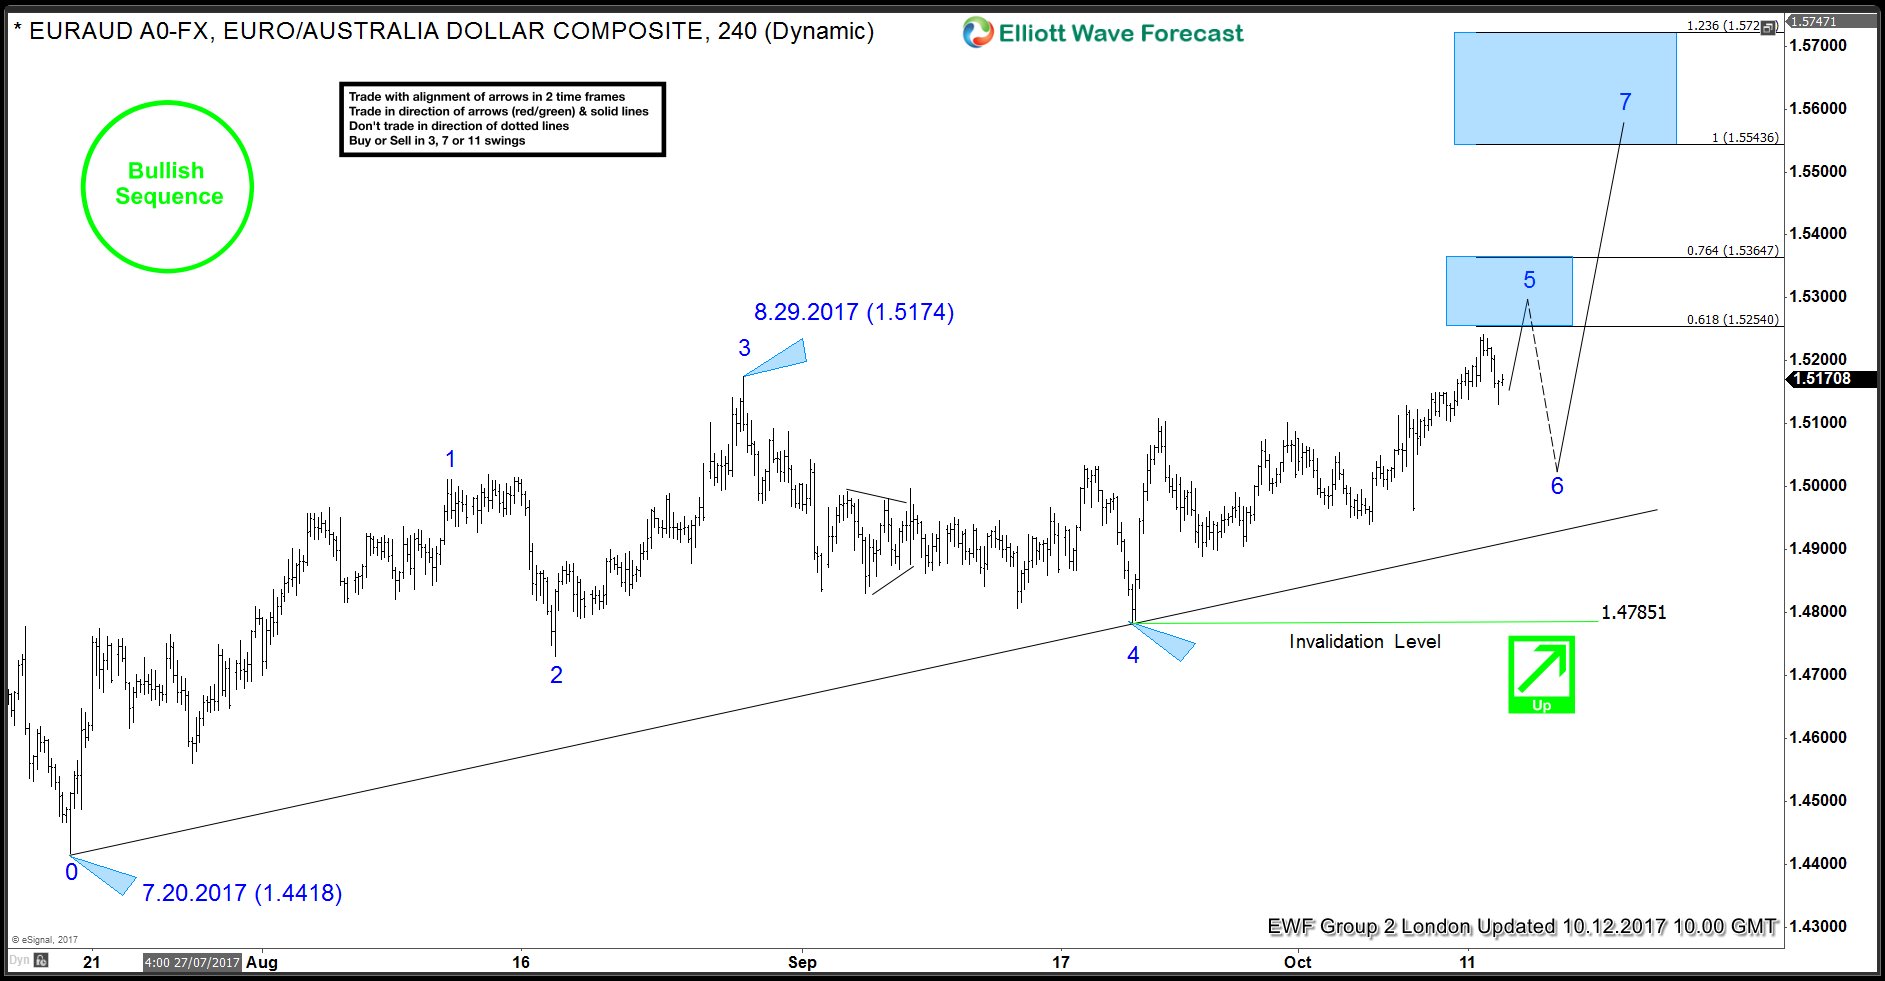
Markets move in either Impulsive Sequences or Corrective Sequences. 5,9,13,17 and so on is an impulsive sequence whereas 3,7,11,15 and so on is a corrective sequence. We believe every Elliott wave practitioner in particular and trader in general should understand the swing sequences to get a better accuracy in their forecasts and avoid getting into traps which are often laid out by the market. As we know that 7 is a corrective sequence so if we see 5 swings up with biggest correction in the middle (which is too big to be wave 4 of an impulse), then we know the sequence is incomplete and it presents a “Trading Edge” to buy the 6th swing pull back to trade the 7th swing higher. Below, we will present an example of EURAUD forex pair showing 5 swings sequence up from 7/19 (1.4418) low suggesting the sequence is bullish against 9/20 (1.4785) low and 6th swing pull back should represent a buy opportunity in 3, 7 or 11 swings with a target of 1.5543 – 1.5722 area.
EURAUD 5 swings sequence provides a “Trading Edge”
We understand that not all traders are able to identify these incomplete sequences which provide a “Trading Edge” to traders, so when ever we spot an Incomplete swings sequence on our charts, we put a Bullish Sequence or Bearish Sequence stamp on the chart for our clients to know they should be looking to buy or sell that particular instrument in 3, 7 or 11 swings. Not every instrument has a Bullish or Bearish sequence all the time but we cover 78 instruments in total so there are always some showing Bullish or Bearish swings sequence in different time frames.
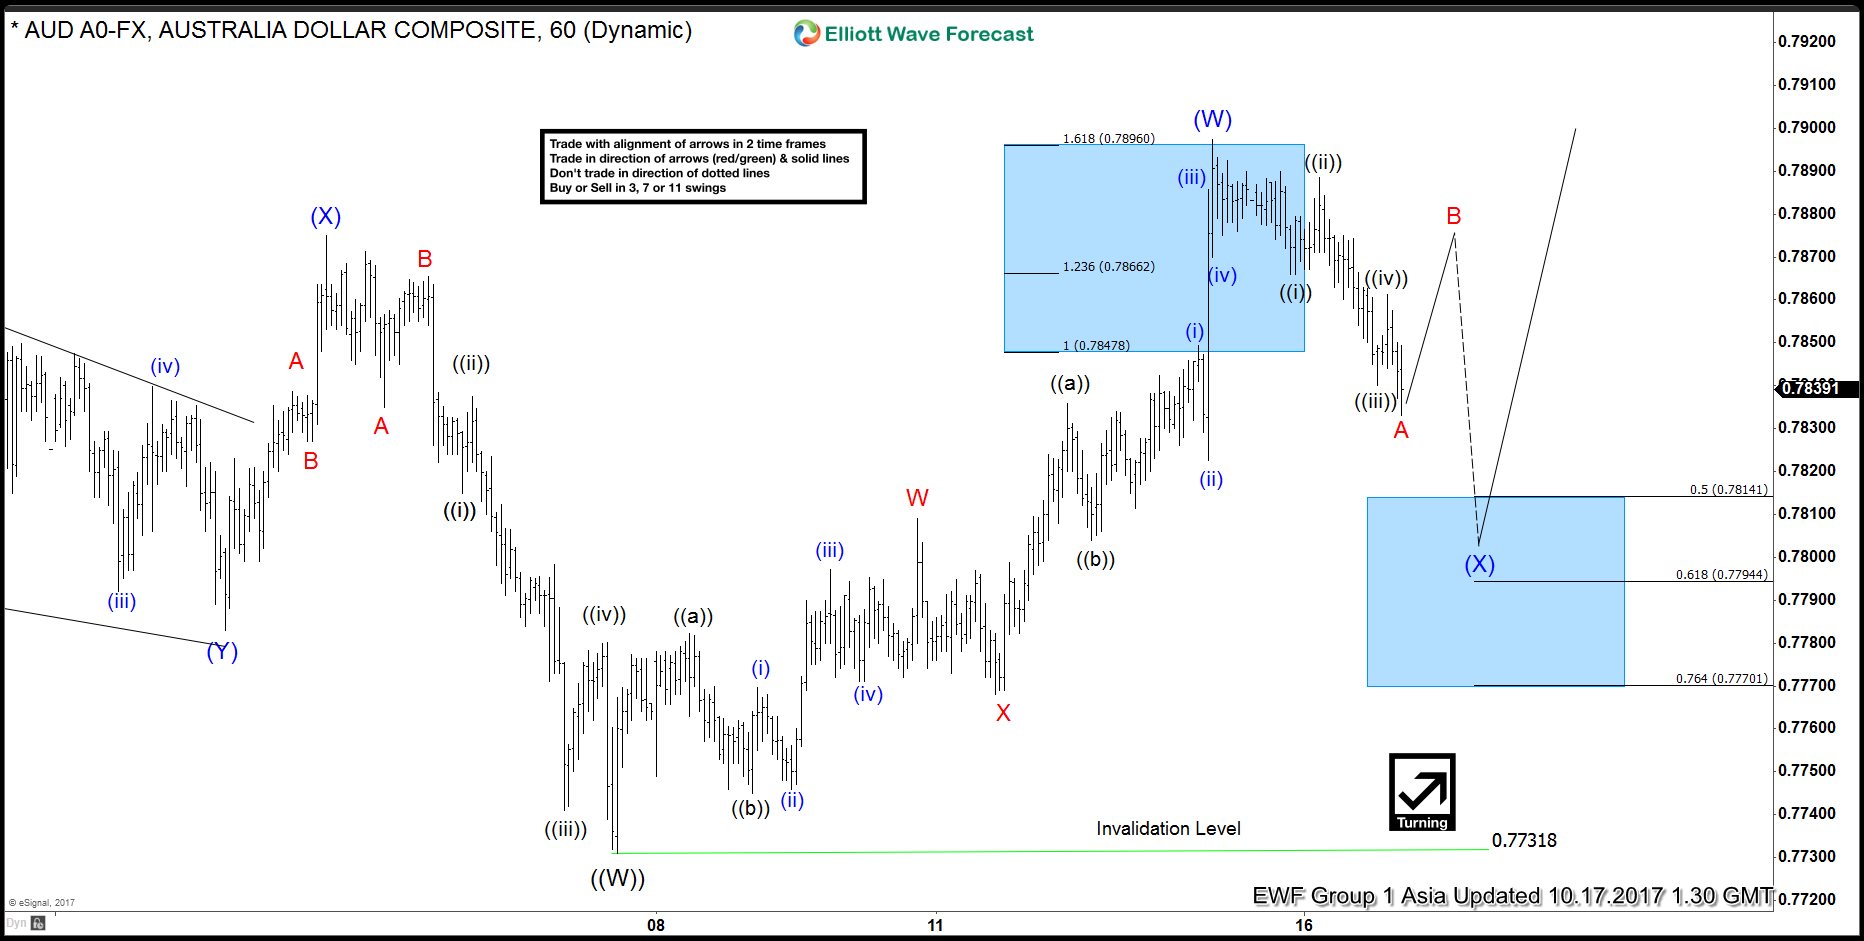
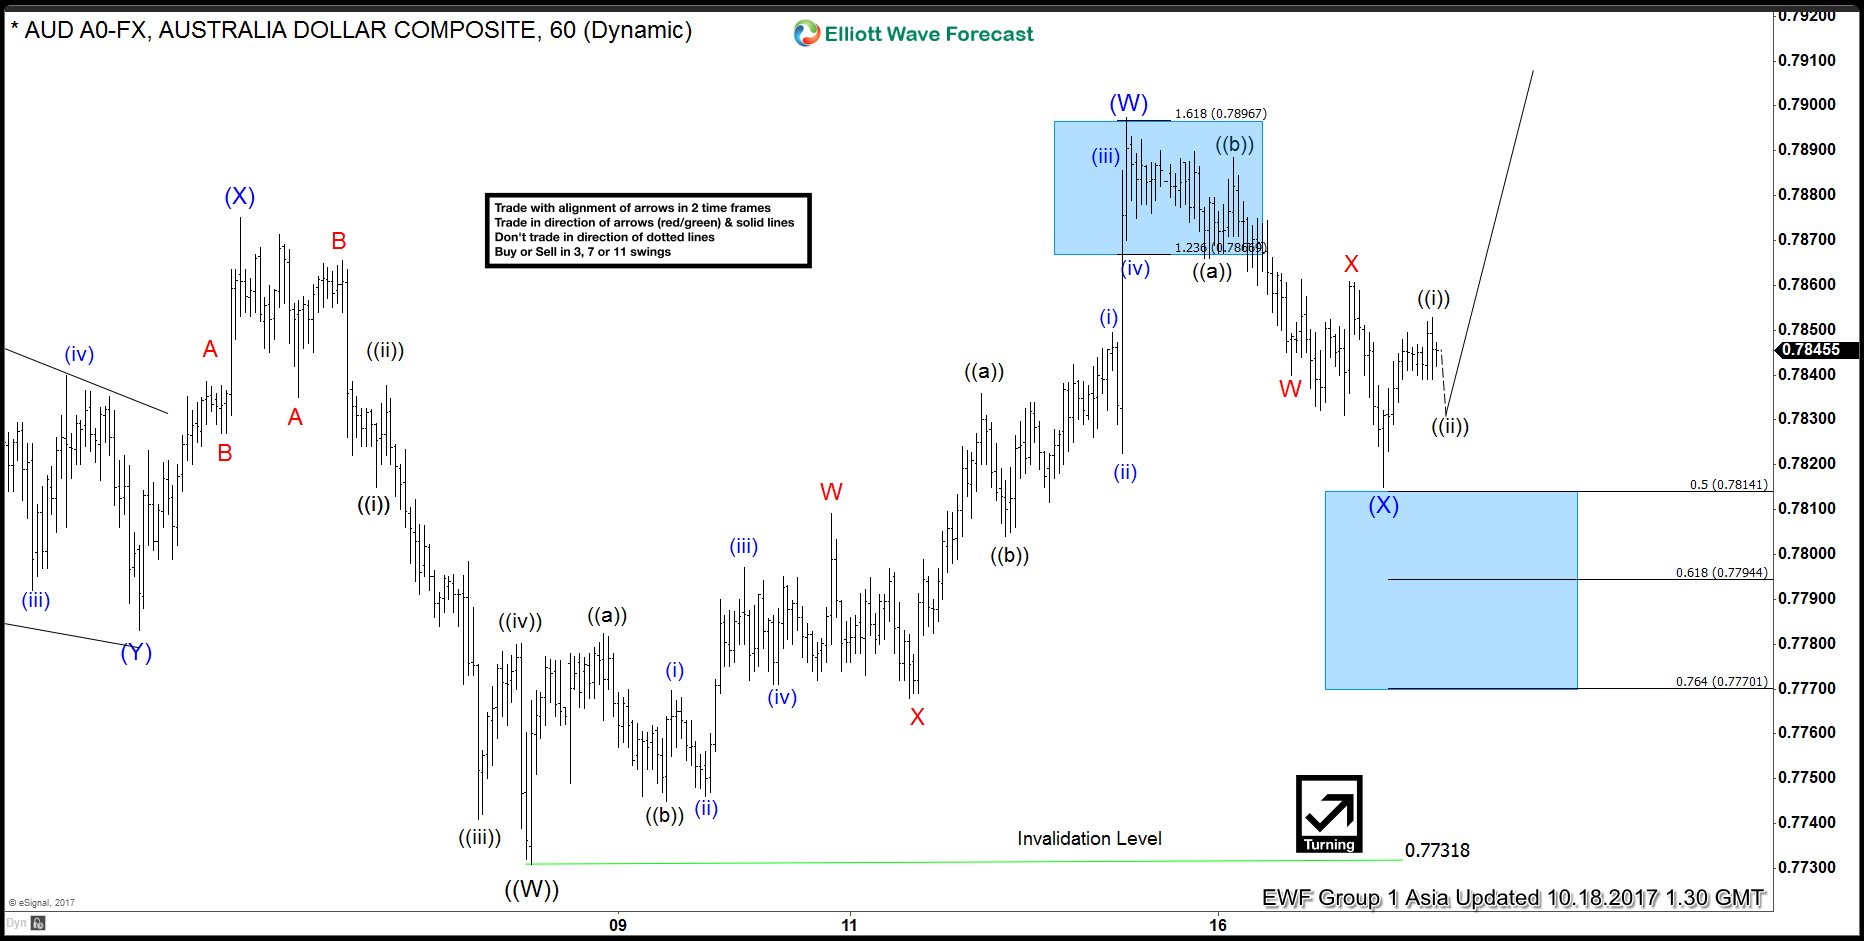
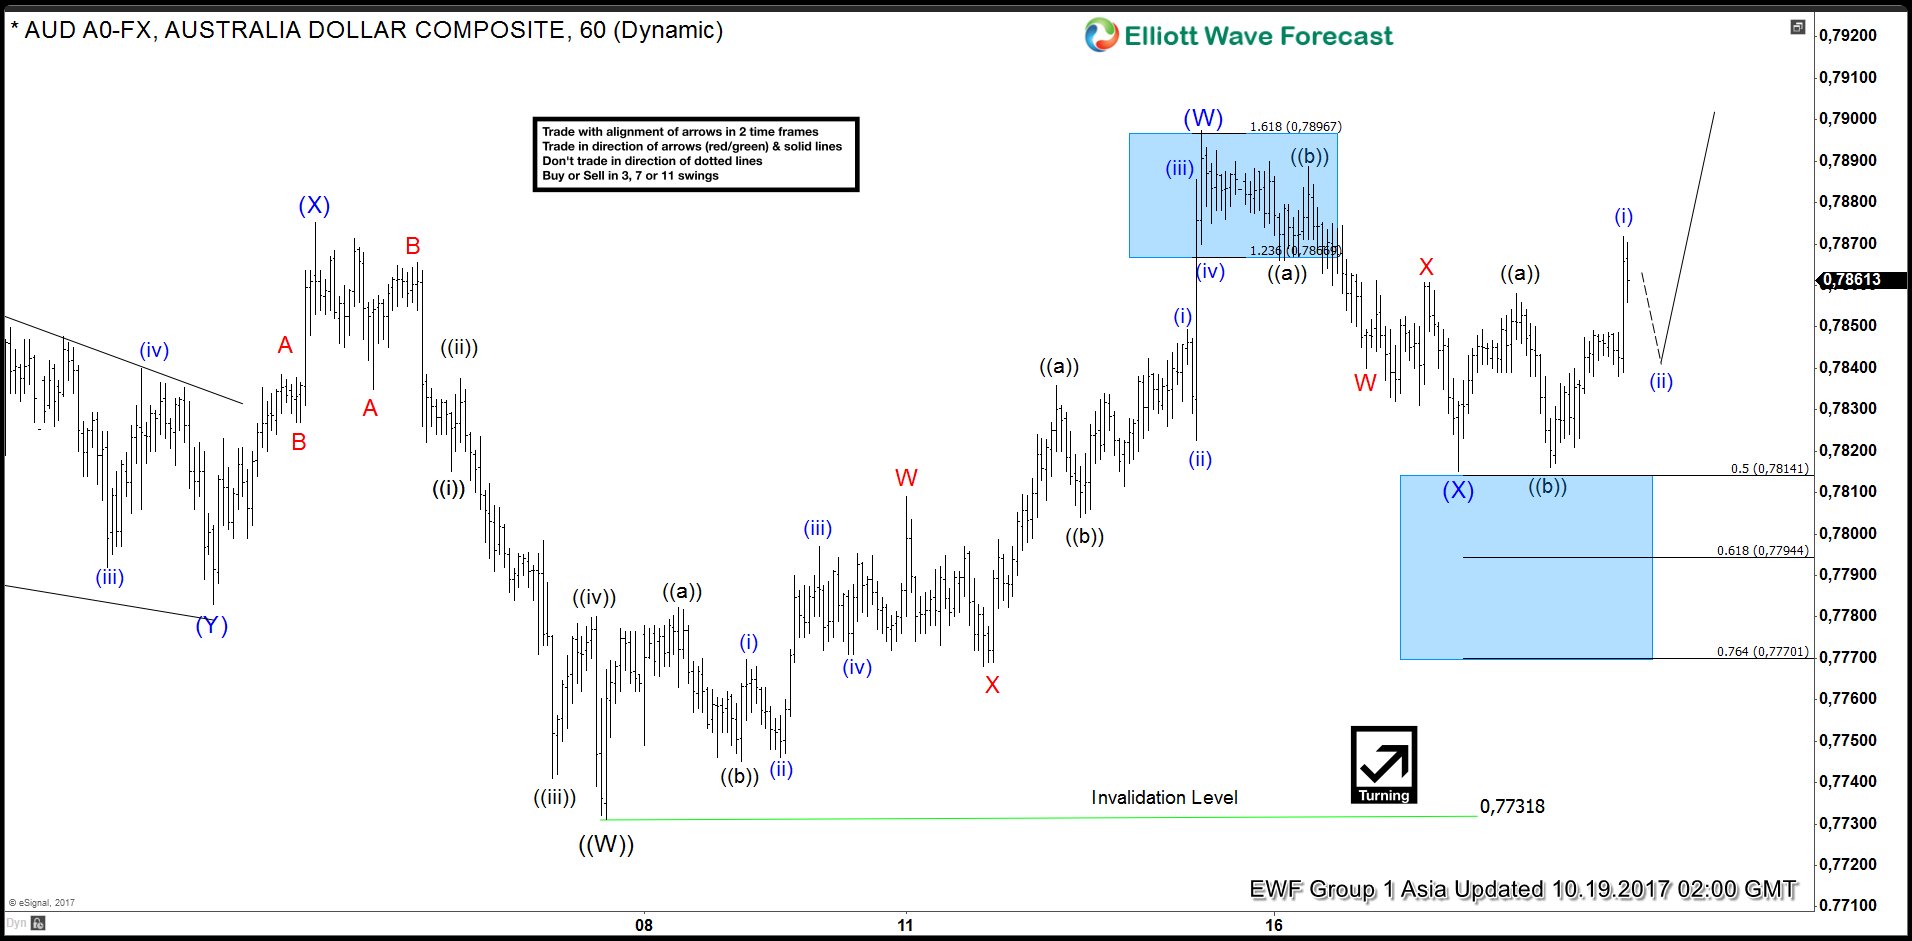
AUDUSD Short term Elliott Wave analysis suggests decline to 0.7731 ended Primary wave ((W)) on 10/6 low. Bounce in Primary wave ((X)) is proposed to be unfolding as a double three Elliott Wave structure. Intermediate wave (W) of ((X)) ended at 0.7897 and Intermediate wave (X) of ((X)) pullback is in progress as a zigzag Elliott Wave structure. Down from 0.7897 high, Minor wave A is proposed complete at 0.7832. While Minor wave B bounce stays below 0.7897, pair should turn lower in Minor wave C of (X) to correct cycle from 10/6 low. Afterwards, as far as pivot at 10/6 low (0.7731) stays intact, expect pair to resume higher.
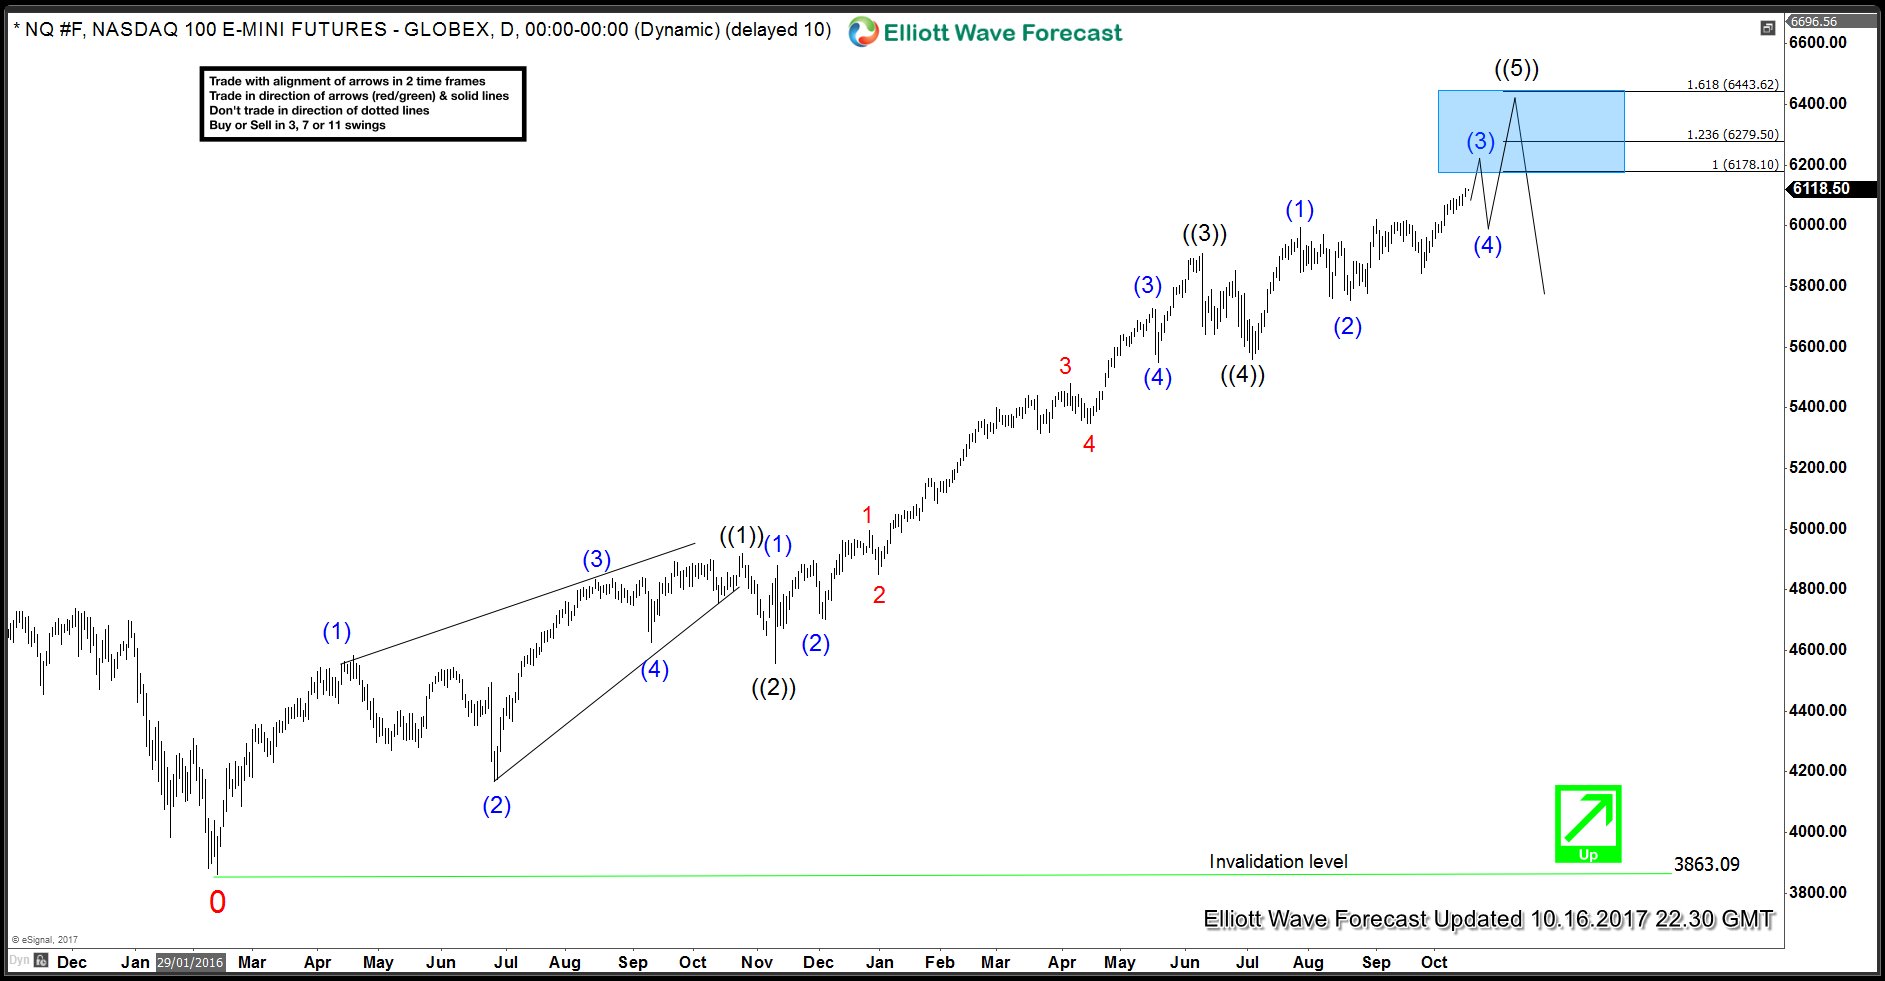
NASDAQ Futures rally from 2.11.2016 low is unfolding as an Elliott Wave Impulse as we can clearly see three channels in price and momentum (RSI) to support this idea. Wave ((1)) ended at 4919.50 as a diagonal, wave ((2)) ended at 4558.50,wave ((3)) completed at 5907.50 and dip to 5560 completed wave ((4)) on 7.5.2017. Up from there, so far we can only see three swings up and as wave ((5)) can’t be in 3 swings, we expect to see more upside in NASDAQ Futures to complete wave ((5)) which should also end the cycle from 2.11.2016 low. Near-term focus is on 6178 – 6279 area to complete wave (3) of ((5)) before we get a pull back in wave (4) to correct the cycle from 8.21.2017 (5752) low and higher again towards 6443 – 6604 area to complete wave ((5)).
Wave (3) of diagonal wave ((5)) is proposed to be unfolding as a double three WXY structure where wave W ended at 6019.75 and wave X ended at 5842. Index has already reached 100% extension of W-X at 6108 but has not yet reached 100% extension up from red X low so while dips stay above 10.10.2017 (6039), expect NADSAQ Futures to extend higher towards 6178 – 6279 area to complete wave (3). Break below 10.10.2017 (6039) low would suggest cycle from 5842 low ended and would favor the view that wave (3) also ended and NASDAQ Futures are already in wave (4) pull back to correct the cycle from 8.21.2017 low. Index has already reached 100% extension of W-X so we don’t like chasing strength here and don’t even like selling the Index. We see wave (4) dips when seen to offer the next ideal buying opportunity in 3, 7 or 11 swings.
AUDUSD Elliott Wave structure suggests that the decline to 0.7731 on October 6th low ended Primary wave ((W)). From there, Primary wave ((X)) bounce is unfolding as a double three Elliott Wave structure. Rally to 0.7807 ended Intermediate wave (W) of ((X)) and pullback to 0.7815 ended Intermediate wave (X) of ((X)). A break above Intermediate wave (W) at 0.7815 will give more validity to this view. Until then, a double correction in Intermediate wave ((X)) is still possible. Near term, while pullbacks stay above 0.7815, but more importantly above 10/6 low at 0.7731, expect pair to extend higher.
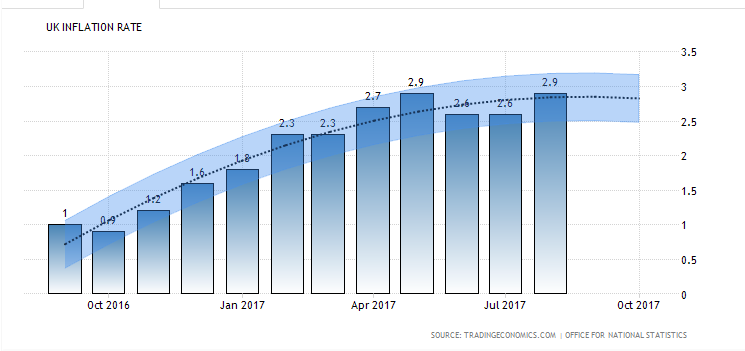
In the aftermath of Brexit vote, Bank of England (BOE) had cut the cost of borrowing to a new record low of 0.25% in order to support the economy. At the same time, Poundsterling slumped against other major currencies due to the economic uncertainty. Sterling is currently worth 14% less against the Euro and 10% less against the US dollar than before the vote. However, due to the UK’s reliance on imports, the weak Poundsterling increased the cost of importing food, fuel, and raw materials. As a result, living standards are increasingly squeezed and the UK now has the highest inflation rate among the G7 nations. In August, the UK inflation hit 2.9%, which was up from 2.6% in July. This number is almost 1% higher than the official 2% target. Below is the graph of UK inflation rate
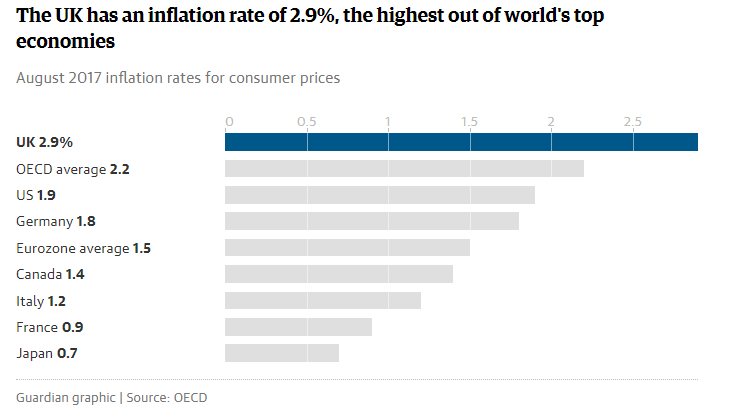
Among G7 countries, UK has the highest inflation rate. The rise in prices is also above the average of the Euro area and the G20 nations. Below is the comparison of UK inflation rate with other G7 countries and Eurozone average.
BOE signalling rise in rate in the “coming months”
The nine member MPC (Monetary Policy Committee) voted by a margin of 7-2 to keep rates on hold last month. However, they also made it clear that unless there’s a major deterioration in the economy, it would raise rate in the coming months. In the interview with BBC’s Radio 4 Today Programme below, Mark Carney, the Bank of England Governor, says interest rates will rise in the relatively near term.
BOE will meet two more times this year on November 2 and December 14. Expectations are high that the Bank will raise the benchmark rate in the coming November meeting. However, several prominent organizations and forecasting group, such as British Chambers of Commerce, ratings agency Standard & Poors, and EY Item Club have suggested the economic growth was not strong enough to warrant a rate hike. BOE’s rate decision could be based on the result of UK’s latest inflation figure for September which will be released tomorrow (Tuesday Oct 17). Economists predict that the CPI will have risen to 3% in September, the highest level since 2012. If the number comes out at the high end, the Central Bank may have no choice other than raising the rate.
Poundsterling Technical Charts
Technical charts on two Poundsterling pairs below suggest that we may see support for Poundsterling.
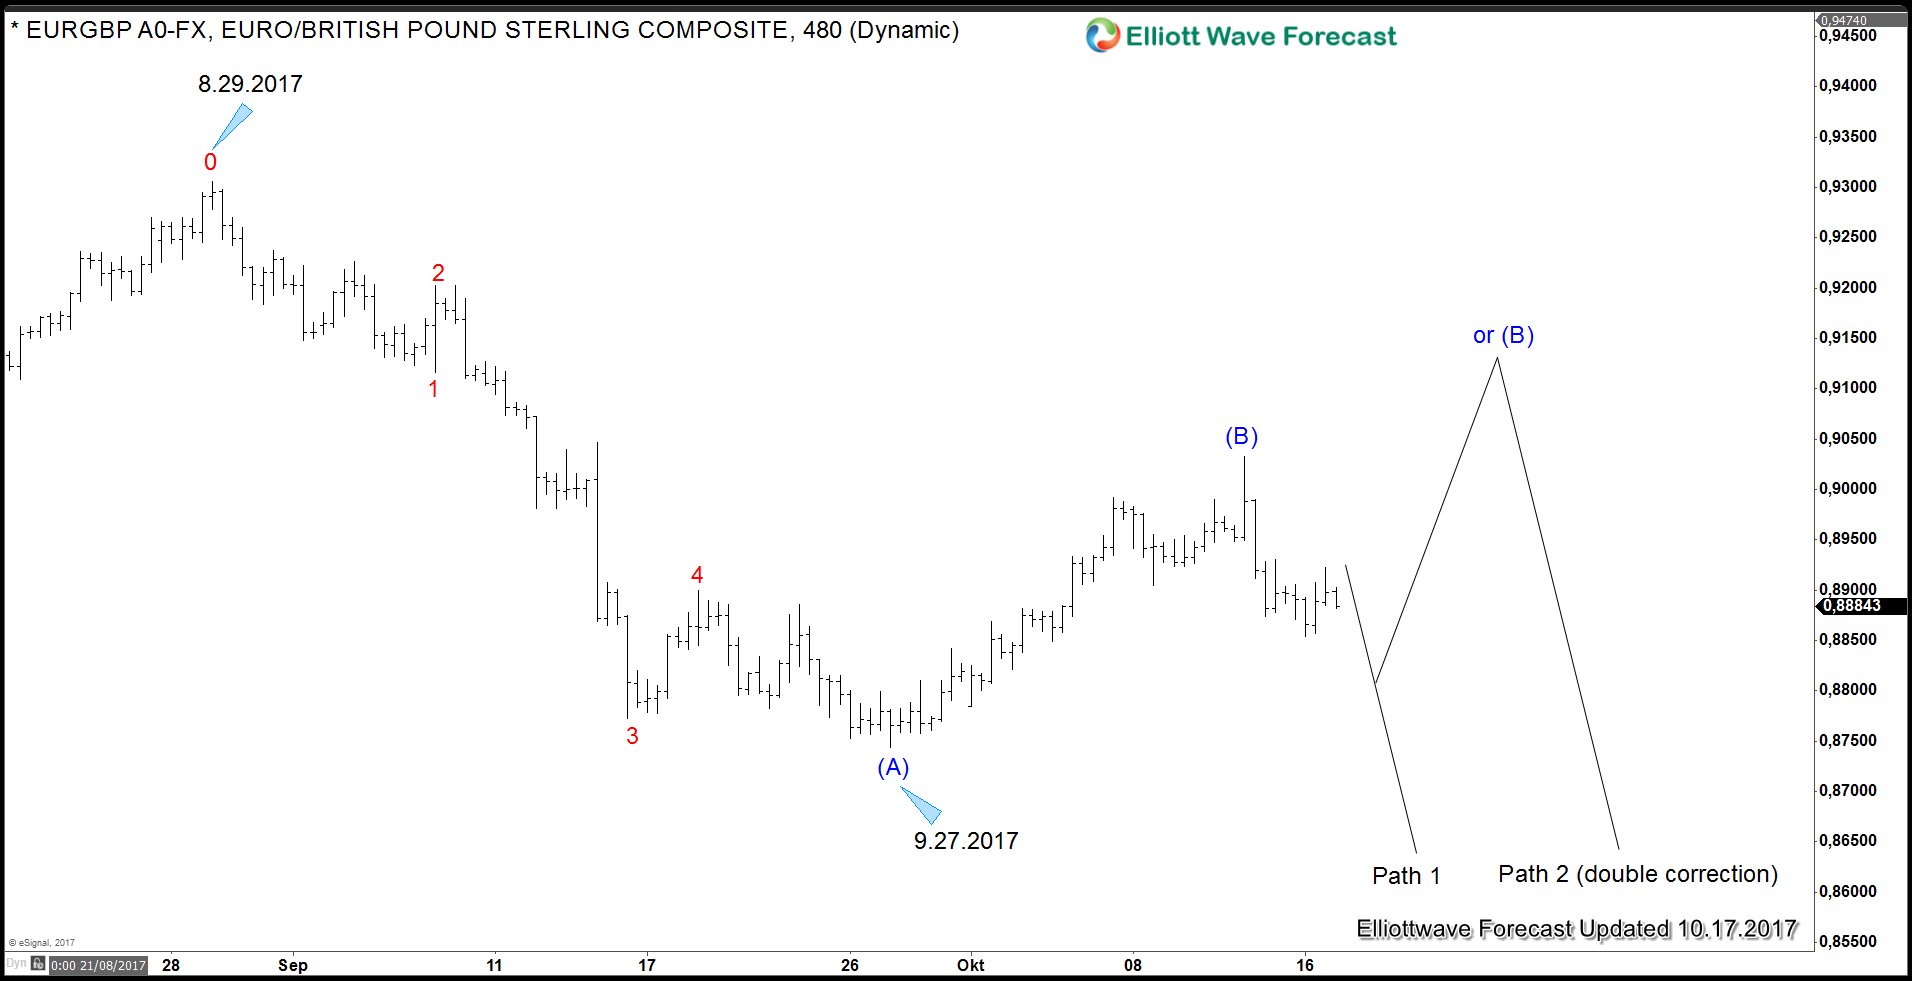
EURGBP 4 Hour Elliott Wave Chart
EURGBP looks to be declining in 5 waves from 8.29.2017 peak to 9.27.2017 low. If this is the right interpretation, then we could be looking for another 5 waves down which should be supportive of Poundsterling. Wave (B) can either be done (Path 1) in which case the pair should then resume to new low below wave (A). Alternatively, it can do a double correction in wave (B) and see another leg higher before the decline resumes. Either way, another leg lower is expected once wave (B) is complete
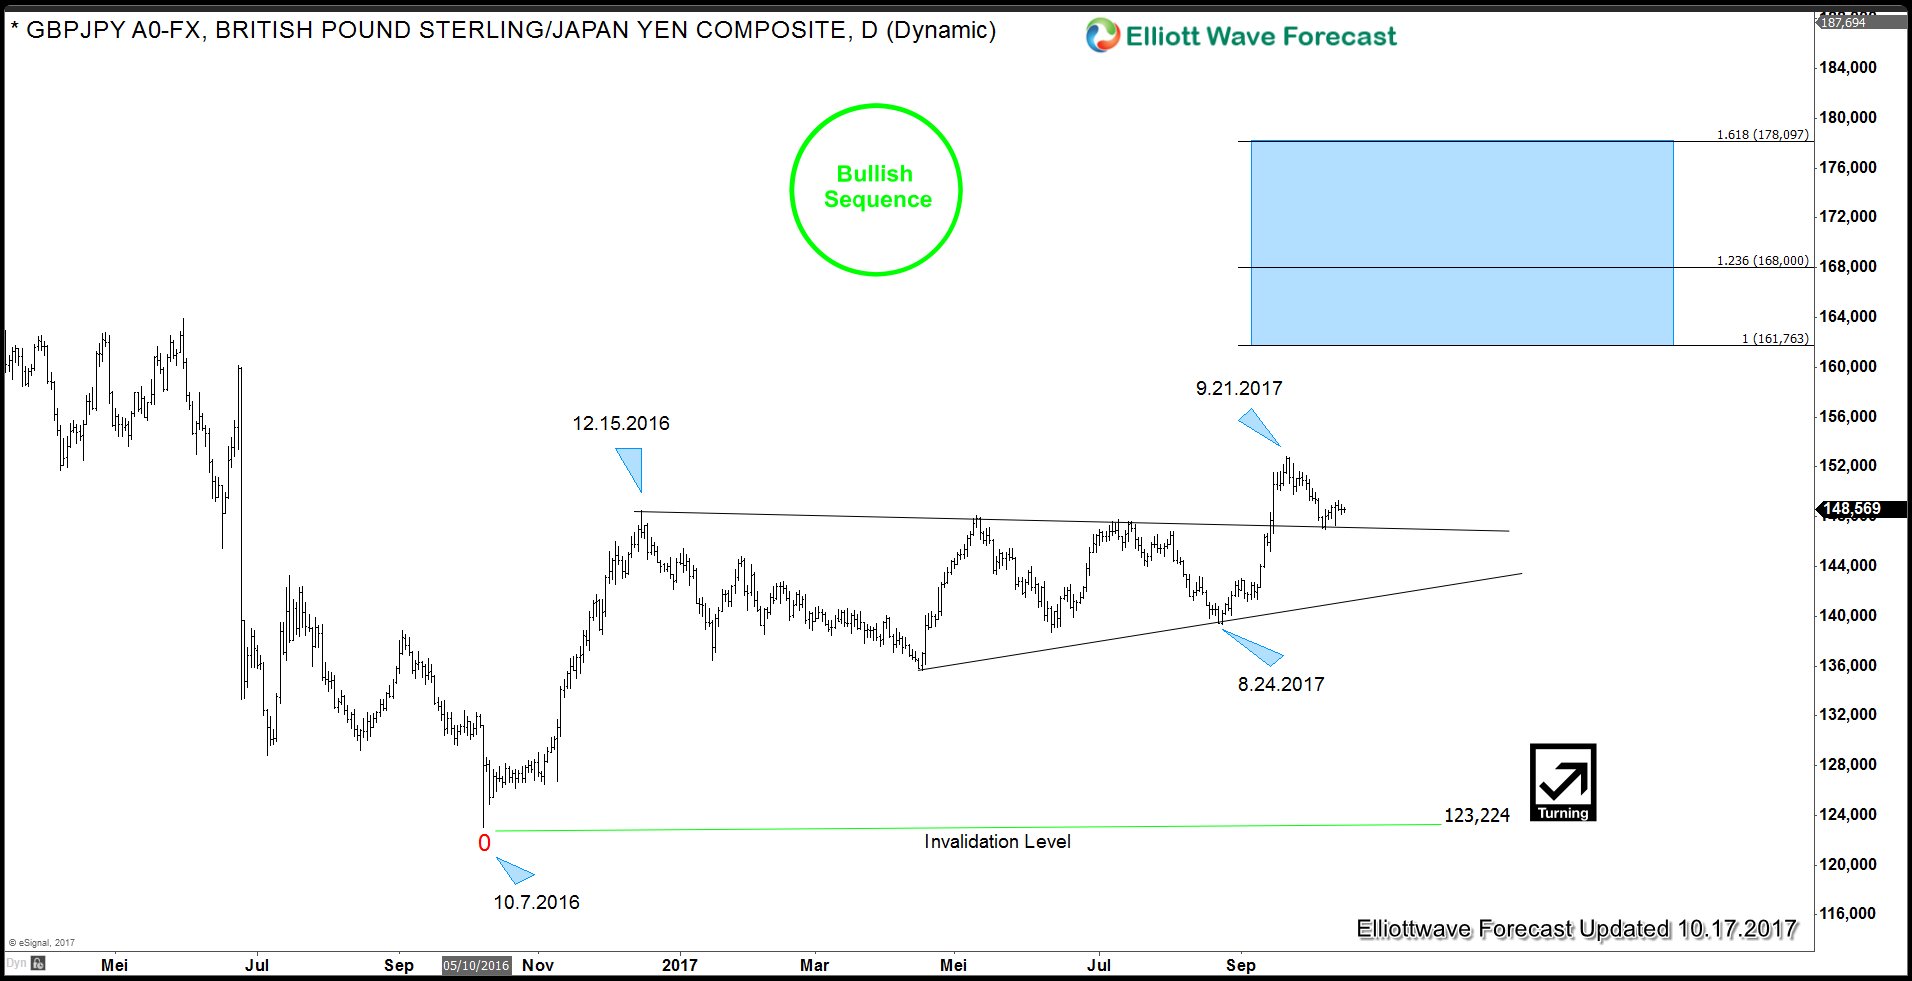
GBPJPY Daily Chart
GBPJPY Daily Chart above shows a bullish sequence from 10.7.2016 low as it creates a higher high sequence and the recent peak at 9.21.2017 broke above the previous high on 12.15.2016 high. The rally from 10.7.2016 low to 12.15.2016 high looks impulsive and can be considered as such. We then see a 9 month sideways consolidation from 12.15.2016 to 8.24.2017. The pair then started a new leg higher and made recent peak at 9.21.2017. It has corrected and retested the upper end of the consolidation channel. The rally from 8.24.2017 to 9.21.2017 also looks like an impulse. From the overall structure, it looks like GBPJPY is bullish and can continue higher to 161.76 – 168 area as far as it remains above 8.24.2017 low.
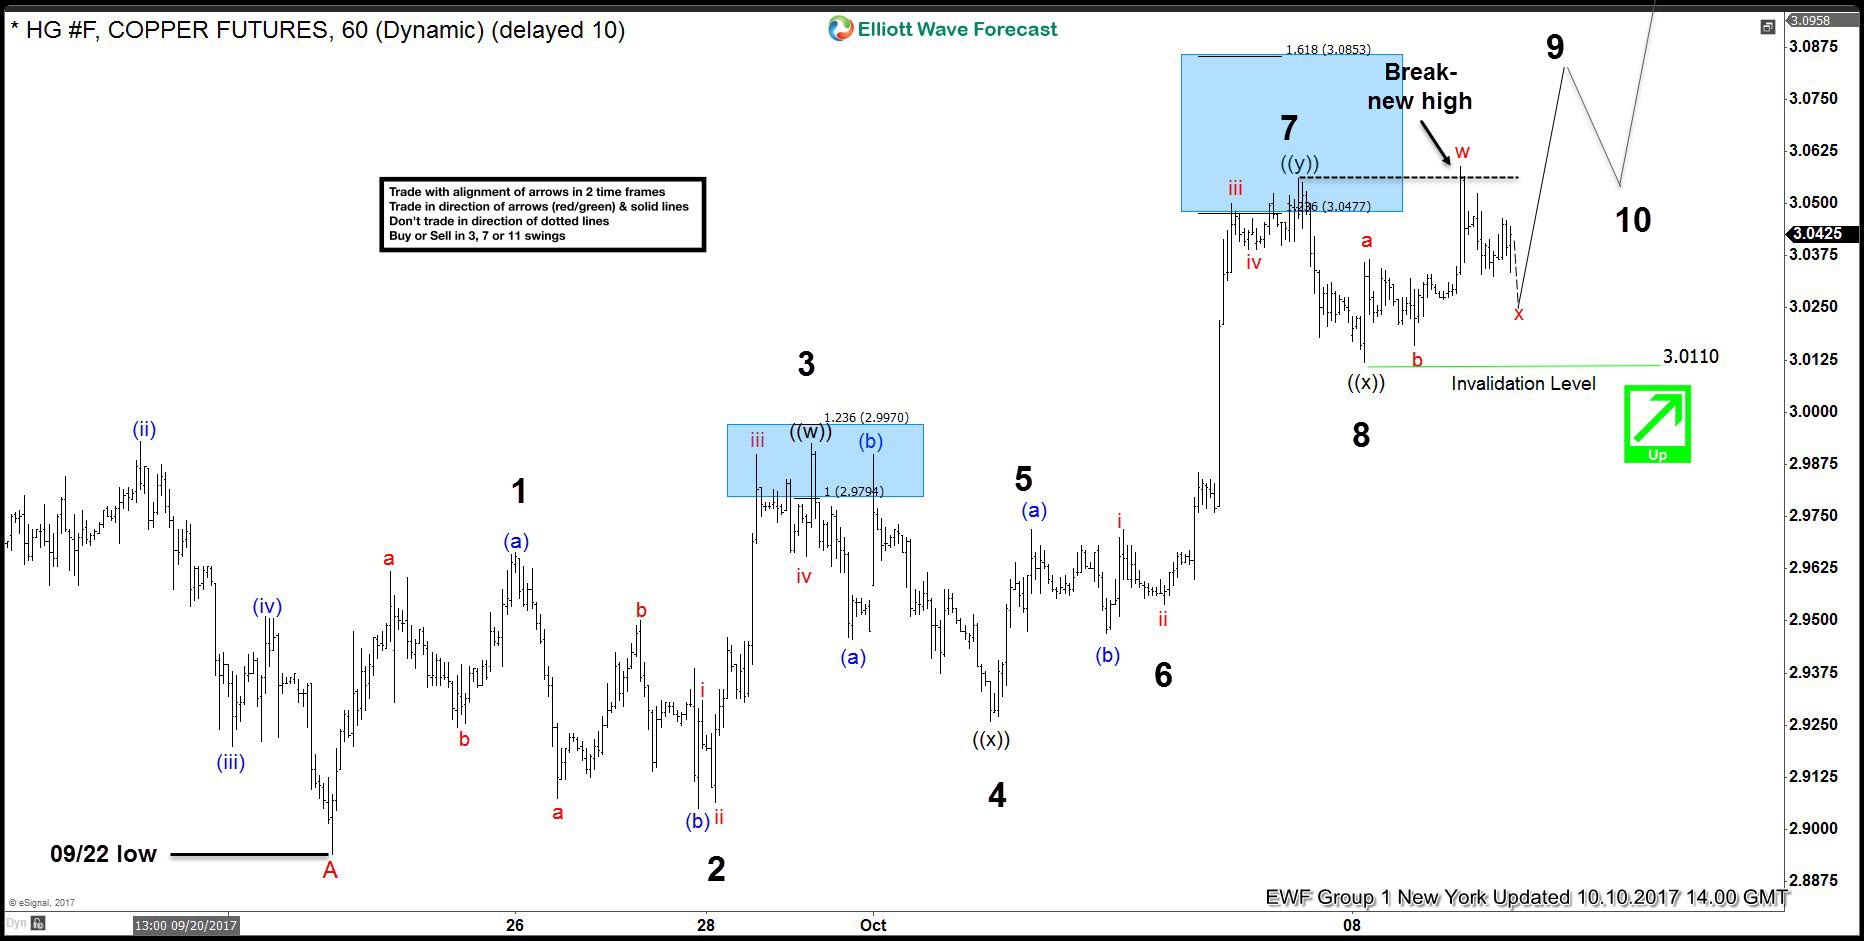
Hello fellow traders. In this technical blog we’re going to take a quick look at the past Elliott Wave charts of Copper published in members area of elliottwave-forecast. In further text we’re going to count the swings, explain the short term Elliott Wave view.
Copper Elliott Wave 1 Hour Chart 10.10.2017
As our members know, Copper has had incomplete bullish sequences in larger time frames targeting 3.363 area. Consequently, we advised members to avoid selling and keep buying the dips in 3,7,11 swings. On 9th October Copper has made new short term high that made sequences bullish in the short term cycle as well. With new high we assumed that 9th swing is in progress. That means short term cycle from the 09/22 low is also having incomplete sequences . As of right now, 11th swings up are required to complete proposed cycle.
We’re labeling proposed cycle as a Triple Three structure. Second ((x)) connector is counted completed at 3.011 low and we’re about to complete short term x red pull back. As far as the mentioned level holds, we expect further rally.
Shortly after Copper found buyers , and make further separation from the 3.011 low, eventually breaking above 09/04 peak. Keep in mind market is very dynamic. If you’re interested in new Elliott Wave forecasts of Copper you can find them in the membership area of EWF.
An ending diagonal is a type of impulsive motive wave in Elliott Wave Theory that will be found in the subdivision of fifth waves or whole C waves in a structure. An ending diagonal C wave or 5th wave commonly shows an obvious wedge shape with an overlapping wave 1 and wave 4. These will subdivide into 3-3-3-3-3 however an overlapping wave 1 and wave 4 are not required conditions that must be met. The overlap may or may not happen thus it is acceptable for there to not be any overlap. These structures will appear in either bullish or bearish markets in all time frames. For reference shown at the bottom there is a couple of bullish examples the above mentioned wave C’s & 5th’s describes.
There are a few conditions that ending diagonal waves have in common with a regular impulse. Firstly the whole structure will be five waves however it will subdivide into the aforementioned 3-3-3-3-3 instead of 5-3-5-3-5. Secondly the wave three will not be the shortest of the five wave move thus either the wave one or the fifth wave will be shorter than the wave three. Finally the fifth wave of a bullish market ending diagonal will have a lower momentum reading such as on a RSI indicator where it will be showing some divergence compared to the wave three. Correspondingly in a bearish market ending diagonal the wave three will have the lower momentum indicator or RSI reading when compared to the wave five.
Keep in mind a five wave motive, whether a regular impulse with the 5th wave being an ending diagonal or an ending diagonal wave C itself will be commonly seen in the larger double three combination structures such as in the C wave ending moves of zig-zags as well as in flats of each of the three types .
AUDUSD Short Term Elliott Wave view suggests that Primary wave ((W)) ended at 0.7731 on October 6th low. Up from there, Primary wave ((X)) is currently unfolding as a double three Elliott Wave structure. Intermediate Wave (W) of ((X)) ended at 0.7807 and Intermediate wave (X) of ((X)) ended at 0.7815. Near term, while pullbacks stay above 0.7815, but more importantly above 10/6 low at 0.7731, expect pair to extend higher. At this stage, pair still needs to break above Intermediate wave (W) at 0.7815 to give more validity to this view. Until then, we can’t rule out a double correction in Intermediate wave ((X)).
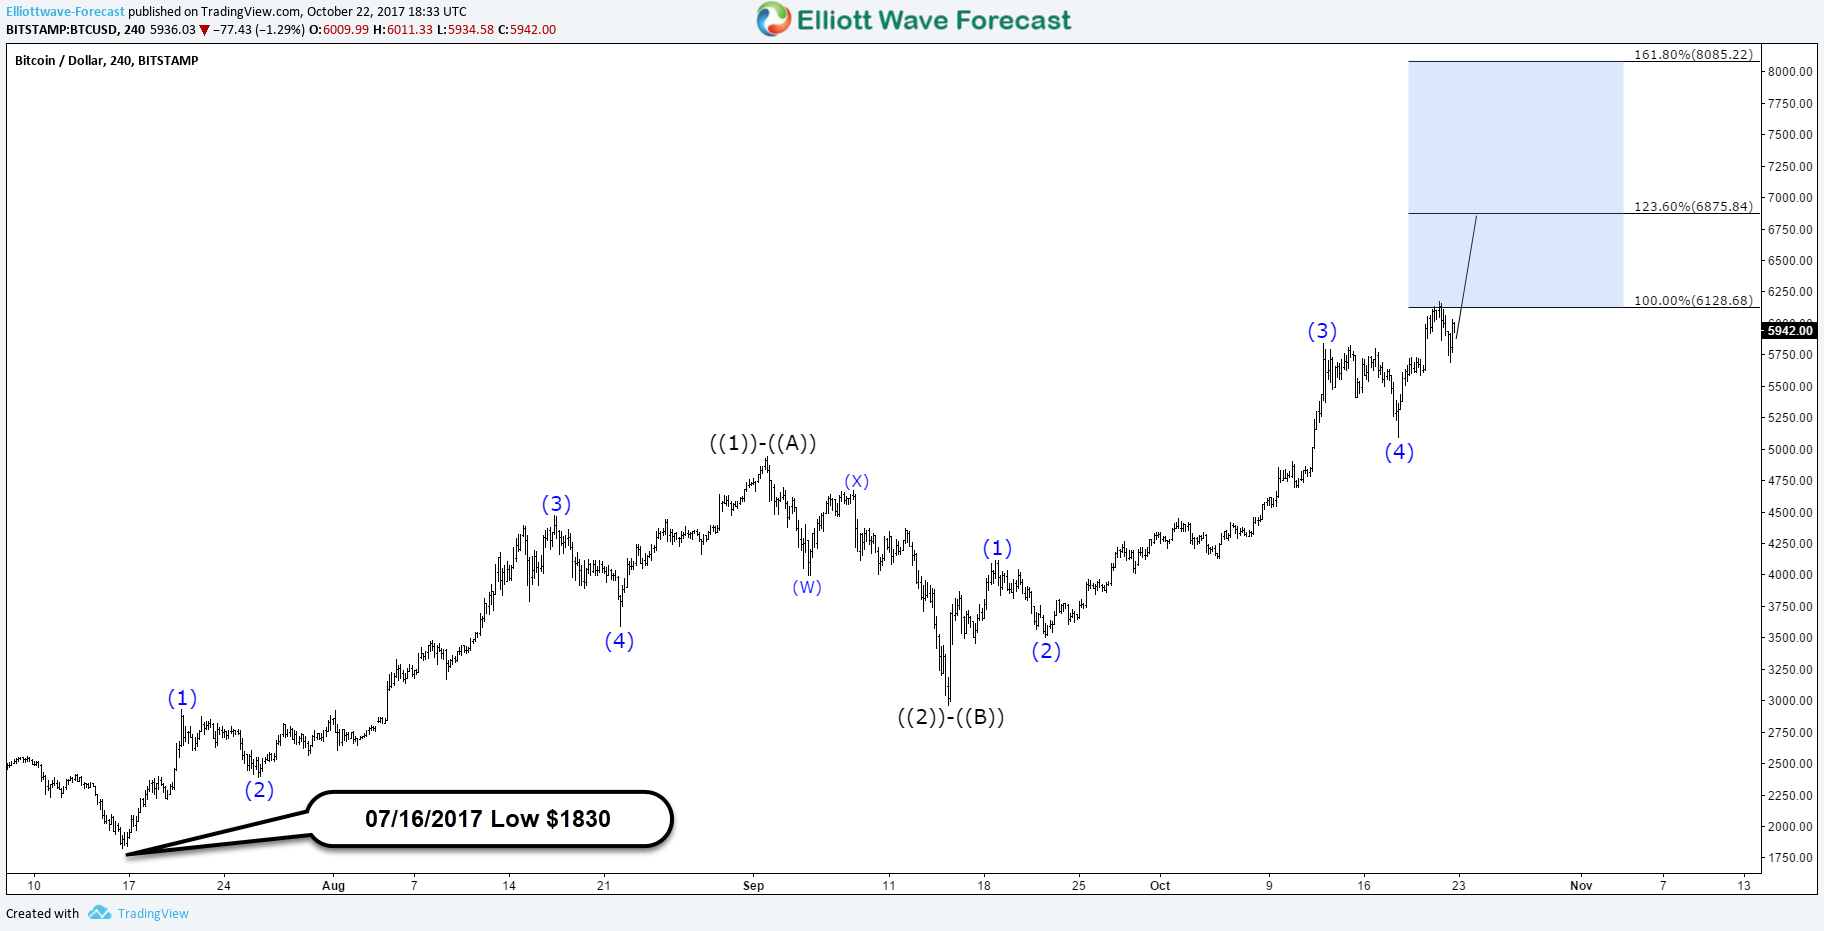
Bitcoin continue it’s outstanding performance as it managed to breach the $6000 barrier this weekend, it currently up 200% from 07/16 low and with a total of 500% for this year. The rally from $1830 low is represented by 3 swings subdivided into 5 waves rally then 3 waves pullback followed by another 5 waves.
This type of move can be either labeled as 3 waves Zigzag Structure which can end around equal legs area $6100 – $6800 or it can be part of a 5 waves move which means BTCUSD still needs to extend further toward $8000 as the most powerful 3rd wave move usually reach the 1.618 Fibonacci extension level.
To be able to identify which scenario will take place, we’ll wait for the next pullback to take place then depending on the structure and strength of move we’ll know if it’s only correcting the cycle from 09/15 low or the full cycle from July low has ended.
BTCUSD Cycle from 07/16/2017 Low
Currently the cycle from $2972 is still in progress as 5 waves ending diagonal, which already have enough number of swings to call it completed. However, the target for wave 5 can be calculated in 3 different ways and in that case the digital currency can still see more upside in the short term as we have these targets :
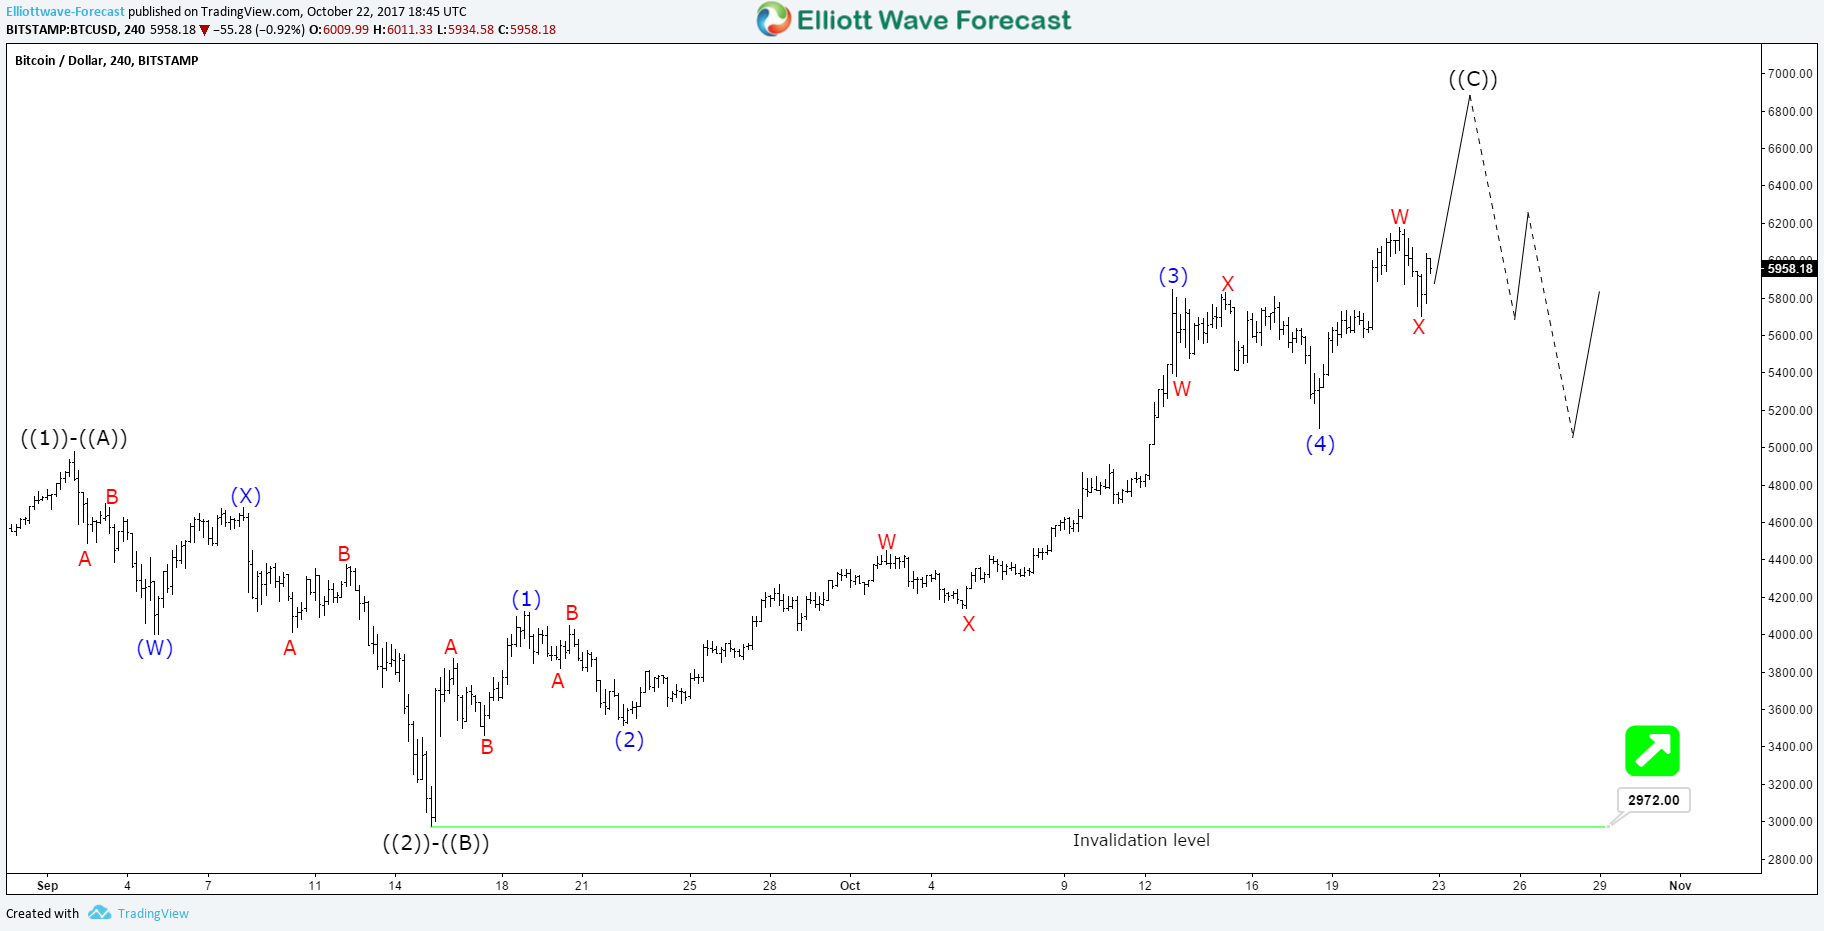
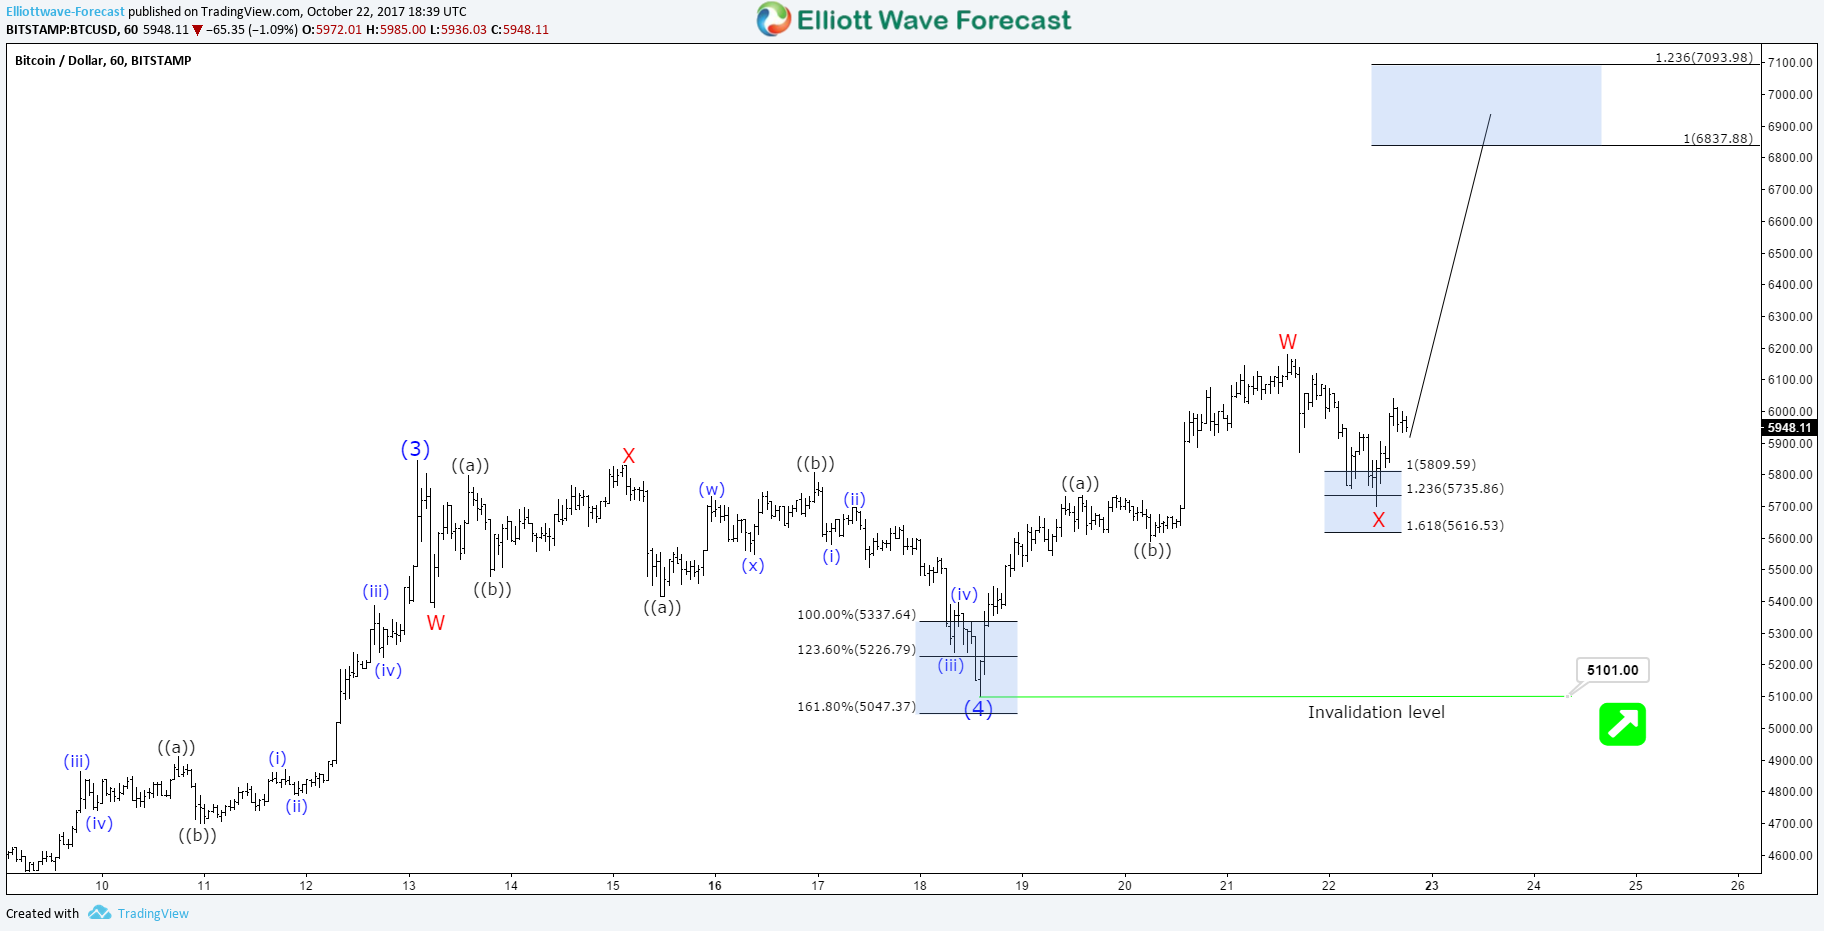
BTCUSD Wave ((C))
We can also use the internal structure in the 1H chart to calculate the move higher, which is expected to take place as 7 swings double three structure looking to reach equal legs area $6837 – $7093 as long as it remain above $5101 low.
BTCUSD 1H Chart 10.22.2017
Consequently, Bitcoin shorter term cycles are still calling for more upside but the bulls needs to be careful about chasing the logn side here as the cycle is mature and can turn anytime soon after hitting the mentioned targets above.
Bitcoin Recap
The digital currency is entering an important extreme area around $6100 – $6800 which can produce at least 3 waves pullback before it can either resume the rally to reach $8000 or start a larger correction the can take it back lower toward $4000.
FTSE Elliott Wave view suggests that Primary wave ((4)) ended with the decline to 7199.5. Up from there, rally is unfolding as an impulse Elliott Wave structure where Minor wave 1 ended at 7327.5 and Minor wave 2 ended at 7289.75. Rally to 7494.34 ended Minor wave 3, and pullback to 7473.12 ended Minor wave 4. The last leg Minor wave 5 ended at 7565.11 and this also ended Intermediate wave (A) of a zigzag Elliott Wave structure from 9/15 low (7199.5).
Intermediate wave (B) is currently in progress as a double three Elliott Wave structure. From 7565.11 high, Minor wave W ended at 7485.42 and Minor wave X bounce ended at 7560.04. Near term, while bounces stay below 7565.11, expect the Index to turn lower towards 7431 – 7481 area to complete Intermediate wave (B). Afterwards, Index should resume the rally to new high or at least bounce in 3 waves. We don’t like selling the proposed pullback.
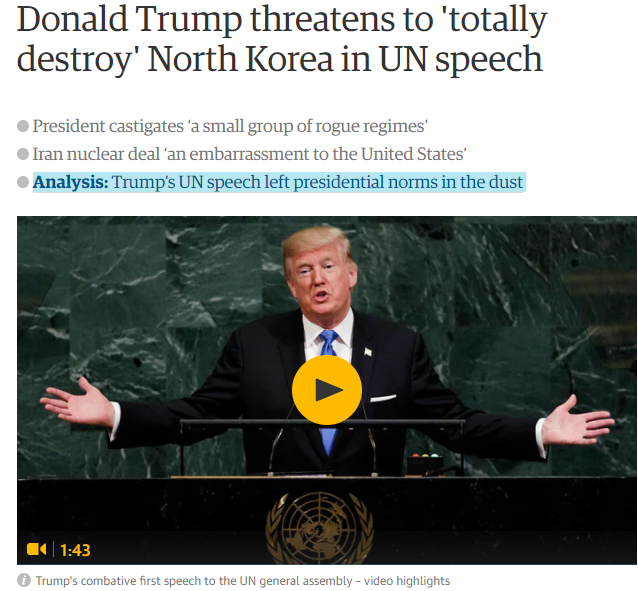
US President, Donald Trump, threatened to “Totally Destroy” North Korea during his speech in United Nations assembly on 19th September 2017 and further added that “Rocket Man” is on a suicide mission for himself and for his regime. “The US has great strength and patience,” Trump said. But he added: “If it is forced to defend ourselves or our allies, we will have no choice but to totally destroy North Korea. He said the US was “ready, willing and able” to take military action, but said hopefully that would be unnecessary if the rest of the world stepped up its efforts to constrain the Pyongyang regime.
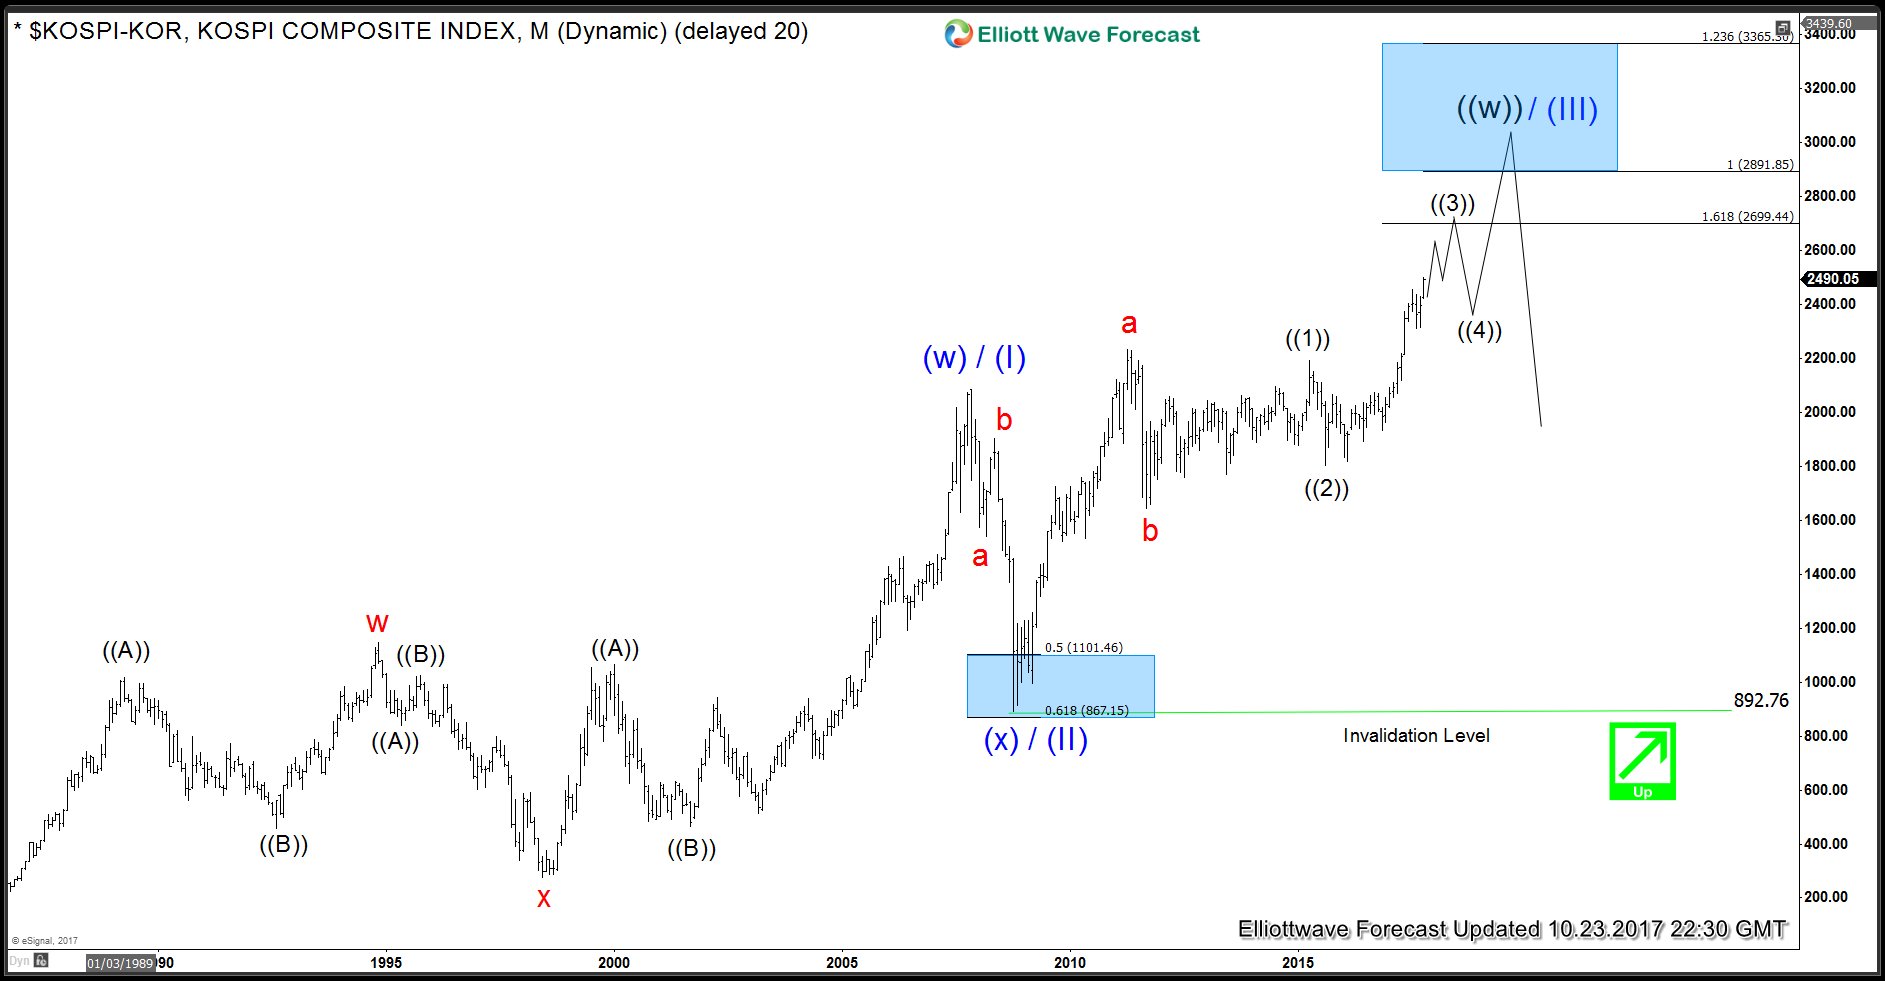
On 3rd September 2017, North Korea conducted it’s 6th Nuclear test which sent stock markets around the world tumbling lower but only to bounce back very strongly. We were quick to highlight in our article on 4th September 2017 that Nuclear tests posed little threat to Indices and rally should resume. Since then, we have seen US Indices extending their rallies to new highs and even Nikkei Index from Japan managed to break above 2015 peak to create an incomplete sequence from 2009 low. Today, we will revisit the long-term chart of $KOSPI-KOR which shows rally has extended since North Korea’s Nuclear test and we don’t think it’s due for a major correction any time soon. Of course, the rally will not be in a straight line and there will be pull backs in-between but those pull backs should be nothing more than a buying opportunity.
$KOSPI-KOR Long-term Elliott Wave View
Chart below shows that Index has made new highs and extended the rally since 3rd September 2017. Next level of interest is 2699.44 which is 161.8 extension of ((1))-((2)) where wave ((3)) is expected to complete. From that area, expect a pull back in wave ((4)) to develop to correct the cycle from 8.1.2015 (1800.75) low and extend higher again towards 2891 – 3365 area which is the 100 – 123.6 extension area of the first 3 waves rally from all time low.
In conclusion, $KOSPI-KOR suggests that Donald Trump’s threat to “Totally Destroy” North Korea and “Rocket Man” would remain just a threat for the near-future and at least until 2891 – 3365 area is seen. Market is technical and moves based on cycles and sequences, news and Geo-political tensions can change short-term path but don’t have the power to alter the underlying cycles and sequences of a given instrument.
Elliott wave: Are the Indices ending 5 waves or not?
Elliott wave: The 5 waves advance
The Elliott wave Theory is a famous trading tool and is based in the idea that the Market advances in 5 waves and corrects in 3 waves. The Theory has some basic rules which are listed below
1) Wave 2 never retraces more than 100% of wave 1.
2) Wave 3 cannot be the shortest of the three impulse waves, namely waves 1, 3 and 5.
3) Wave 4 does not overlap with the price territory of wave 1, except in a diagonal formation.
These rules are the ones which appear in a 5 waves advance but also the one that make traders around the globe to be misled into trading on wrong side of the Market. Many traders develop the habit to pick tops and trade into corrections when they see what looks like a 5 waves move and believe that a pullback or sell off is imminent. The reality is that those 3 rules are not enough and we have been saying for years that the Theory is too simple and too old to be used without any other tools. We have added several new rules or conditions to validate the Market and consequently gain an edge over the Market and the theory itself. In this blog, we will explain why the YM #F which is the Dow Jones Futures is being wrongly counted as a 5 waves move from 2 significant lows i.e. the 2009 cycle and the 2.2016 low cycle. We believe wave 5 in an advance needs to provided momentum divergence against the peak of wave 3 , otherwise the move is either corrective and ending a 3 waves advances or even more powerful when the market is still within the wave 3 with the waves 4 and 5 to come. Let’s now take a look at the charts below
YM#F Cycle from 2.2016 low: 5 Waves or not?
The Chart above is showing the cycle since 2.2016 low and if we look at RSI at the bottom of the chart, we can see that move from 8.2017 low has erased RSI divergence with respect to 3.2017 peak , in other words RSI is currently at the highest level since the move started from 2.2016 low so we are either ending the whole cycle as a 3 waves corrective sequence or still within wave 3 of a 5 waves advance.
YM#F Cycles from 2009 low (Price and RSI)
The Chart above is showing the cycle since lows at 2009 and we can see how the price have erased the divergence within the cycle and showing 5 swings, meaning it’s not a 5 waves advance. We can see how both cycles have erased divergence compared to the higher read within the cycle which mean that current rally is the peak in both degrees and more upside should happen in the long term cycles. The Market is a combinations of cycles and time frames and traders need to upgrade and downgrade the Instrument be able to provide a reliable forecast or wave count. We are always trying to help members and non-members to understand the Elliott wave Theory and applying it to according to the current times instead of following the theory in it’s original form which is too simple and without additional tools, doesn’t help to avoid falling into the traps laid out by the Market every day. The Relative Strength Index (RSI), developed by J. Welles Wilder, is a momentum oscillator that measures the speed and change of price movements. The RSI oscillates between zero and 100, the instrument gather the strength of the move and we used every day in our charts and forecast, we always aid a wavers without the RSI won’t be able to get the desired results and today the proof is that, we are not ending a 5 waves move in the YM# F (Dow Jones). We are either ending wave 3 with 4 and 5 to come or we are ending a correcting advance since the lows at 2.2016. We do understand the optical view of the 5 waves advances but the RSI is denying the notion of 5 waves so it’s better to find a count which fit the criteria instead of forcing and eventually falling into the trap. The cycle from 2.2016 can end soon and provide a pullback and another chance to buy, but if the pullback happens without a 4-5, then the structure will become corrective from 2009 and 2016 cycle.
Short term Gold Elliott Wave view suggests that the rally from 10/06 low (1260.52) to 10/16 peak (1306.35) ended intermediate wave (X) then the decline from there is unfolding as a a double three Elliott wave structure. As the structure of the 10/16 peak looks to be overlapping, hence suggesting its corrective structure, either W, X, Y or W, X, Y, Z.
The first leg lower ended in Minute wave ((w)) at 1276.34 & bounce to 1291.17 ended Minute wave ((x)). Minute wave ((y)) currently in progress as double three structures. Where Minutte wave (w) ended at 1272.43 low and Minutte wave (x) bounce at 1283.54 as a flat. Near term, as far as bounces fails below 1291.17 peak metal has scope to extend 1 more push lower towards 1261.19-1254.42 100%-123.6% Fibonacci extension area from 10/16 peak. Afterwards it should end the cycle from 10/16 peak and should do a 3 wave bounce minimum. We don’t like buying the metal and as far as bounces fails below the 1291.17 peak and more importantly the pivot from 10/16 peak stays intact metal is expected to trade lower.
FTSE Elliott Wave view suggests that decline to 7199.5 ended Primary wave ((4)). Up from there, the rally is unfolding as an impulse Elliott Wave structure where Minor wave 1 ended at 7327.5 and pullback to 7289.75 ended Minor wave 2. Rally to 7494.34 ended Minor wave 3, and pullback to 7473.12 ended Minor wave 4. Minor wave 5 ended at 7565.11 and this also ended Intermediate wave (A) of a zigzag Elliott Wave structure from 9/15 low (7199.5).
Intermediate wave (B) pullback unfolded as a double three Elliott Wave structure where Minor wave W of (B) ended at 7485.42, Minor wave X of (B) ended at 7560.04 and Minor wave Y of (B) ended at 7437.42. Near term, while pullbacks stay above 7347.42, and more importantly as far as pivot at 9/15 low (7196.09) stays intact, expect Index to extend higher. We don’t like selling the Index.
The tax reform is perhaps the single most important agenda for Republicans. The consequence for falling short of the tax overhaul is dire. Should Republicans fail to deliver the tax reform, they could face rout in the mid-term elections next year. This means losing control of the Senate and possibly also the House of Representatives where they have a majority now. Recently, Treasury Secretary Steve Mnuchin has suggested that stock market could give back much of the gain if tax reform fails. Mnuchin said during a recent interview with Politico: “There is no question that the rally in the stock market has baked into it reasonably high expectations of us getting tax cuts and tax reform done”. Given the high stake, the market seems to believe that some version of tax reform is likely to come out of Washington.
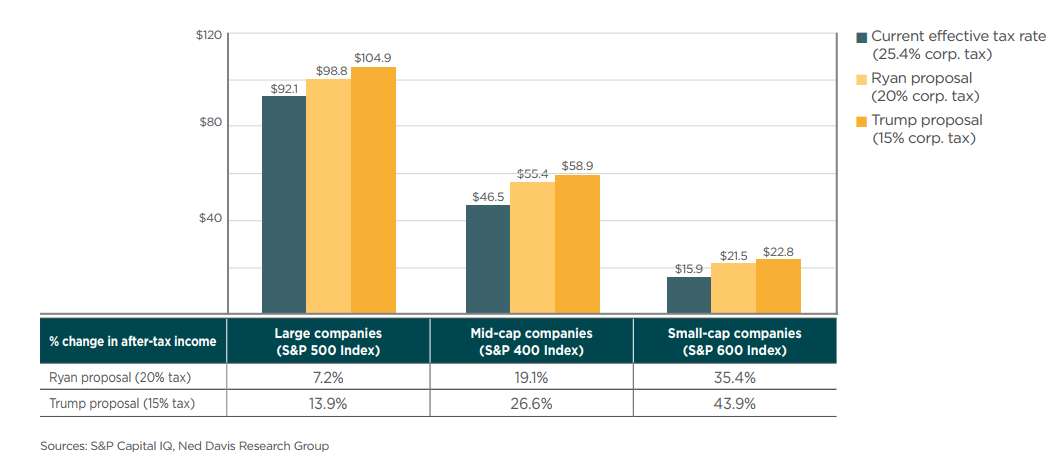
Reduction in corporate tax rate will boost S&P 500 Earnings Per Share
S&P 500 has gained in value more than $3.5 trillion since Trump’s election last November. Some suggest that it is due to the investors expectation that the Earnings Per Share of the S&P 500 companies would get a boost, and thus increasing the valuation. One major component in the tax reform proposal is a reduction in corporate tax rate. Trump proposed a reduction from the current effective tax rate of 25.4% to 15% while he was a presidential candidate, while House Speaker Paul Ryan proposed a reduction in corporate tax rate to 20%.
An estimate by Ned Davis Research suggests that a drop of corporate tax rate from the current effective tax rate of 25.4% to 20% will boost S&P 500 EPS (Earnings Per Share) by 7.2%, while an adjustment to 15% corporate tax rate would increase S&P 500 EPS by 13.9%. The percentage increase in after-tax income is even greater for mid-cap and small-cap companies as the chart below shows:
Trump’s tax reform plans passed an important hurdle last week when the Senate approved a budget measure which allows the Republicans to deliver a tax-cut package without Democratic support. The Republicans still have yet to produce the tax reform bill as the end of the year approaches. At present, there’s still a lot of disagreement as to what cuts to make and how to pay for them. However, with the intense pressure to succeed on tax reform after they fail to repeal and replace Obamacare, there’s a good chance that some forms of tax reform will come out either this year or in the first half of next year.
Is Tax Reform the reason for American stock markets rally?
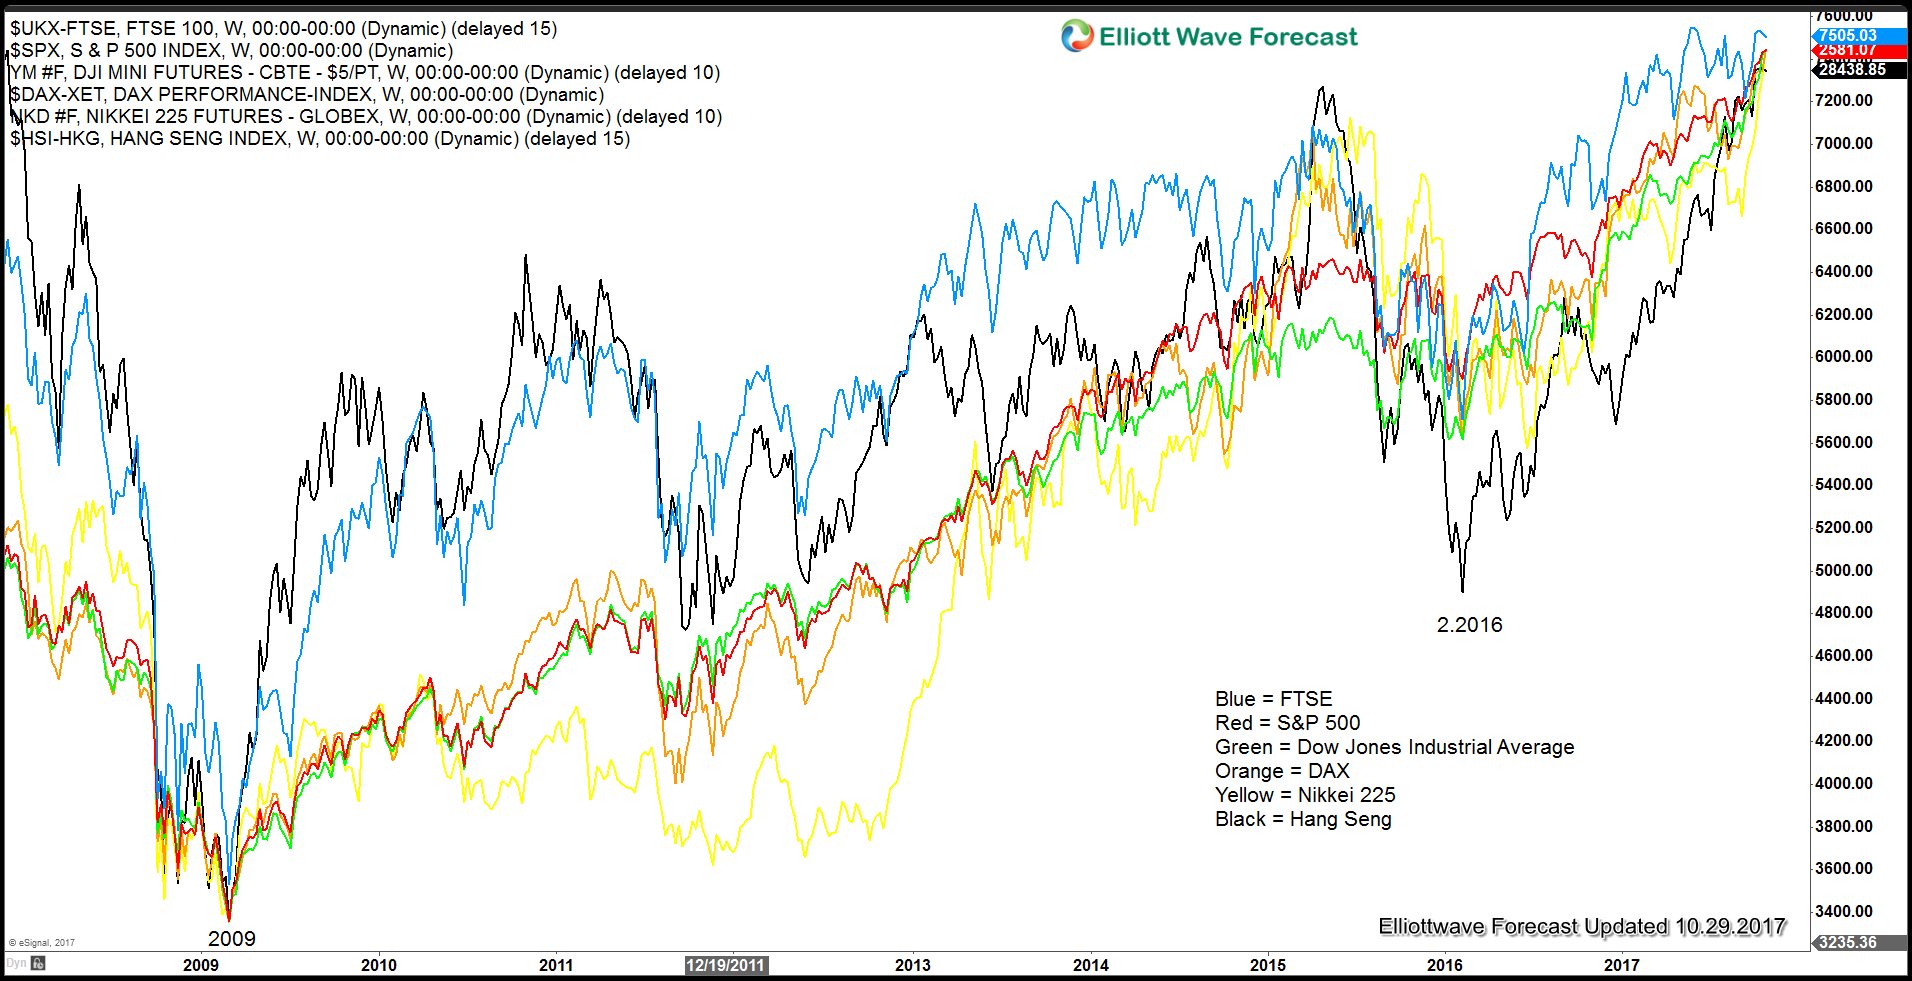
Some argue that the expectation of tax reform and higher EPS will cause American stock market to keep rallying. However, if this is the only reason, then only American market should keep rallying. The rest of the World Indices should not keep rallying as they have nothing to do with Trump’s Tax Reform. But is that really the case? An overlay of some major Indices from the West and East below (FTSE, S&P, Dow, DAX, Nikkei, and Hangseng) can give us further insight:
The six World Indices above represent various geographic regions and they look almost identical in their oscillation. They all have major low in 2009 and secondary low around February 2016. As of this writing, they all keep making a new high. Granted that not all of them make all-time historic high like S&P 500 or DJIA, but they all still keep rallying nonetheless. This simple analysis tells us that there’s more than just the argument that tax reform supports American stock market. We at Elliottwave-Forecast believe there is only one market and a high degree of correlation within the same group and also across asset groups.
As we suggested in our previous article on October 9th titled “The World Index Has Much More Upside“, we argued that Hang Seng Index & FTSE show the clearest sequence in Indices group at this stage and they favor more upside. If the World Indices remain to move in the same cycle, then American Indices should also continue to be supported as Hang Seng and FTSE continue higher, whether we get significant Tax Reform or not.
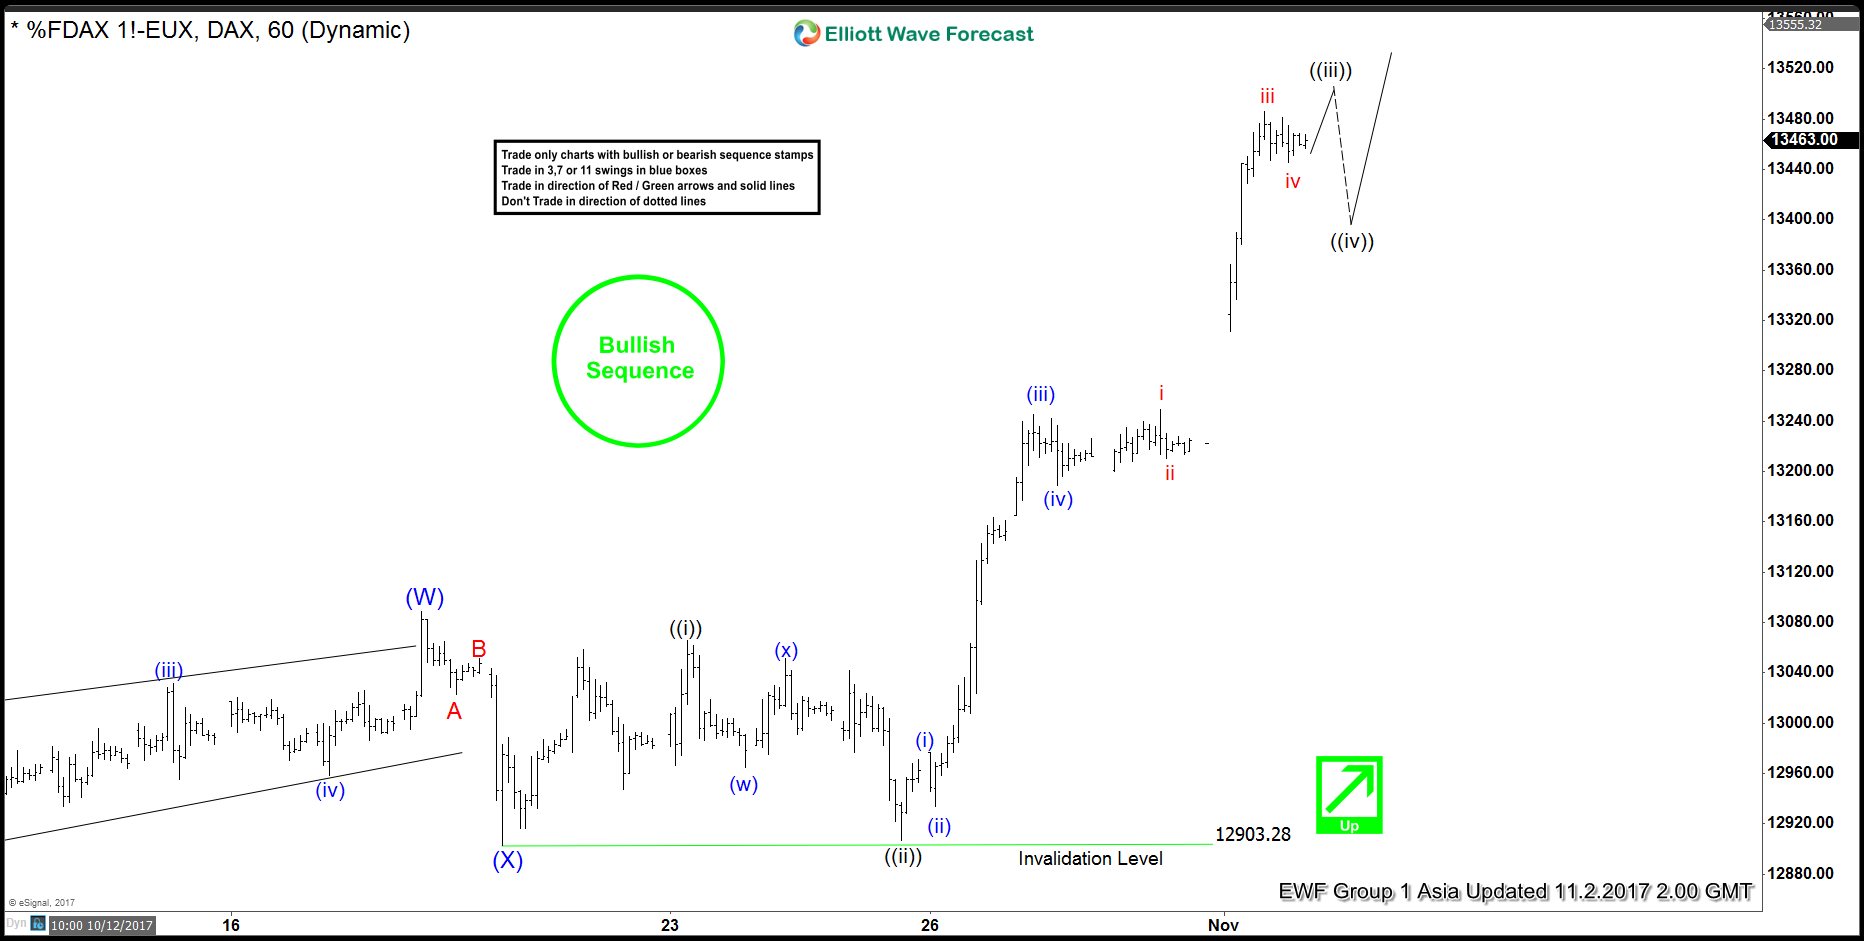
The rally in DAX from 8/29 low is unfolding as a double three Elliott Wave structure where Intermediate wave (W) ended at 13089 and pullback to 12903 ended Intermediate wave (X). Up from there, the rally from 12903 low looks to be unfolding as an impulse. Minute wave ((i)) ended at 13066 and pullback to 12906.5 ended Minute wave ((ii)). Minute wave ((iii)) remains in progress and expected to end with one more leg higher. Afterwards, Index should pullback in Minute wave ((iv)) before another leg higher in Minute wave ((v)) of A. We don’t like selling the Index in any proposed pullback. For the impulse view to remain valid, ideally Minute wave ((iv)) pullback later should not retrace more than 50% of Minute wave ((iii)). Near term, while pullbacks stay above 12903 low, expect the Index to extend higher.
Is Stock Market Valuation in Bubble Territory?
Many analysts and forecasters argue that stock market is in bubble territory and about to do significant correction or even a crash. There’s a lot of reasons given, both from fundamental and technical point of view. For example, some popular reasons are:
The rally in S&P is the second longest run in the history without a 3% pullback
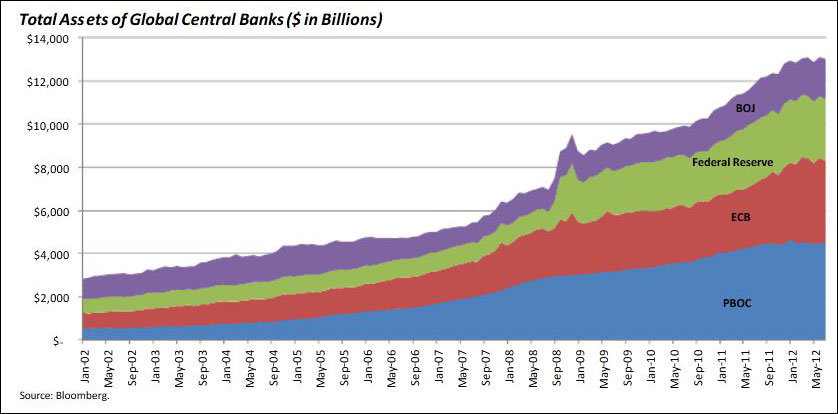
Assets have risen exponentially due to money printing. This is an unprecedented experiment in the history which can have big repercussion when the bubble pops. The chart below shows Central Bank Assets’ expansion
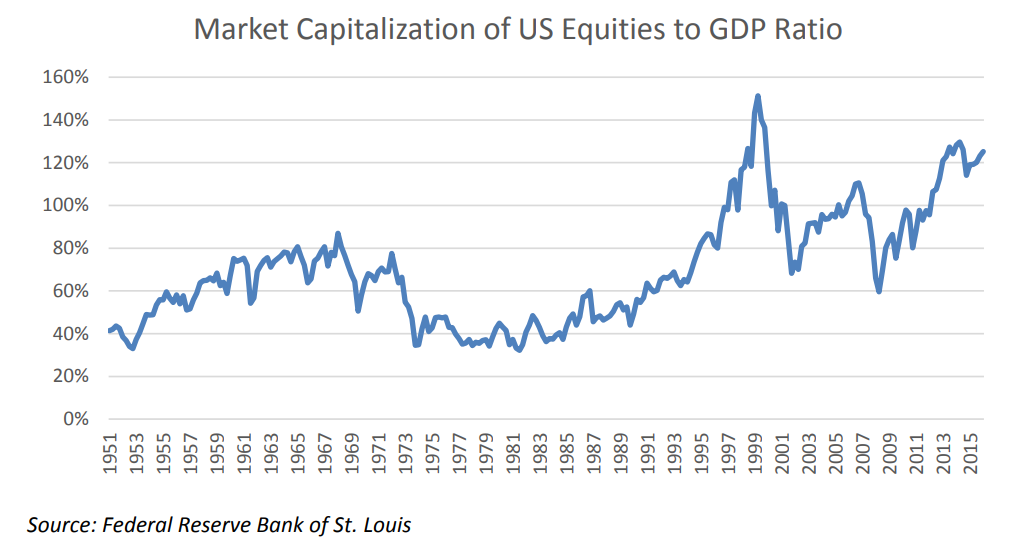
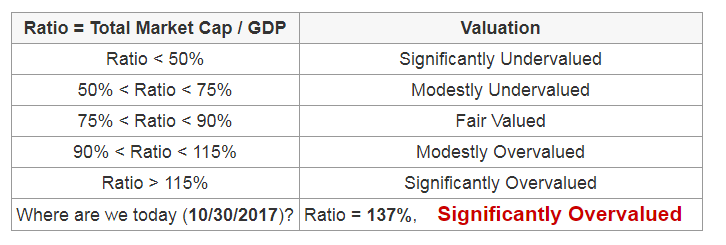
Warren Buffet’s single favorite indicator Total market capitalization-to-GDP ratio as of this writing stands at 137%. This ratio is currently the second highest in the history and significantly overvalued
These are just 3 reasons and there’s plenty of others. These reasons could be right and stock market may indeed be overvalued. However, problem is the market can stay irrational much longer than you as traders can stay solvent holding wrong position. Stock markets should eventually form peak and do large correction. However, although the direction could eventually be right, if the timing of the call is 5 years too early, then what good is it?
For the average traders, the worst case that can happen is listening to all these warnings and picking a top and trying to short against a clear trend. This could lead to a very big loss to the equity. If traders make trading decisions based on these reasons and short the market in the past 3-5 years, they would not have money left to trade as the market keeps going up and squeeze them. As traders, our priority should be how to make profit and control the risk. Most importantly, traders should follow the trend until it’s over. There’s a popular saying in trading “don’t fight against the trend” but in reality a lot of people like to pick top and bottom. Traders should trade what they see, not what they feel. Algos and machines trade based on trend and sequence and they don’t have feeling.
How Much Longer can Stock Market Rally?
We will attempt to look at the price action to answer this question. First of all, we have argued in our previous article that Global Indices show the same cycle. The overlay of various global indices below suggest there is only 1 market. World Indices all make a major low in 2009 and then a secondary low around February 2016.
What this means is that if we can see a clear structure in one of the Indices, we can extrapolate our findings to the other Indices. For example, if 1 major stock index could see further upside in the next 5 years, then there’s a possibility the other World Indices will continue to rally also. In our case, we will look at the Hang Seng Index from Hong Kong. The Index has a very nice and clear structure below
The Hang Seng Index shows a 5 swing sequence from October 2008 low. This 5 swing is denoted in blue color on the chart. A 5 swing sequence (not to be confused with 5 waves impulse) is an incomplete sequence and favors more upside to complete a 7 swing structure. The fifth swing is currently in progress with a target of 29313.39 – 31921.66. We will assume that the time it took from blue 0 – blue 1 (from October 2008 low to November 2010 high) is similar to the time it takes from blue 4 (February 2016) to blue 5. The rally from Oct 2008 low to Nov 2010 high took 25 months. If we add 25 months from February 2016, we will arrive at January 2018. Thus, the current rally in Indices could potentially extend until the end of the year / early next year.
Once the fifth swing ends, we should be looking for a 6th swing pullback to correct the rally from February 2016. The length of time from blue 5 to blue 6 can be extrapolated from the length of time from blue 1 to blue 2. It took 11 months from blue 1 on 11.2010 peak to blue 2 on 10.2011 low. If we end the fifth swing in early 2018 and add 11 months to estimate the sixth swing, the entire 2018 could become a year of correction. However, there’s still 7th swing higher afterwards. The length of time from blue 0 on Oct 2008 low to blue 3 on May 2015 peak is 79 months. If we assume the same time and add 79 months from February 2016 low, we will arrive at January 2022.
In conclusion, unless Hang Seng Index truncates, the path of least resistance for World Indices is to extend higher. Remember there is only 1 market, and if Hang Seng will continue to get supported until year 2022, the other Indices can be supported also. The fifth swing in Hang Seng Index which is in progress could continue until the end of year / early next year. Then we can have a multi-month correction in the sixth swing in 2018. After the sixth swing correction is over, we can still potentially have seventh swing higher which can take us into year 2022.
At Elliottwave-Forecast, we try our best to look at the price action and listen to the market. We try to set aside any bias and our feeling of what the market should have done. We believe until the sequence is complete or Hang Seng truncates, we have no business in trying to fight against a trend or picking a top in World Indices. The bullish sequence remains valid as far as the February 2016 low pivot remains intact.
Oil markets turn bullish with shift to backwardation
This week both Brent Crude and WTI (Light Sweet Crude Oil) made a new price high in more than 2 years with Brent Crude rising to $64 per barrel and WTI to $57 per barrel. These price gains come before the OPEC’s meeting later this month on Nov 30. In the past two years, OPEC has imposed production cuts in its member countries in order to remove excess inventory and halt the price drop. In their last meeting on May, the cartel agreed to extend 1.8 million barrel a day cuts into the first quarter of 2018.
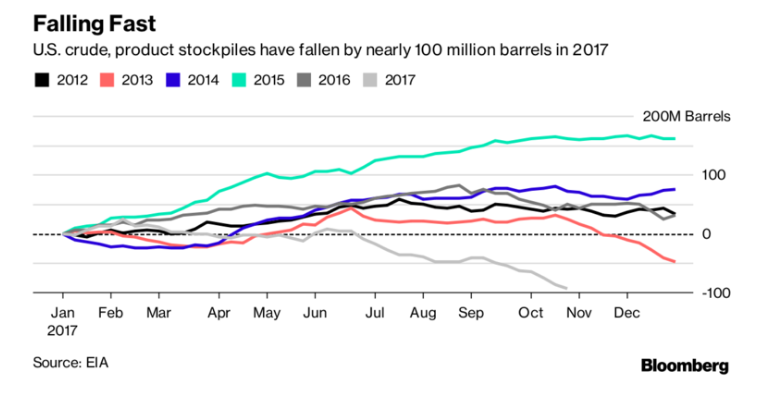
Recently, OPEC officials have given a signal that they will extend the production cuts beyond March 2018 at their next meeting in Vienna later this month. More importantly, this extension will occur at a time when the oil market has already tightened. The OPEC’s attempt to reduce the inventories appears to be bearing fruit. The chart below shows US crude and product inventories fall by 93.8 million barrels since the start of the year.
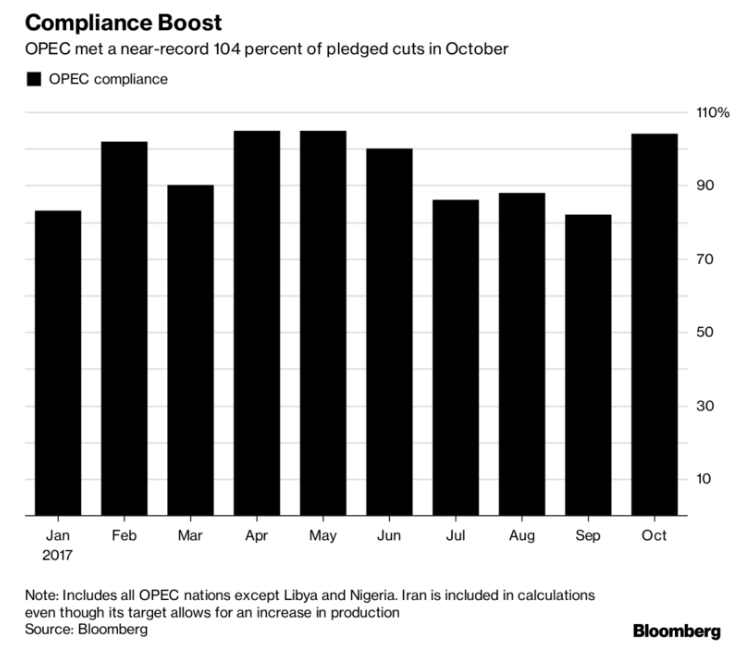
One of the reasons for this success is OPEC members’ compliance to the agreed upon production cuts from last year. In October, the compliance reaches 104% as the chart below shows
Further evidence that oil market is tightening could be found in oil futures market. Both Brent and WTI are now in the state of backwardation. This is a situation where the current price of oil for immediate shipment is higher than the price for future delivery. It signals that the market is tightening and discourage traders from stockpiling barrels. Conversely, contango is when the futures price of oil is higher than the current spot price. Brent has been in backwardation earlier this year, while WTI just recently moved to backwardation as the chart below shows:
This shift to backwardation from contango have important implication. First of all, it suggests that OPEC’s production quotas in the past two years have been successful. Secondly, the shape of the oil curve is an important predictor of future returns. For example, subsequent four and 12 week returns for long oil future position in backwardated market have averaged 1.3% and 2.9%, respectively. In comparison, the same periods see a return of -1.7% and -3.8% on average during contango markets.
If OPEC can extend the production cuts through the remainder of 2018 in their next meeting, the bullish momentum in Oil could perhaps continue into 2018. With the market already tightening, an extension in the production quotas could further reduce any remaining excess supply and support oil spot price.
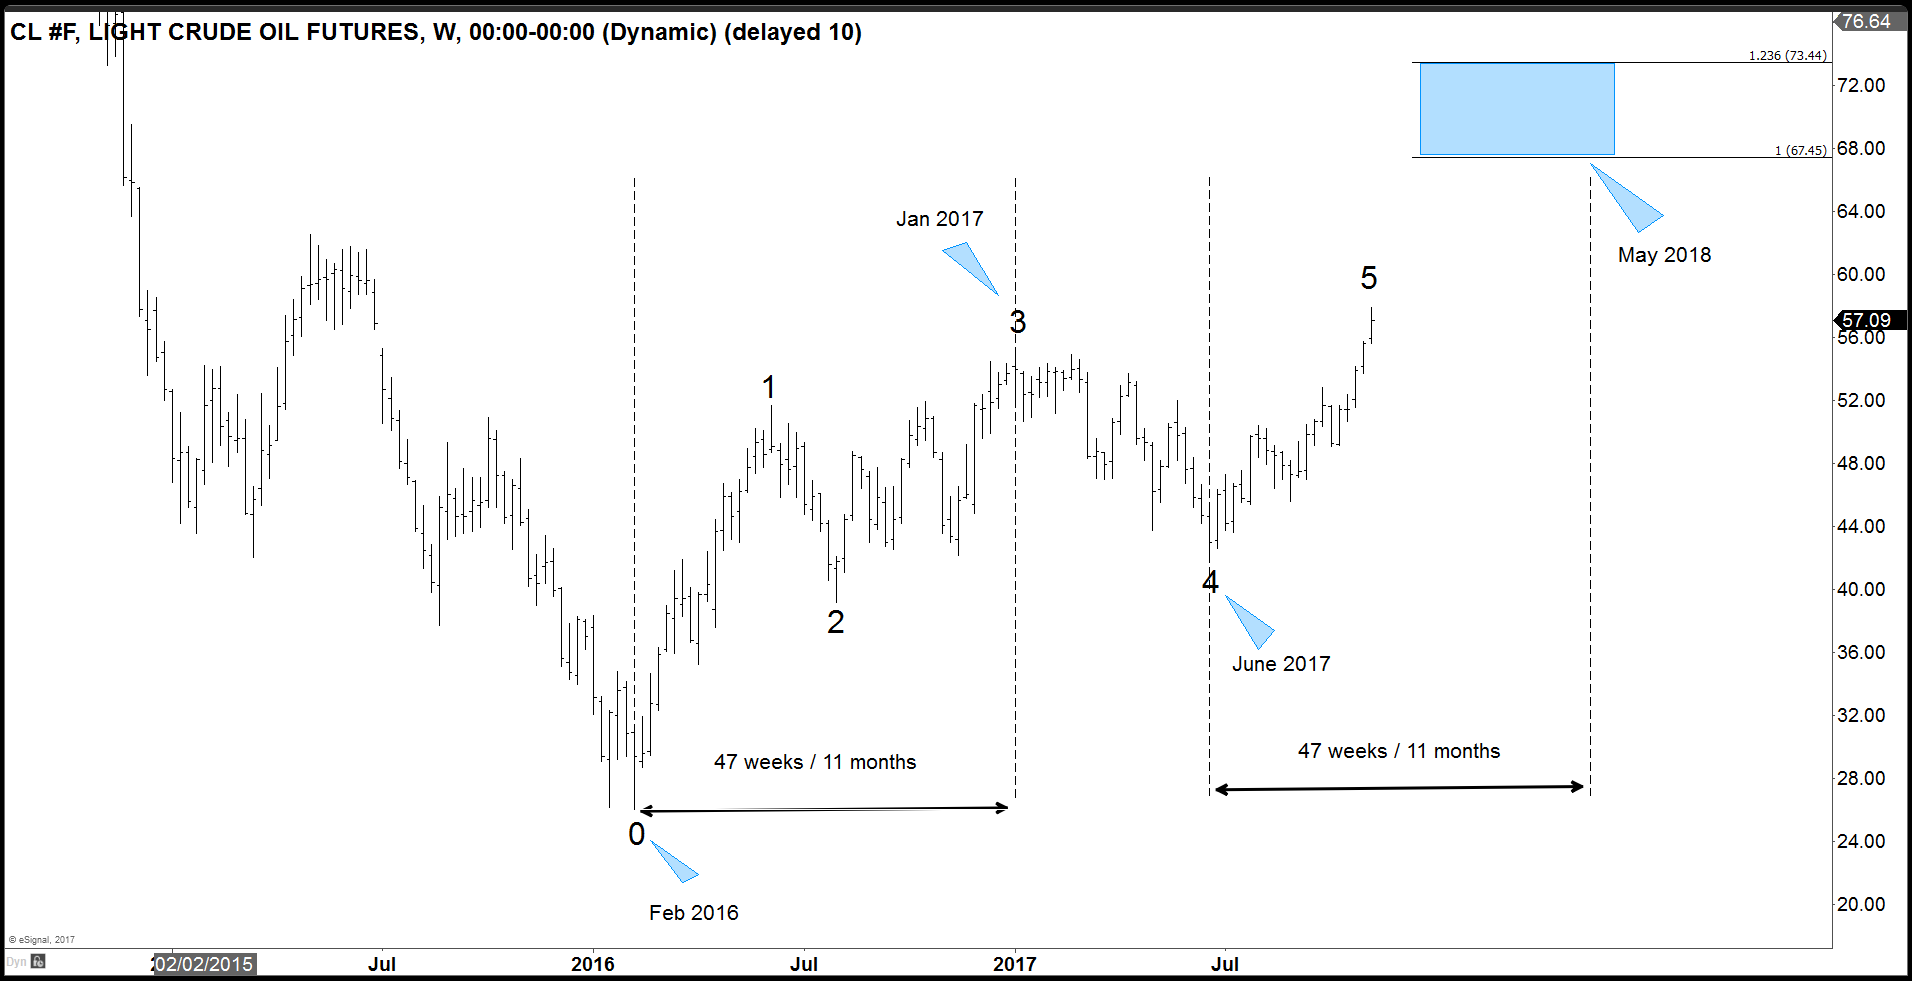
WTI (CL #F) Oil Long Term Chart
The Long Term chart of Oil shows a 5 swing bullish sequence from Feb 2016 low, favoring more upside. Please note a 5 swing sequence is different than 5 waves impulse. Oil is currently favored to extend higher in 7 swing towards $67.4 – $73.4 target. The length of time from Feb 2016 low (0) to Jan 2017 high (3) is 47 weeks or almost 11 months. If we assume Oil will take the same amount of time from June 2017 low (4), then adding 47 weeks will give us May 2018 as an estimated time for the $67.4 – $73.4 target.
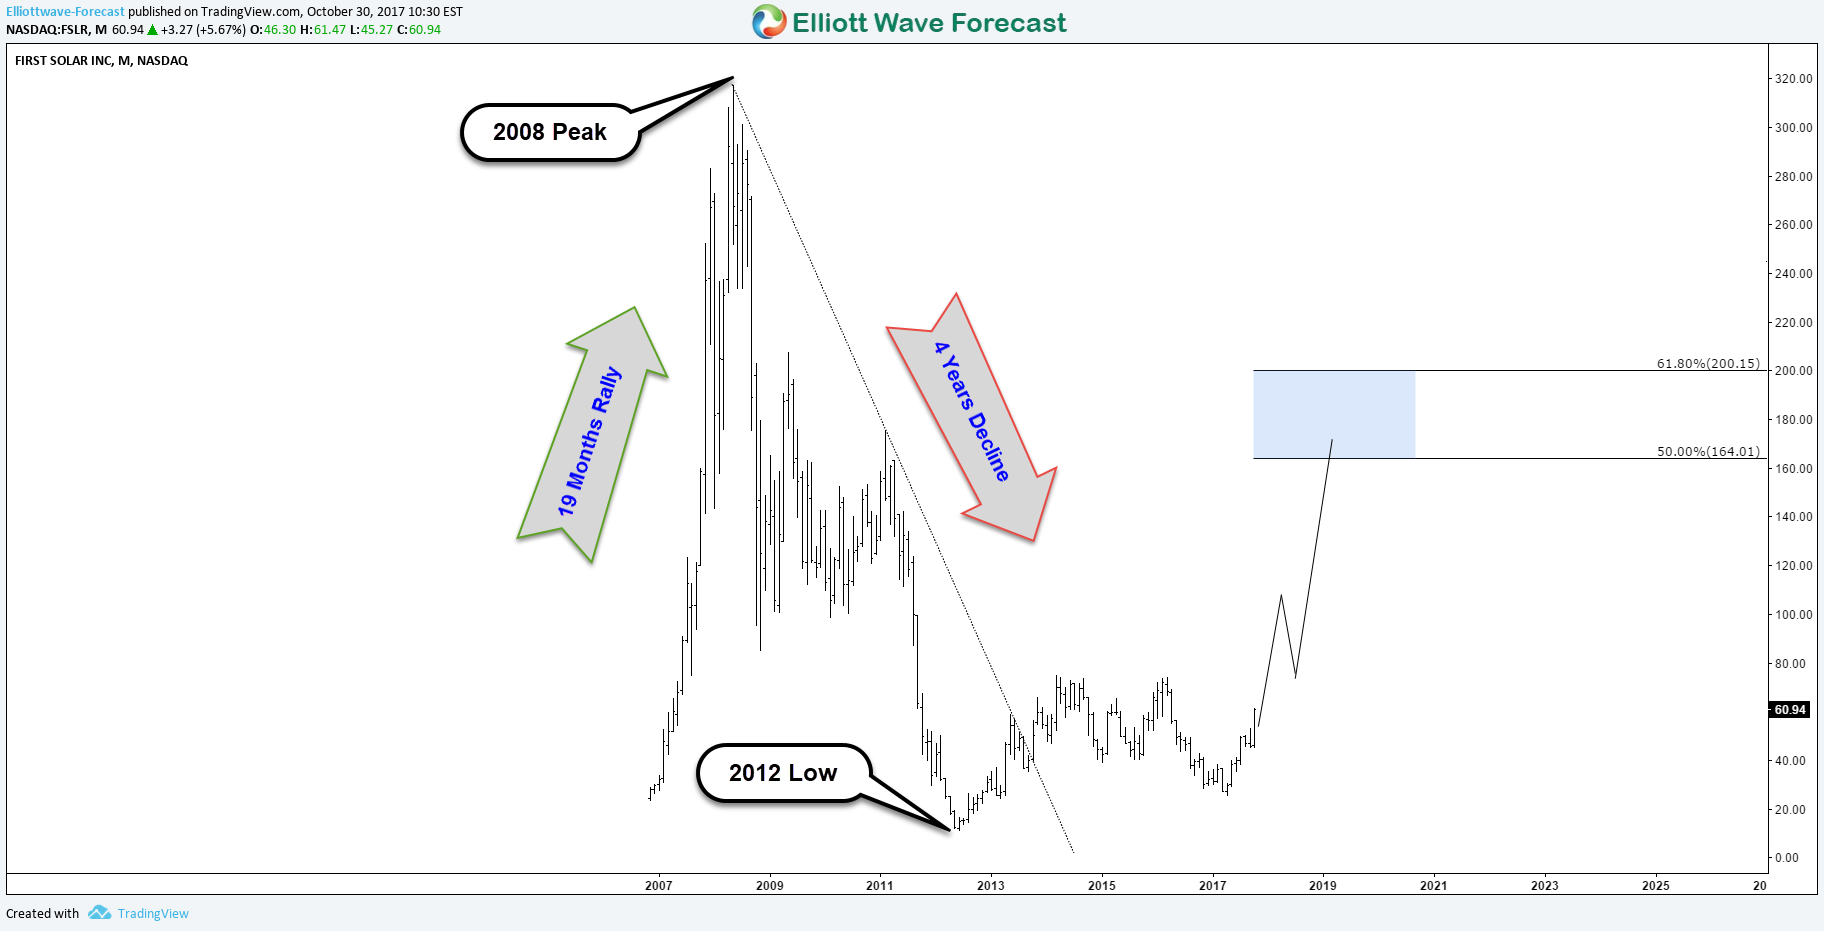
First Solar (NASDAQ: FSLR) designs and manufactures solar modules using a proprietary thin film semiconductor technology. The company has developed, financed, engineered, constructed and currently operates many of the world’s largest grid-connected PV power plants.
First Solar relies almost entirely on utility-scale projects which accounts for over half of the U.S. solar market and can be affected by the potential solar import tariffs by the Trump administration. However, preparation were already made to avoid such a step-back and the company booked 4.5 GW of panel and system sales in the previous quarter, more than it makes in a year.
After last month’s better than expected earnings report and the fact that utilities and project developers are booking tariff-free panels to lock up supply in 2018 helped First Solar shares to jump over 20% and the technical picture for its stock is looking for more gains in the coming months.
FSLR Monthly Chart
First Solar saw an impressive 1100% rally in the first 19 months after its IPO ($20) before it started declining from 2008 peak ($317) like the rest of the stock market around that period. The 3 swings decline lasted 4 years and erased all the gains saw previously until the stock found a bottom in May 2012 at $11.43. Up from there, FSLR bounced higher either to start new bullish cycle to the upside or at least to correct the decline toward the 50% – 61.8% Fibonnacie retracement area $164 – $200.
FSLR Elliot Wave Weekly Chart
Up from May 2012 low, FSLR rallied in a corrective 7 swing sequence which indicates the stock is still in a correction stage then it did another double three to the downside which ended on April of this year. Afterward, the stock started another rally which still needs to break above 2014 peak to target equal legs area $88 – $103 as a first step of a larger move.
In the short term, FSLR is looking to reach $69.1 – 72.5 area where a 3 waves pullback can take place before it can resume the move higher, consequently the stock should remain supported while holding above 45.26 low.
Recap
First Solar booked most of its production for the next two years, which gives it a tremendous amount of certainty and could present a good investment. Technically the stock is still recovering from the fall since 2008 peak but will it be a fast recovery or a slow sideways bounce? Only time will tell but the overall picture remain in favor of the Solor Energy sector and companies like First Solar or SunPower (NASDAQ:SPWR) are have more potential in the future.
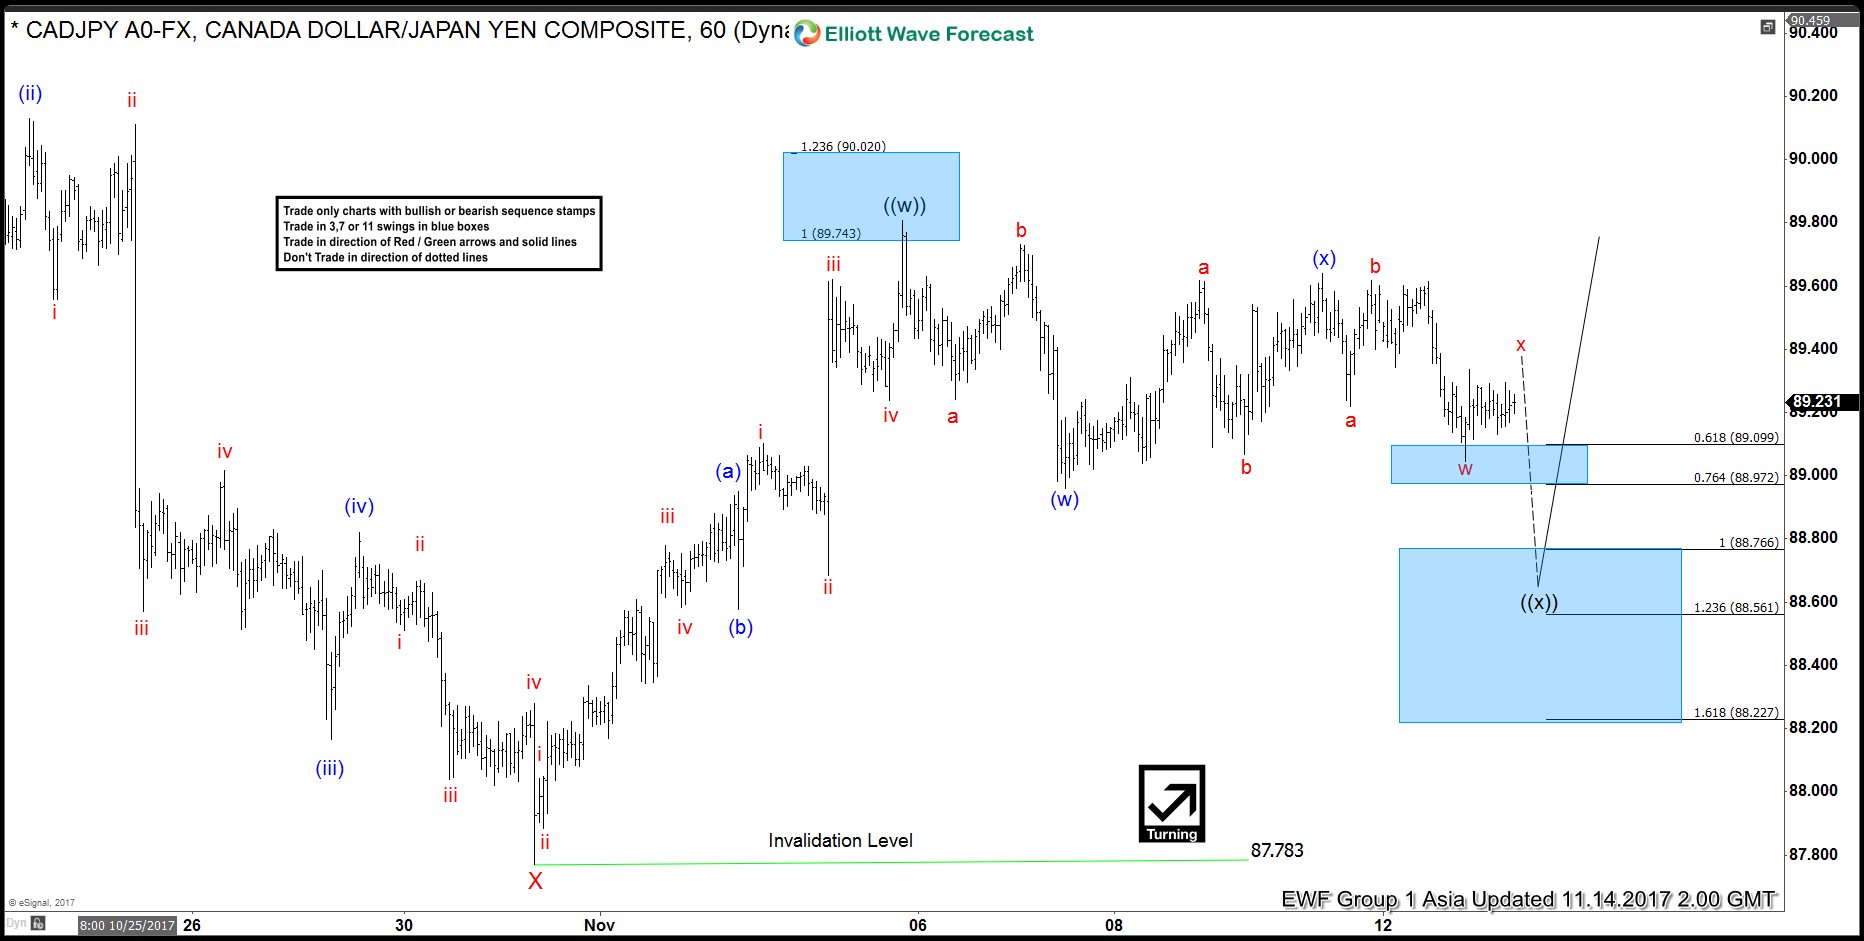
CADJPY Elliott Wave view suggests that the decline to 87.78 ended Minor wave X. Pair starts a new rally from there as a double three Elliott Wave structure where Minute wave ((w)) ended at 89.8. Minute wave ((x)) pullback is currently in progress to correct cycle from 10/31 low in 3, 7, or 11 swing before the rally resumes, provided that pivot at 10/31 low (87.78) stays intact. Subdivision of Minute wave ((x)) is unfolding also as a double three Elliott Wave structure where Minutte wave (w) ended at 88.96 and Minutte wave (x) ended at 89.64. Near term, while bounces stay below 89.8, expect pair to extend lower in Minutte wave (y) of ((x)) towards 88.56 – 88.76 area before pair resumes the rally higher or at least bounce in 3 waves. We don’t like selling the pair.