Elliottwave-Forecast

Master Trader
Feb 17, 2017
2,462
9
84
www.elliottwave-forecast.com
SPX Bounce from the 8/21 lows is Impulsive

Hi fellow traders. The $SPX Bounce from the 8/21 lows is impulsive as the title suggests and does display the usual characteristic traits of an Elliott Wave impulse. Looking back previously before this 8/21 date, the stock index is within an obvious uptrend in multiple degrees. For purpose of this particular blog we are mainly focused upon this particular time frame in four hours up from that aforementioned 8/21 low. The point is to try to tell and show what to look for ideally happening in the near term to help get a shorter term trader in position to capitalize on the pending and conditional dip that can be seen correcting the uptrend cycle from the 8/21 lows. That is to identify the area the wave (4) pullback can reach. Longer term traders and investors should be able to stand back and enjoy the benefit on being long in the uptrend.

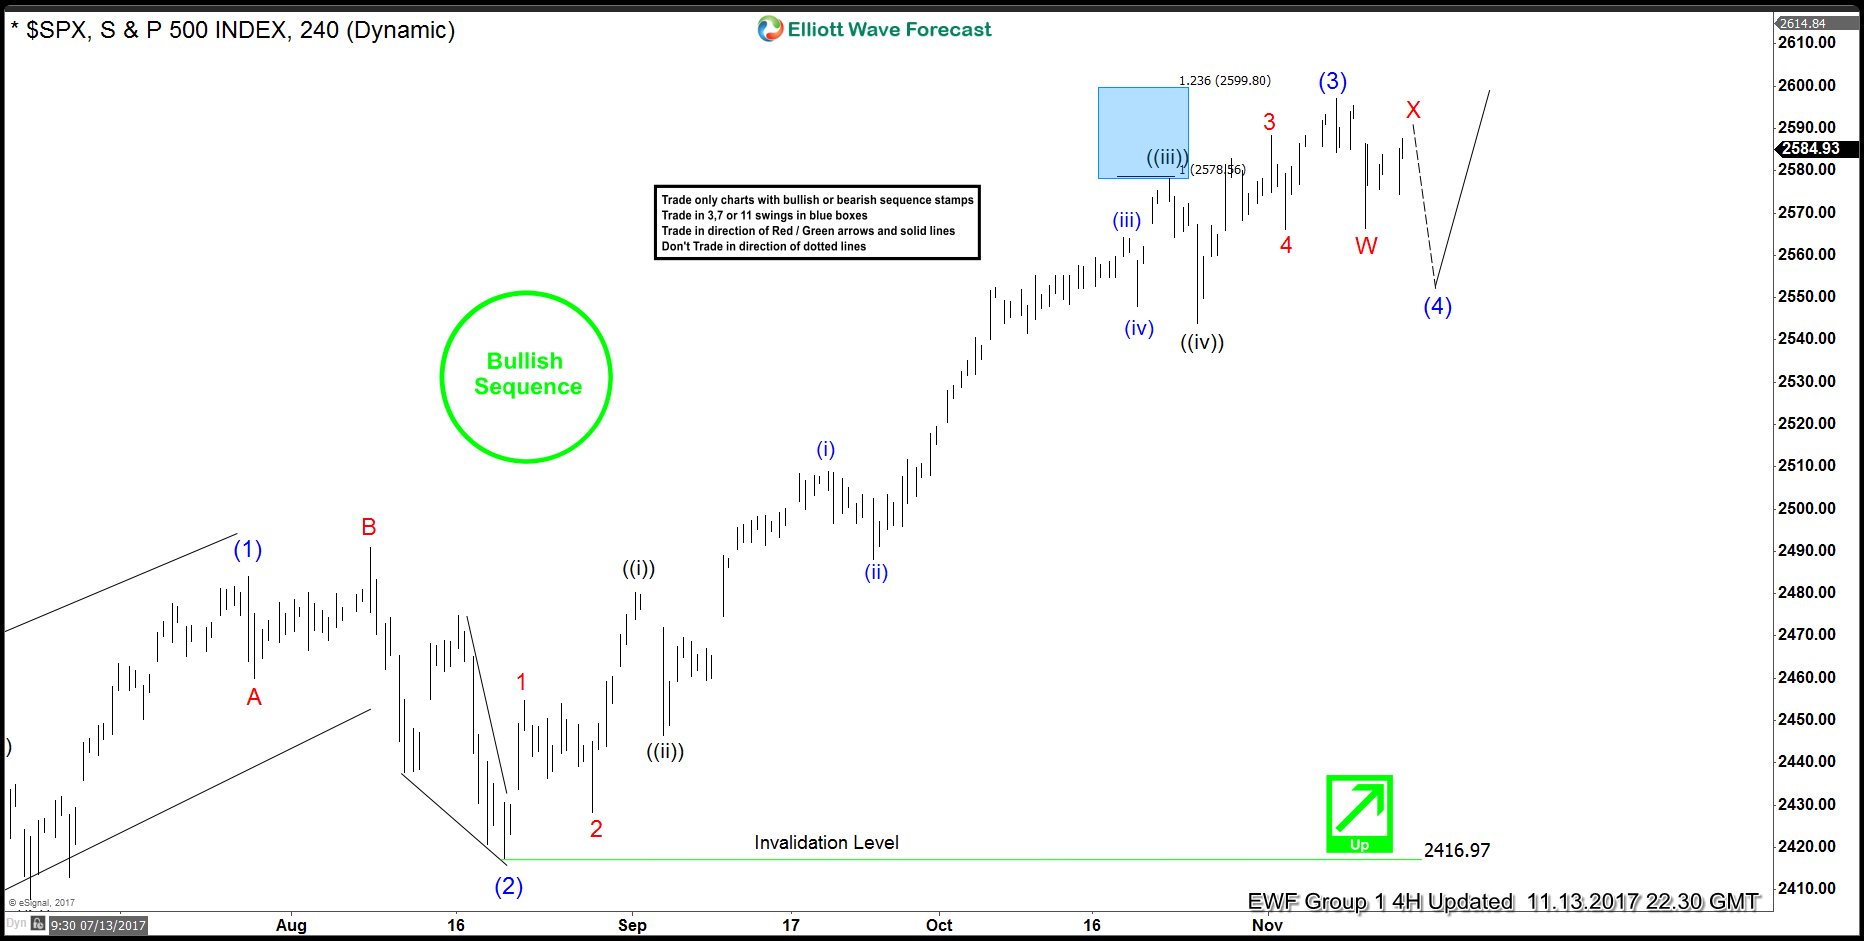
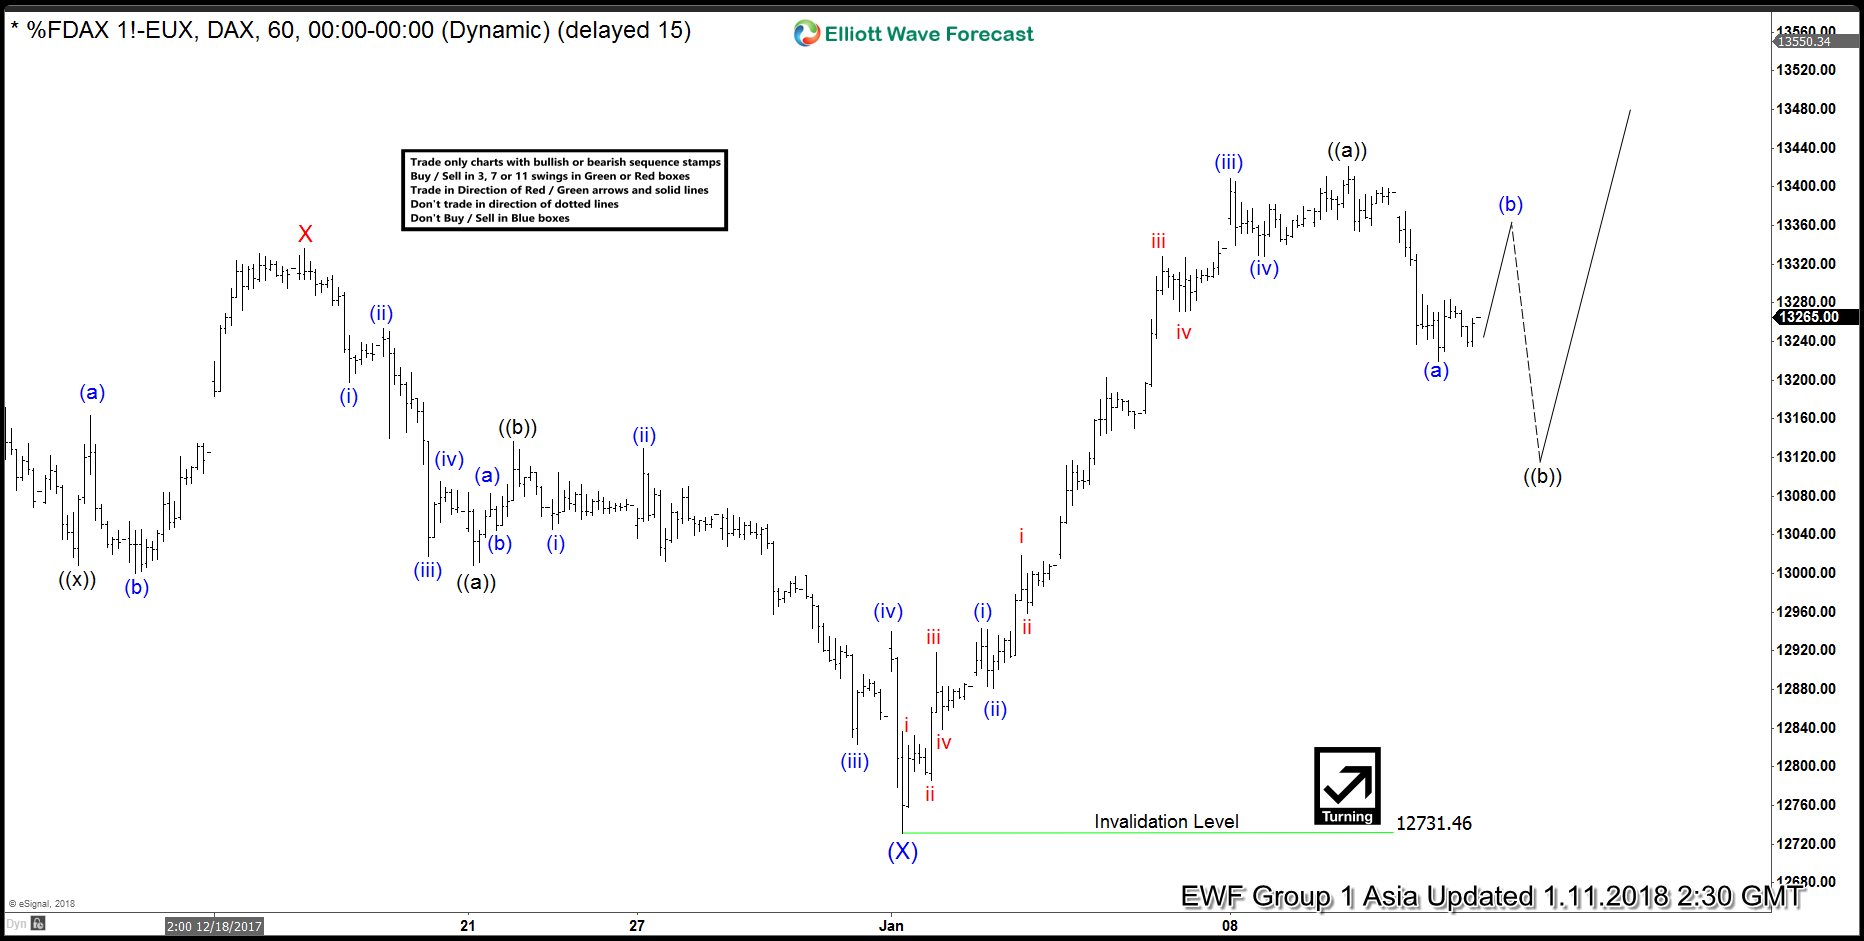
That being said, the dip to 2566 from the 2597 highs of 11/7 , coupled with other correlated instruments was strong enough in our system to suggest it was correcting the cycle from the 8/21 wave (2) lows. The one condition mentioned above is there is an ongoing bounce in wave X shown in the graphic chart below that currently shows an equal legs extension area at 2594 where it may or not reach or as well it can even exceed. What the bounce will need to do is fail below the 11/7 highs at 2597 and turn lower for another swing below 2566 otherwise there is a risk that the wave (3) is extending higher. This is very common for an Elliott Wave three of any degree to extend with the trend and is just another reason a trader should not trade into a correction against the trend. If the dip materializes as proposed then great, buy into it and join the uptrend on the right side of the market.

Finally and back to what the point here is identifying the area the wave (4) dip can reach is as per the following. After the proposed wave X ends and it breaks below 2566 again, a measurement from the wave (3) highs of 11/7 down to the 2566 lows then up to the wave X highs will give the equal legs to 1.236 extension area for the dip in wave Y of (4). The Fibonacci extension will usually be more precise as compared to the usual Fibonacci retracement area in a wave four. As it stands now while below the 11/7 highs a typical wave four will retrace .236 to .382 of a wave three. That area comes in at the 2554-2528 region.


Elliottwave-Forecast

Master Trader
Feb 17, 2017
2,462
9
84
www.elliottwave-forecast.com
Petroyuan Can Accelerate the De-Dollarization

The move away from Petrodollar
In 1974, US President Richard Nixon and King Faisal from Saudi Arabia struck a deal. This deal gave birth to the petrodollar system which still lasts until this day. The deal involves Saudi Arabia selling oil to its largest buyer back then, the U.S. In turn, the U.S. provides Saudi Arabia with money, military aid, and political support. The Saudis then reinvest billions of their petrodollar revenue back in U.S. Treasury bonds.

Since that seminal deal, Oil has traded in U.S. dollars almost exclusively, even when the buyers and producers are not American. The consequence of the dollar-for-oil trade is massive. It creates a huge demand for dollars, therefore establishing US Dollar’s hegemony in world trade. The arrangement has also allowed the U.S. to run a huge deficit and borrow money at very low interest rates to finance the U.S. spending and growth for the next 4 decades.

In recent years however, several nations have tried to abandon petrodollar. The incentives come from the increasingly used tactic of economic sanctions by the Western nations. Washington for example has targeted the Russian economy and imposed an economic burden to force Moscow into submission. In response, Russia has gradually moved away from the reliance to U.S. dollar. Russia worked with China to create alternative to the SWIFT payment system which is not controlled by Western interest. China and Russia have also agreed to use yuan and ruble for bilateral oil trading. A non-dollar trading system will allow countries to bypass and counter the impact of the sanctions. This move away from petrodollar has lessened the US ability to use the dollar as a weapon.

The Alternative of Petroyuan
Today, China is replacing the U.S. position as the top oil importer. From China’s point of view, it makes sense to use Yuan to price the world’s most important commodity. Just as petrodollar creates more demand for US dollar and support U.S. economy in the past 4 decades, petroyuan can also stimulate demand for things in China, whether goods and services, Panda bonds (yuan-denominated bonds), or securities.

To this end, Beijing is said to introduce oil futures benchmark denominated in Yuan in coming months. In July, the Shanghai INE (International Energy Exchange) has completed four-step trial in crude oil futures denominated in yuan. The INE would try to launch it by the end of the year. In the bid to establish petroyuan, in recent years China has also been actively courting the biggest oil producer, Saudi Arabia, to accept Yuan as the currency for oil trade. Many believe that as soon as Saudi Arabia moves to accept Yuan for oil trade, the rest of the oil players may follow suit. The issue however is China’s closed capital market and the inability to move Chinese currency out of the country. To alleviate this fear, China is said to provide an option for the oil producers to convert the Yuan to physical gold in Shanghai / Hong Kong exchange.

For sure, it won’t be easy to replace the dollar and there are still challenges as China needs to convince major countries to participate. In addition, Saudi Arabia can meet a blowback from their long-term ally the U.S. Recent development however suggests Saudi Arabia’s relationship with China is getting warmer. In May this year, King Salman oversaw the signing of deals with China worth $65 billion. King Salman also publicly said he hoped China can play a greater role in Middle East affairs. Then in August this year, China and Saudi Arabia inked another $70 billion of new deals. The deal includes investment, trade, energy, postal service, communications, and media.

Although U.S Dollar may not lose its status as the world reserve currency overnight, the launching of Yuan-denominated crude oil benchmark can mark a new beginning of the end of Petrodollar.

What happens to dollar and Oil with the introduction of Petroyuan?

An overlay of weekly chart between Oil (CL_F) and inverted DXY (Inverted US. Dollar) above shows a strong positive correlation between the two. When Oil prices go up, the inverted DXY chart also goes up which means that US dollar declines. They also have the same major tops and bottoms in 2008, 2011, and 2015.


The introduction of Yuan-denominated oil futures benchmark by China in coming months may represent a big shift in the global order. It could potentially start the progressive decline in US Dollar. To start, there will be lesser demand for U.S. securities across the board. Secondly, Carl Weinberg, chief economist at High Frequency Economics estimates it will take away between $600 billion and $800 billion worth of transactions out of the dollar.

Based on the correlation chart above, we should also see Oil priced in dollar starting to rise as the U.S. dollar lose its value. Not only that, we should also see Gold and other commodity’s price rallying in dollar’s term. The chart below shows an overlay between Gold and Oil which also shows a positive correlation


Elliottwave-Forecast

Master Trader
Feb 17, 2017
2,462
9
84
www.elliottwave-forecast.com
CADJPY Short Term Elliott Wave Analysis

CADJPY Short Term Elliott Wave view suggests that Minor wave X ended at 87.78. Up from there, pair rallies as a double three Elliott Wave structure where Minute wave ((w)) ended at 89.8 and Minute wave ((x)) is in progress. Subdivision of Minute wave ((x)) takes the form of a double three Elliott Wave structure. Decline to 88.96 ended Minutte wave (w) of ((x)) and Minutte wave (x) of ((x)) ended at 89.64. Near term, pair has reached the 100% area from 11/6 peak so the minimum target for Minute wave ((x)) has been reached. However, another leg lower still can happen towards 88.22 – 88.56 area before Minute wave ((x)) ends and pair resumes the rally higher or bounce in 3 waves at least. As far as pivot at 87.78 stays intact, expect pair to turn higher. We don’t like selling the pair.

CADJPY 1 Hour Elliott Wave Analysis
 

Elliottwave-Forecast

Master Trader
Feb 17, 2017
2,462
9
84
www.elliottwave-forecast.com
Retail Industry Index Providing The Next Long

The S&P Retail Industry Index comprises stocks in the S&P Total Market Index that are classified in the GICS retail sub-industry. For this article we’ll be using The SPDR S&P Retail ETF (XRT) which tracks an equal-weighted index of stocks in the US retail industry and correspond generally to the total return performance of the S&P Retail Select Industry Index.

The performance of XRT is significantly correlated to the prevailing level of consumer confidence in the economy because the ETF represent the companies whose main business is selling retail merchandise to consumers like WalMart , Groupon, American Eagle, ect.

XRT Sectors and Holdings


To understand the current situation for the Index we need to take a look at the bigger picture since the recent recession after the 2008 Crash :

Retail Industry Index ETF ‘XRT’ Weekly Chart

[IMG deleted]

The ETF Rallied strongly from it’s 2008 low showing an impulsive 5 waves advance that ended at 2015 pea. Since then, the Index started wasn’t able to rally to new highs similar to the majority of sectors in the stock market.

XRT currently is still correcting the cycle from 2008 low and looking to do a double three structure toward 100% – 123.6% Fibonacci extension area 34 – 31 where it can find buyers for a move to new highs or at least 3 waves bounce.

How can we use the weakness in the retail index to our favor ?

The world financial market is all correlated together and every instrument is related to each other in different dimension. In our next chart we can see how XRT and RUSSEL Index are sharing the same 2016 low which was a buying opportunity around the market as the majority of Indexes rallied to new highs from.

The rally around the world is still in progress almost for 2 years now while the retail industry index remained in a sideways range during that time. As the instrument has a corrective structure taking place then we can use the extreme area to know where the next buying opportunity will take place.

Russel (RUT) VS Retail Industry Index (XRT)

[IMG deleted]

The rally in the stock market is far from ending but correction do take place, that why we use different tools like distribution system , pivots , cycles and correlation to help us identify the right time to switch and look for the next opportunity.

Some of clearest instruments that guide investors around the market in these conditions is the clear structure in Apple (AAPL) and NASDAQ (NQ_F) as both are leading the move to the upside. However as the market is bullish it’s always the wrong call to call a top against the trend as extension can always accrue in the strongest instruments, therefore it’s better to use a weak element in the market like XRT to identify where the bounce can fail and combined with the rest of tools to get a perfect match.

Retail Industry Index ETF ‘XRT’ Weekly Chart

[IMG deleted]

The retail industry ETF ‘XRT’ is currently showing an incomplete 5 swings bearish sequence from 2015, which is part of 7 swings corrective structure and consequently we expect the ETF to keep fail lower as long as the pivot at December 20016 peak (48.3) is holding.

The current 3 waves bounce in XRT is looking to reach extreme area 42.95 – 45.59 where we expect sellers to appear, therefore around that area the stock market would find a short term peak and start at least a 3 waves correction to the downside.

Recap

The majority of retail traders are trying to Time the Peak in Stock Market to get in short side while the big players are looking for the next pullback to take place so they can add more Longs. Using an ETF like XRT to trade to short side and hedge your portfolio during market correction is a far better trade then trying to short Apple or Nasdaq.
 
Last edited by a moderator:

Elliottwave-Forecast

Master Trader
Feb 17, 2017
2,462
9
84
www.elliottwave-forecast.com
YM_F Dow Short Term Elliott Wave view

YM_F Dow Short term Elliott Wave view suggests that Intermediate wave (4) ended at 23204. Rally from there is unfolding as a leading diagonal Elliott wave structure. Minute wave ((i)) ended at 23464, Minute wave ((ii)) ended at 23241, Minute wave ((iii)) ended at 23599, Minute wave ((iv)) ended at 23432, and Minute wave ((v)) ended at 23616. The 5 waves leading diagonal rally also ended a higher degree Minor wave 1.

Minor wave 2 pullback is currently in progress to correct cycle from 11/15 low (23204) in 3, 7, or 11 swing before Index resumes the rally higher or at least bounce in 3 waves. The 50 – 76.4% retracement at 23302 – 23410 could be a potential area where Minor wave 2 may end, although the pullback doesn’t need to go that low. We don’t like selling the proposed pullback and expect buyers to appear once Minor wave 2 pullback is complete in 3, 7, or 11 swing provided pivot at 23204 low stays intact.

YM_F Dow 1 Hour Elliott Wave Chart
 

Elliottwave-Forecast

Master Trader
Feb 17, 2017
2,462
9
84
www.elliottwave-forecast.com
Nasdaq Elliott Wave Analysis 12.6.2017

Nasdaq Intraday Elliott Wave view suggests that Intermediate wave (3) ended with the rally to 6429.5. Intermediate wave (4) pullback remains in progress to correct cycle from 8/21 low (5753.6) in 3, 7, or 11 swing before the rally resumes. Intermediate wave (4) is unfolding as a double three Elliott wave structure where Minor wave W ended at 6246 and Minor wave X ended at 6391.75. Minor wave Y of (4) is currently in progress towards 6096.24 – 6209.28 area. Afterwards, Index should resume the rally higher or bounce in 3 waves at minimum. We don’t like selling the proposed pullback and expect buyers to appear from the above area for at least a 3 waves bounce provided that pivot at 8/21 low (5753.6) stays intact.

NQ_F Nasdaq 1 Hour Elliott Wave Chart
 

Elliottwave-Forecast

Master Trader
Feb 17, 2017
2,462
9
84
www.elliottwave-forecast.com
Sterling Volatility In Crucial Week of Brexit Talk

Sterling fell versus the dollar earlier this week as Brexit talk between the UK and EU falter at the last minute. British Prime Minister Theresa May is on the race to break the deadlock on the issue of Irish border. Irish border is one of the three key issues required to be settled before the U.K can move on to the next stage of Brexit talk. The next phase of talk involves trade negotiation at the crucial EU summit on December 14.

Early on Monday, Ms. May met with EU leaders Jean Claude Juncker and Donald Tusk in Brussels to settle the terms of Brexit with the EU. The UK is reportedly prepared to accept that Northern Ireland may remain in the EU’s custom union and single market. However, the potential agreement fell through at the last minute due to the intervention from Northern Ireland’s Democratic Unionist Party (DUP). The Unionist party currently provides the Tories with a working majority in the Commons. The DUP leader Arlene Foster has indicated that she could not accept any Brexit deal that separates the Northern Ireland from the rest of the UK.

Pound fell versus the dollar and reversed earlier rally as news about the failure to reach agreement started to surface


The EU says it will only recommend the start of talks about future trade arrangements when sufficient progress has been reached on three key issues: Status of expat citizens, the “divorce” bill, and the Northern Ireland border. On the “divorce bill”, the UK has increased its offer up to 50 billion Euros. On the issue of EU citizens in Britain, the UK agrees that they don’t need to pay to apply for settled status if they already have permanent residence. However, those who apply for the first time for the right to stay will need to pay some fees.

The Sterling will remain volatile ahead of the upcoming EU leaders summit on December 14. However, a “no deal exit” would mean substantial wealth losses in both the UK and EU. It’s therefore in everyone’s best interest to seek progress. Interestingly, despite the lingering uncertainties around the U.K’s exit from the EU, Sterling is still very resilient and ranks the top three best performing currency among G-10 peers this year


Sterling Technical Outlook
Technical positioning of two Sterling pairs confirm that the markets are becoming less sensitive to the ups and downs of the Brexit process. With some more breakthrough on the negotiation, Sterling could see more recovery in 2018, especially if the talks progress sufficiently to open up negotiations on trade.

We will take a look at two Sterling Crosses below: GBPAUD and GBPJPY

GBPAUD Daily Technical Chart


GBPAUD Daily chart shows a 7 swing bullish sequence from 10.7.2016 low and it appears the pair still could extend higher to 1.815 – 1.862 area, provided that pivot at 8/25 low (1.615) stays intact. Please note that these numbers refer to swing counts and do not denote Elliott Wave labels, such as impulsive 5 waves.

GBPJPY Daily Technical Chart


GBPJPY also show 3 swing bullish sequence from the same pivot at 10.7.2016 low. The pair also appears to have scope to extend higher towards 161 – 167 area, as far as pivot at 4/17 low (135.6) stays intact.
 

Elliottwave-Forecast

Master Trader
Feb 17, 2017
2,462
9
84
www.elliottwave-forecast.com
Nasdaq Elliott Wave Analysis 12-8-2017

Nasdaq Short Term Elliott Wave view suggests that Intermediate wave (3) ended at 6429.5 and Intermediate wave (4) pullback is proposed complete at 6231.75. Subdivision of Intermediate wave (4) is unfolding as a double three Elliott wave structure where Minor wave W ended at 6283, Minor wave X ended at 6391.75, and Minor wave Y of (4) ended at 6231.75. Index still needs to break above Intermediate wave (3) at 6429.5 for this view to gain validity. Until then, we still can’t completely rule out a break below Intermediate wave (4) at 6231.75 in a double correction.

Near term, cycle from 12/5 low (6231.75) is mature and expected to complete soon with Minute wave ((w)). Index should then pullback in Minute wave ((x)) to correct cycle from 6231.75 low in 3, 7, or 11 swing before Index resumes the rally. We don’t like selling the proposed pullback.

NQ_F Nasdaq 1 Hour Elliott Wave Chart
 

Elliottwave-Forecast

Master Trader
Feb 17, 2017
2,462
9
84
www.elliottwave-forecast.com
Nasdaq Elliott Wave Analysis: More Upside Favored While Above 6232.3

Nasdaq Short Term Elliott Wave view suggests that the Index remains bullish as far as pullbacks stay above Intermediate wave (4) at 6232.3. Rally from Intermediate wave (4) low unfolded as a double three Elliott Wave structure where Minor wave W ended at 6545.75 and Minor wave X is proposed complete at 6432.25 in the green box. Internal of Minor wave W unfolded as a double three Elliott Wave structure where Minute wave ((w)) ended at 6427.75, Minute wave ((x)) ended at 6383, and Minute wave ((y)) of W ended at 6545.75.

Internal of Minor wave X unfolded as a double three Elliott Wave structure where Minute wave ((w)) ended at 6463.25, Minute wave ((x)) ended at 6520.75, and Minute wave ((y)) of X ended at 6432.25. Near term, while dips stay above 6432.25, but more importantly as far as pivot at 12/5 low (6232.3) stays intact, expect Index to extend higher. Unless already long with a risk free trade from the green box area, we prefer to wait for the Index to break above Minor wave W at 6545.75 before buying the dips again. Until the Index breaks above Minor wave W at 6545.75, a double correction in Minor wave X still can’t be ruled out.

If the Index breaks below 12/26 low (6432.3) from here, then it could either form a triple three or double three correction from 12/19 peak. In the case of a triple three correction, Index should then extend lower to 6371 – 6391 area to end Minor wave X before the rally resumes. In the case of a double three correction, then Index can go to as low as 6234 – 6361 to end Minor wave X before buyers appear for at least a 3 waves bounce.

Nasdaq 1 Hour Elliott Wave Chart
 

Elliottwave-Forecast

Master Trader
Feb 17, 2017
2,462
9
84
www.elliottwave-forecast.com
Is the World coming to the end?

We now live in an interesting time. Every day we wake up with the news about either World Indices make all-time records or bad news about terrorist attack and nuclear test. Historically, humans have gone through these stages and we were able to withstand all these events. At ElliottwaveForecast, we try to ignore all these events because, at the end, we believe in the Market Nature or code.

The Market or World Indices is not ready for a crash and we have been saying that for a while. $SPX had a chance for a major correction when it reached the 100% extension at 2234.00 area, but the Index hasn’t done anything and keeps going higher. We believe that the Market works as a whole and that looking only at the $SPX or an individual Index is not enough. For the last 6 years, many Elliott wave Theory participants have been calling for a 50% crash and the crash has never happened.

We have been able to stay bullish during this period as we use other tools in our forecast including correlation and also sequences. However, we do understand that nothing runs in a straight line in trading and one day we will get an All-time correction in World Indices. Based on our time and sequence study, we are looking at the 2020-2022 period for the period when we could get major problems in the world and this will be used to justify the all-time World Indices correction.

Many followers may ask why we believe at year 2020-2022 as the period for major All-Time correction. At Ellitottwave-Forecast.com, we follow a system which includes Elliott wave Theory, cycles, sequences, time, distribution, correlations, and Fibonacci. We do not use Fundamental or sentiment, because it provides us neither an actionable trade nor ways to manage the risk.

After providing members with over 7000 charts every month, we discover that majority of news or events happen when the Market reaches the extremes areas, which in our charts is represented by the blue box. The Market follows sequences, cycles and always has a target in each sequence and cycles. Indices are within the Grand Super cycle and only $SPX and $DOW have reached the target, which is the 100% extension from all time low related to 2009. See the chart below.

$SPX Long Term Chart


Overall the idea is that the Grand Super cycle has more upside and the upside will come from Super cycle degree which started in 2009. Lets concentrate on 2009 and we can see many World Indices showing an incomplete sequence within this cycle, which started in 2009 and related to 2016. Therefore, even though $SPX and $DOW have reached the 100% extension as shown in the Blue Box within Grand Super cycle, the rest of Indices have not. This means that the Super cycle will push the Grand Super cycle higher.

Traders need to understand how to relate the cycles, measure extension targets and be able to adjust when the cycle has ended. As of right now, we do not see any possibility of a 50% crash or correction. All we see is a Cycle degree from 2016 low ending and thus correction will be only towards the cycle from 2016 low with more upside again after. Below charts of Hangseng Index and Nikkei show incomplete sequence in Super Cycle degree since 2009 and thus further upside is expected.

Hangseng Long Term Sequence Chart


Nikkei Long Term Sequence Chart


We also see time as an important aspect when it comes to forecasting. In this case, we see still some World Indices shy of the 100% in time. Usually in an ABC or WXY structure, the wave A is equal to C in time related to B. Similarly, wave W is equal to Y in time related to X. If we look at the Hangseng chart below, we can see how the Market still needs more time within the Y leg which started at 2008. The first 3 legs higher from 2008 low – 2015 high took 79 months, so the Y leg which started from 2016 low needs similar length of time. This is the reason why we believe that 2020 is the minimum time for the rally in World Indices as it is the minimum travel distance to make a reasonable parity with the first leg. See the chart below for Hangseng time cycles.


Elliott wave Theory is giving us the idea that only the cycle degree since 2016 will end when current rally in World Indices ends. Thus correction will be only to the cycle from 2016 low and not the all-time crash that many people are forecasting. $APPLE further provides us with this confirmation as it is showing a clear 5 waves advance from 2016 low which will provide a 3 waves back. The following two charts of Apple and Nasdaq both show the 5 waves higher from 2016 low.

Nasdaq Daily Elliott Wave Chart


Apple Daily Elliott Wave Chart


As we can see, three instrument have been used to determine 3 cycles degrees and we have used more that 1 Index or instrument to forecast the next few years of trading. As we have explained, we do not only look at 1 Index, we look at the whole Market and we can conclude that nothing significant should happen until 2020-2022 and we will see where the Market stands by then. However, glancing ahead in the political world, the 2020 US Election could be very significant, and it can drive the Market down into a huge pullback. This will all depend on the American Indices and the 1.618 level in the Grand Super cycle. Until then, decent corrections will happen, but nothing very significant such as 50% crash will happen in the World Indices. The strategy will stay the same until then, that is to relate the cycles, degrees and buying the dips. It looks like the World is not coming to the end just yet.
 

Elliottwave-Forecast

Master Trader
Feb 17, 2017
2,462
9
84
www.elliottwave-forecast.com
Nasdaq Elliott Wave Analysis: Ending Impulsive Move

Short Term Nasdaq Elliott Wave view suggests that the rally from 12/5 low unfolded as a double three Elliott Wave structure where Minor wave W ended at 6545.75 and Minor wave X ended at 6383.25. This week, the Index made a new high above Minor wave W at 6545.75, suggesting the next leg higher has started. Internal of Minor wave W unfolded as a double three Elliott Wave structure where Minute wave ((w)) ended at 6427.75, Minute wave ((x)) ended at 6383, and Minute wave ((y)) of W ended at 6545.75.

Internal of Minor wave X pullback unfolded as a triple three Elliott Wave structure where Minute wave ((w)) ended at 6463.25, Minute wave ((x)) ended at 6520.75, Minute wave ((y)) ended at 6432.25, and second Minute wave ((x)) of X ended at 6382.44. Near term, rally from 12/30 low (6383.25) is unfolding as an impulse Elliott Wave structure and could see more upside to end 5 waves up in Minute wave ((a)). Afterwards, the Index should pullback in Minute wave ((b)) in 3, 7, or 11 swing to correct cycle from 12/30 low (6382.44) before the rally resumes. We don’t like selling the Index and while Minute wave ((b)) dips stay above 6382.44, expect Index to extend higher.

Nasdaq 1 Hour Elliott Wave Chart
 

Elliottwave-Forecast

Master Trader
Feb 17, 2017
2,462
9
84
www.elliottwave-forecast.com
Gold is Ready for New Rally

Gold closed above $1,300 per ounce for the first time in 5 years as the U.S. dollar saw it’s worst decline over the past 14 years. Despite a strong start in 2017, XAUUSD spent most of the year in a sideways range around $1250 area before the final bounce came by year end to allow the precious metal to close for +13% in gains.

During the past 4 years, Gold has been repeating the same pattern over and over again, bottoming around December then rallying during the first quarter of the new year.

GOLD Previous December Lows


In 2017, Gold peaked in September at $1357 before starting a 3 months decline to correct the the rally from December 2016. I reached the 50% – 61.8 Fibonacci retracement area ( $1251 – $1226 ) where buyers where waiting to start a new cycle higher again in December. Up from there, XAUUSD rallied strongly breaking above $1300 to end the correction.

GOLD Daily Chart 2017


The move in metals led by Gold helped The Dow Jones Commodity Index to continue it’s bullish uptrend since 2016 low showing higher highs then higher lows and making a new high above September peak which opens a another bullish extension for the index supporting the rest of commodities to remain strong during 2018.

DJCI Daily Chart


Recap
Gold is looking for a strong rally during 2018 and breaking above September 2017 peak is the key level for the precious metal to target $1450 area. The move will be supported by the rest of commodities as DJCI has a bullish sequence to the upside following the same path.
 

Elliottwave-Forecast

Master Trader
Feb 17, 2017
2,462
9
84
www.elliottwave-forecast.com
Bitcoin: Technical and Psychological Perspective

Hello fellow traders, in this blog post, we will discuss the most hyped cryptocurrency Bitcoin in a technical as well as psychological perspective.

From the zero line, we are calling bitcoin completed in the super cycle blue wave (a) at 17/12/17 top. From that high, the market completed the first leg of 3 of a double correction. You can see the scenarios in the picture below (blue and black). For now, it needs to be seen which path bitcoin takes. The recent drop in bitcoin is for us nothing surprising. The market just pulled back 50% from 09/15/17 low. However, the drop was too short in time. Anyway, our forecast is still for more upside, nothing has changed so far for us. It only needs to be seen whether it can make a double correction or keeps just rallying to the upside. Either way, it should extend higher.

Bitcoin Daily Chart 12/31/17


But why do mainstream Media and many other traders think this the starting of a bubble, you might think. Well, that I want to explain in the next paragraph. It has something to do with traders emotions. Let’s have a look:


Generally, speaking we can say that markets are driven by either fear or greed. Why you may think. Well, it because these are the primal human emotions and markets and algos move accordingly to them. Above you can see the overall greed and fear cycle. Because of the recent drop and mainstream media hyping it. Weaker traders are overwhelmed by emotions. And their running trades.


The objective in trading crypto and other instruments are clearly defined. It’s all about achieving profits and not suffering losses. But what you should understand is that every winner faces a loser on the other side.


The truth is that we will have to deal with losses sooner or later again and again. And that is the problem for the 95% of the traders! An unsuccessful trader can NOT deal with losses. Traders tend to get overwhelmed with their emotions. Once they face a loss. Why is it like this? Well, by winning or losing money we have earned, we mostly become emotional. Why? Because a rising account puts us in joy and euphoria. Whereas a falling account will put us in scare and anxious. Overall, we can conclude that in trading perspective it’s very clear as I write this blog.


The possibility that bitcoin make new highs are there, we only change our view when the market tells us to do so. We do not change our forecast until the market tells us to change.
 

Elliottwave-Forecast

Master Trader
Feb 17, 2017
2,462
9
84
www.elliottwave-forecast.com
DAX Elliott Wave Analysis: Ending 5 Waves

DAX Short Term Elliott Wave view suggests that the Index ended Intermediate wave (X) pullback at 12731.46. The rally from there is unfolding as a 5 waves impulse Elliott Wave structure where Minutte wave (i) ended at 12943, Minutte wave (ii) ended at 12881.5, Minutte wave (iii) ended at 13408.5, and Minutte wave (iv) is proposed complete at 13328.5. Index has scope to extend 1 more leg higher in Minutte wave (v) before ending 5 waves up from 1/2 low (12731.46).

The move higher in Minutte wave (v) should also end Minute wave ((a)) of a larger degree. Afterwards, Index should pullback in Minute wave ((b)) to correct cycle from 1/2 low before the rally resumes. Chasing the Index higher from here is risky, but we don’t like selling the Index either. We expect buyers to appear during Minute wave ((b)) pullback in 3, 7, or 11 swing for an extension higher as far as pivot at 1/2 low (12731.46) stays intact.

DAX 1 Hour Elliott Wave Chart
 

Elliottwave-Forecast

Master Trader
Feb 17, 2017
2,462
9
84
www.elliottwave-forecast.com
Why Oil Should Be Supported in Weekly Chart

Hello fellow traders, in this blog post, we will discuss oil in a more bigger picture.

In the chart below, you can see crude oil futures on the weekly chart.

From the 02/08/2016 low, we can clearly see that the market has a potential 5 swing incomplete bullish sequence. It seems like that it is still in the fifth swing. The weekly target for us is between 68.53-86.82. Please note a 5 swing sequence is different than 5 waves impulse. Overall, we can conclude that we need more upside in oil and we suggest members to buy the instrument in 3-7-11 swings to the upside.

Oil Weekly Chart


With that said I want to present to you another important instrument we follow. It is called the Wisdomtree Continuous Commodity Index (GCC).

The GCC is basically a basket of diversified different commodity exposure. In the image below you can see the different components of the index.

GCC Components

Source: https://www.wisdomtree.com/etfs/alternative/gcc


But why do we need the GCC to forecast crude you might ask yourself. Well, that’s pretty easy to answer. Please have a look at the chart below. You can see the crude chart simply overlayed with the GCC index. You can clearly see, that both markets are correlating big time. Obviously, we need to understand that correlation is never pip by pip. This means that we have times where both the markets are diverging to each other. As you can see in in the arrows below. Oil is going higher whereas the GCC made new lows. But that doesn’t change the overall degree of correlation.

Oil vs GCC


Now let’s have a look at the GCC chart below. You can see that the market never broke above 07/04/2017, whereas oil broke the high. However, from the 06/19/2017 low, the GCC has, in fact, a bullish sequence, targeting the area of 19.89-20.85. Which makes it bullish against that level. This means that oil will also continue higher in a longer-term perspective.

GCC Weekly Chart


Elliottwave-Forecast

Master Trader
Feb 17, 2017
2,462
9
84
www.elliottwave-forecast.com
DAX Elliott Wave Analysis: Correction in Progress

DAX Short Term Elliott Wave view suggests that Intermediate wave (X) ended at 12731.46. Rally from there is unfolding as a 5 waves impulsive Elliott Wave structure where Minutte wave (i) ended at 12943, Minutte wave (ii) ended at 12881.5, Minutte wave (iii) ended at 13408.5, Minutte wave (iv) ended at 13328.5, and Minutte wave (v) of ((a)) is proposed complete at 13421.5. Index is correcting cycle from 1/2/2018 low within Minute wave ((b)) in 3, 7, or 11 swing before the rally resumes.

Internal of Minute wave ((b)) is unfolding as a zigzag Elliott Wave Structure where Minute wave (a) is proposed complete at 13219. While Minute wave (b) bounce fails below 13421.5, Index has scope to extend lower in Minute wave (c) of ((b)) to finish the zigzag correction. Afterwards, expect Index to resume higher as far as pivot at 1/2 low (12731.46) stays intact. We don’t like selling the Index and expect buyers to appear for more upside in 3, 7, or 11 swing, provided pivot at 1/2 low stays intact.

DAX 1 Hour Elliott Wave Chart
 

Elliottwave-Forecast

Master Trader
Feb 17, 2017
2,462
9
84
www.elliottwave-forecast.com
Elliott Wave Analysis: GBPUSD ended wave (4) correction

GBPUSD Short Term Elliott Wave view suggests that pair ended Intermediate wave (2) at 1.33 on 16 December 2017. Up from there, Intermediate wave (3) rally is unfolding as 5 waves impulse Elliott Wave structure where Minor wave 1 ended at 1.3613, Minor wave 2 ended at 1.3456, Minor wave 3 ended at 1.3943, Minor wave 4 ended at 1.3797, and Minor wave 5 of (3) ended at 1.434.

Pullback to 1.4084 today is proposed to have ended Intermediate wave (4) at 1.4084, but pair still needs to break above Intermediate wave (3) at 1.434 to confirm this view. Until then, a double correction in Intermediate wave (4) still can’t be ruled out. Near term, while pullbacks stay above 1.4084, but more importantly as far as pivot at 16 December 2017 low (1.33) stays intact, expect pair to extend higher. We don’t like selling the pair.

GBPUSD 1 Hour Elliott Wave Chart
 

Elliottwave-Forecast

Master Trader
Feb 17, 2017
2,462
9
84
www.elliottwave-forecast.com
One Market concept and The Elliott wave Theory

The Elliott wave Theory is a form of Technical analysis that traders use to analyse the market and forecast the trend and we will explain how we use it for One Market Concept. The Theory was developed by Ralph Nelson Elliott, around 1930. The Theory is based on the idea that the Market advances in 5 waves and pullbacks in 3 waves. As we mentioned earlier, the Theory was developed in 1930;s and most of the study was based in Indices and with only observation, Mr. Elliott did not have many tools or Instruments to use or to compare. Right now, we are in 2018 and the world has changed, also technology has come a long way. We at Elliottwave-forecast have noticed from years that the old Theory is not enough and can be used but needs to be combined with other tools and ideas. We have worked constantly for many years to improve the Theory and make it better. We are working to adapt to a more reliable and practical system.

One of the Ideas which we have developed is a concept of “One Market”. We will explain how it works and why it is needed to improve the accuracy of the forecast and hence the trading results. The Elliott wave Theory is famous for always having more than one possible path and we see many traders following a principal path, then they have a series of alternative paths just in case the principal path doesn’t work. From experience, we have concluded it’s hard to trade this way, so we add many tools to a system in order to help The Elliott wave Theory and remove the suggesting nature of the Theory. The idea that each move can be seen in different ways is not reliable enough for you to place your money on one idea or side of the Market. The One Market concept follows as many instruments around the group and divides the instruments into groups and follow cycles and sequences for each instrument and groups and most of everything correlated them into a higher degree path, which always is more reliable than that following only The Elliott wave Theory. We have been using this concept for a long time at [URL deleted] Elliottwave-forecast site and have been able to be in the right side most of the time and to forecast many big turns in the Market only base in the one market concept. The following example is showing the reality of current trading. We will be using the $USDZAR and $EURUSD as an example, both pairs are $USDX related and both the $USDX and $EURUSD base in the simple Elliott wave Theory can be labelled in 5 waves, if the waver is not following a dip system and only the Elliott wave Theory like was developed in 1930. The following chart show

USDZAR Daily Chart Elliott Wave Analysis – One Market Concept
ZAR-DAILY20180125084741-1.jpg


$USDZAR which shows 2 different cycles and bearish sequences since the peak in 2016, the instrument cannot be labeled as an impulse and can only be labeled as either ABC from the peak or an impulse wave 3, which both are viewed as bearish the pair. The other is the EURUSD from lows in 2016 have 2 paths, either a 5 waves advances and a huger declined or more upside into the 100% from lows in 2017, which should take it minimum at 1.32-1.4000 area.

EURUSD 5 waves advances
EURUSD-DAILY20180125142903-1.jpg


EURUSD ABC Elliott Wave Path

EURUSD-DAILY20180125143020-1.jpg


The 1930 Elliott wave Theory will not tell you which path will be valid, but the One Market concept is giving the ABC path a much higher probability than the 5 waves. This is an example of how we use Elliott wave Theory at Elliottwave-forecast which is different and most up to date than most traders, we are living in 2018 and using the tools which current times are providing to us.
 
Last edited by a moderator:

Elliottwave-Forecast

Master Trader
Feb 17, 2017
2,462
9
84
www.elliottwave-forecast.com
Elliott Wave Analysis: Dow Future in Correction

Dow Future Short Term Elliott Wave view suggests that the rally to 26690 ended Intermediate wave (3). Down from there, Intermediate wave (4) pullback is unfolding as a double three Elliott Wave structure where Minor wave W ended at 26121 and Minor wave X ended at 26314. Minor wave Y is in progress and while near term bounces stay below 26314, and more importantly below 26690, expect the Index to extend lower towards 25622 – 25754 area to end Intermediate wave (4) before Index resumes the rally or at least bounce in 3 waves. We don’t like selling the Index and expect buyers to appear from the above area for a 3 waves bounce at minimum.

YM_F Dow Future 1 Hour Elliott Wave Chart
 

Elliottwave-Forecast

Master Trader
Feb 17, 2017
2,462
9
84
www.elliottwave-forecast.com
Elliott Wave Analysis: DXY extended correction as triple three

DXY Short Term Elliott Wave view suggests that the decline to 88.44 ended Intermediate wave (3). Up from there, correction in Intermediate wave (4) is in progress as a triple three Elliott Wave structure. Rally to 89.64 ended Minor wave W, decline to 88.55 ended Minor wave X, Minor wave Y ended at 90.03 and Minor second wave X ended at 89.48. Near term, while pullbacks stay above 89.48, Index has scope to extend higher to 90.67 – 90.95 area to end wave Z of (4) before the decline resumes. We don’t like buying the Index and expect sellers to appear from the above area for a 3 waves pullback at least

DXY 1 Hour Elliott Wave Chart