Elliottwave-Forecast

Master Trader
Feb 17, 2017
2,460
9
84
www.elliottwave-forecast.com
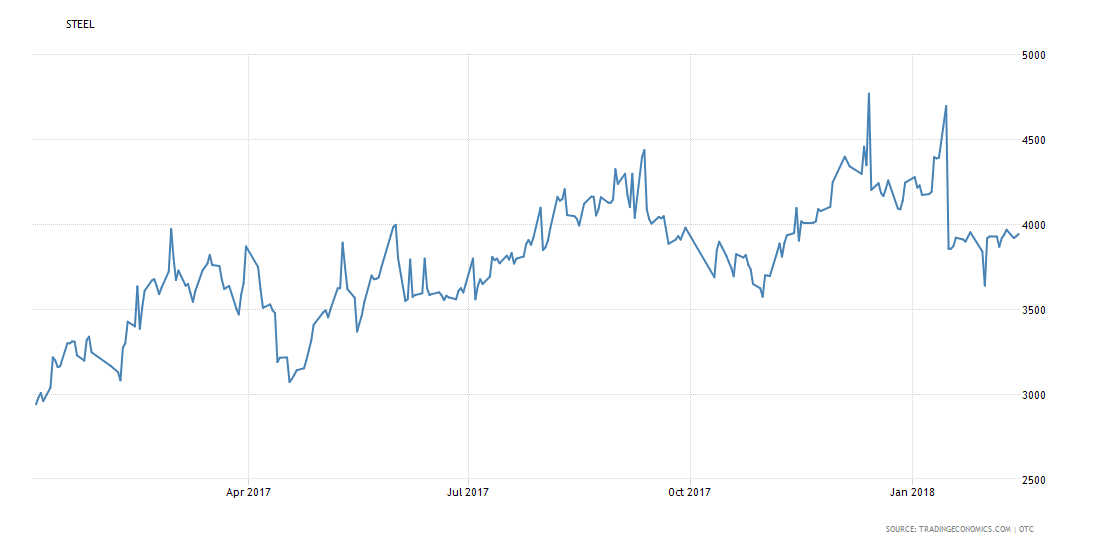
Dow Jones Iron & Steel Index DJUSST Bullish Sequence

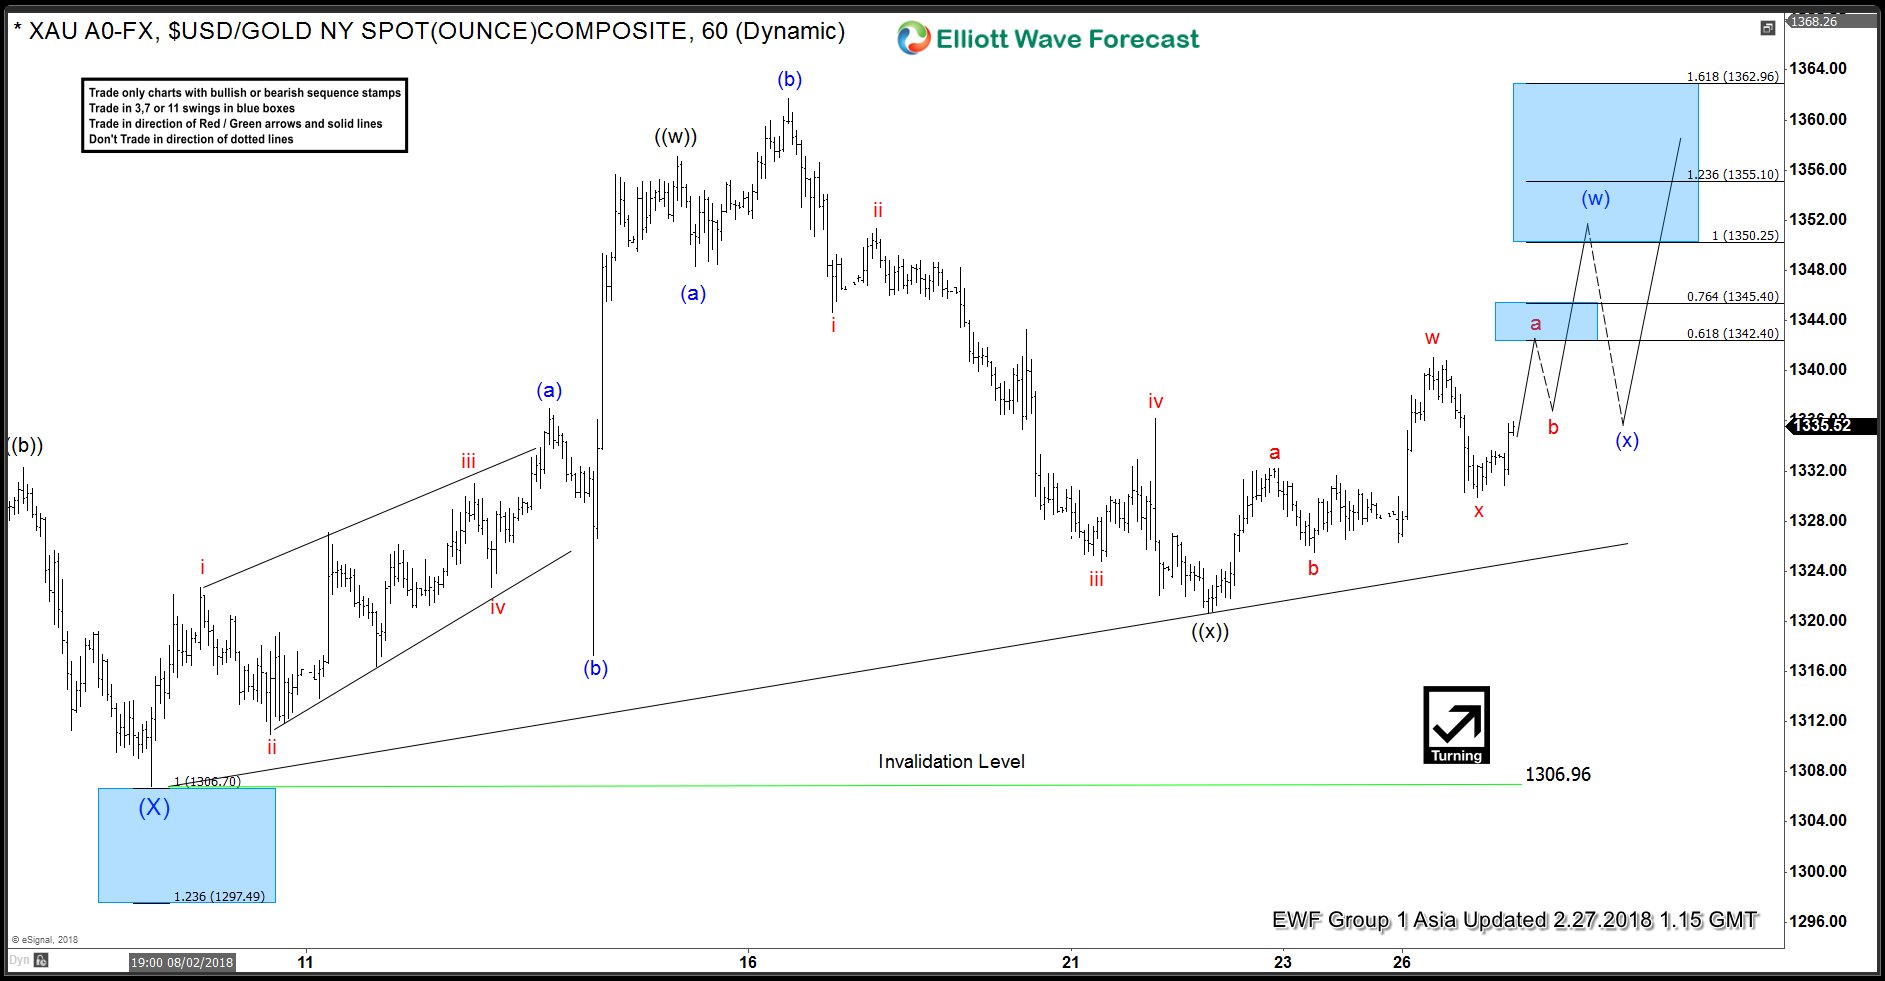
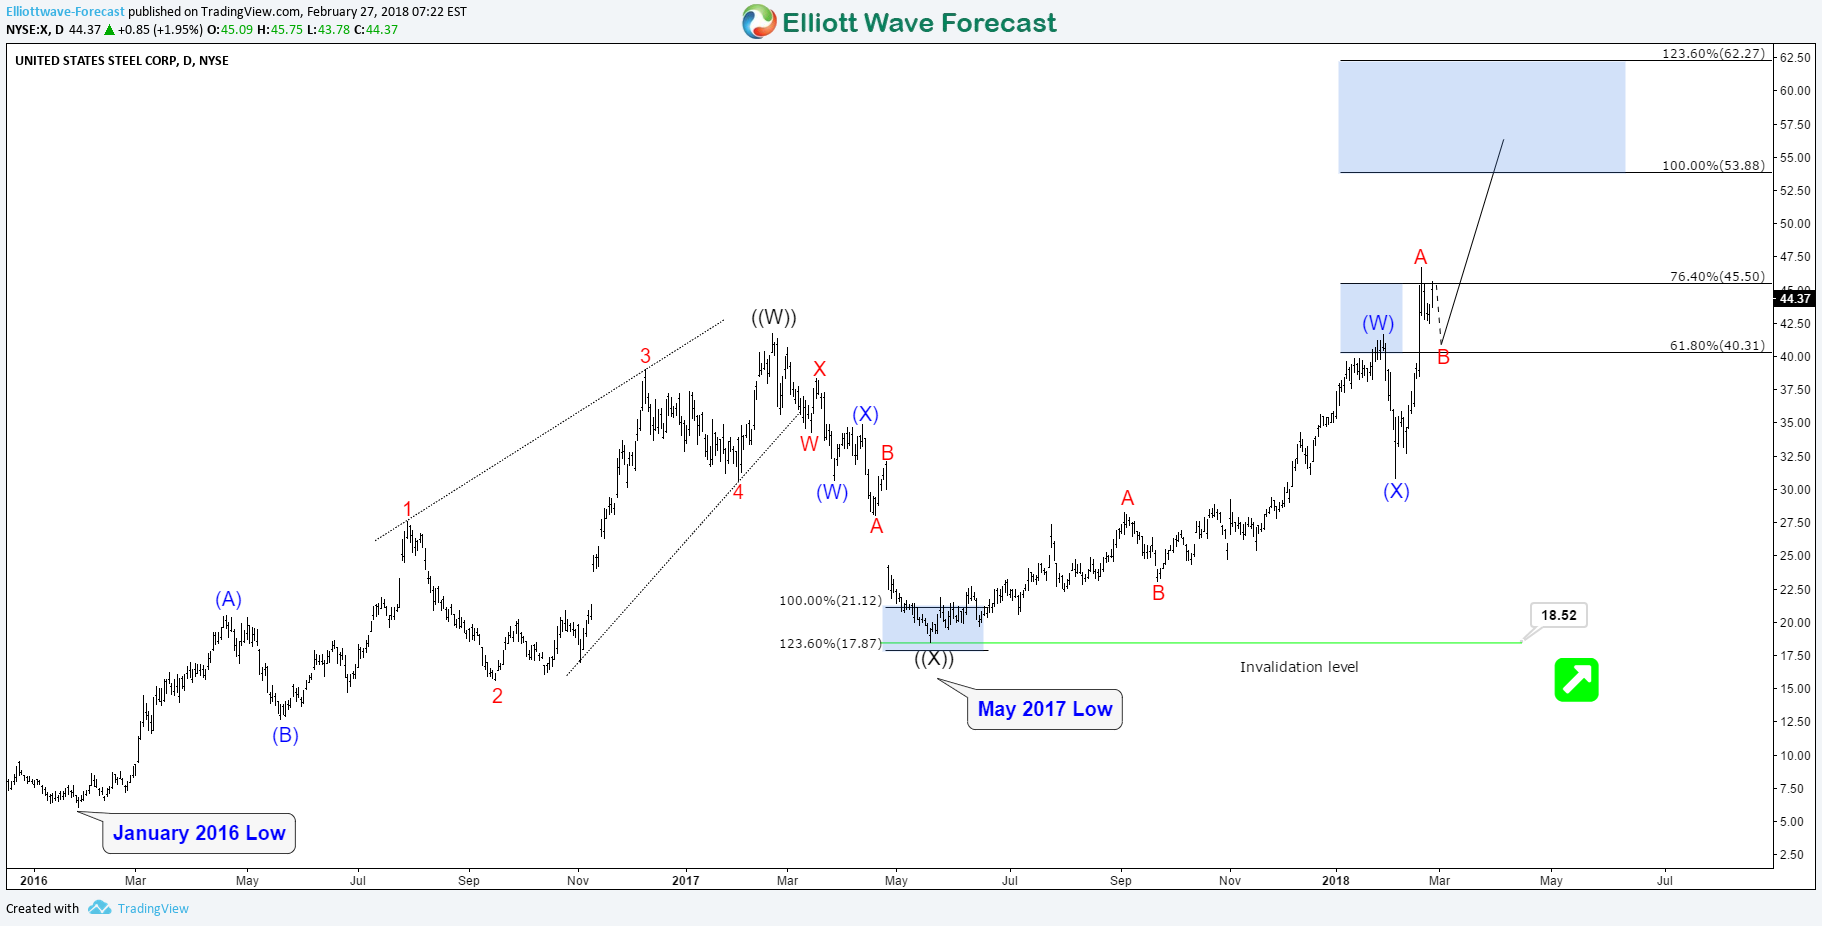
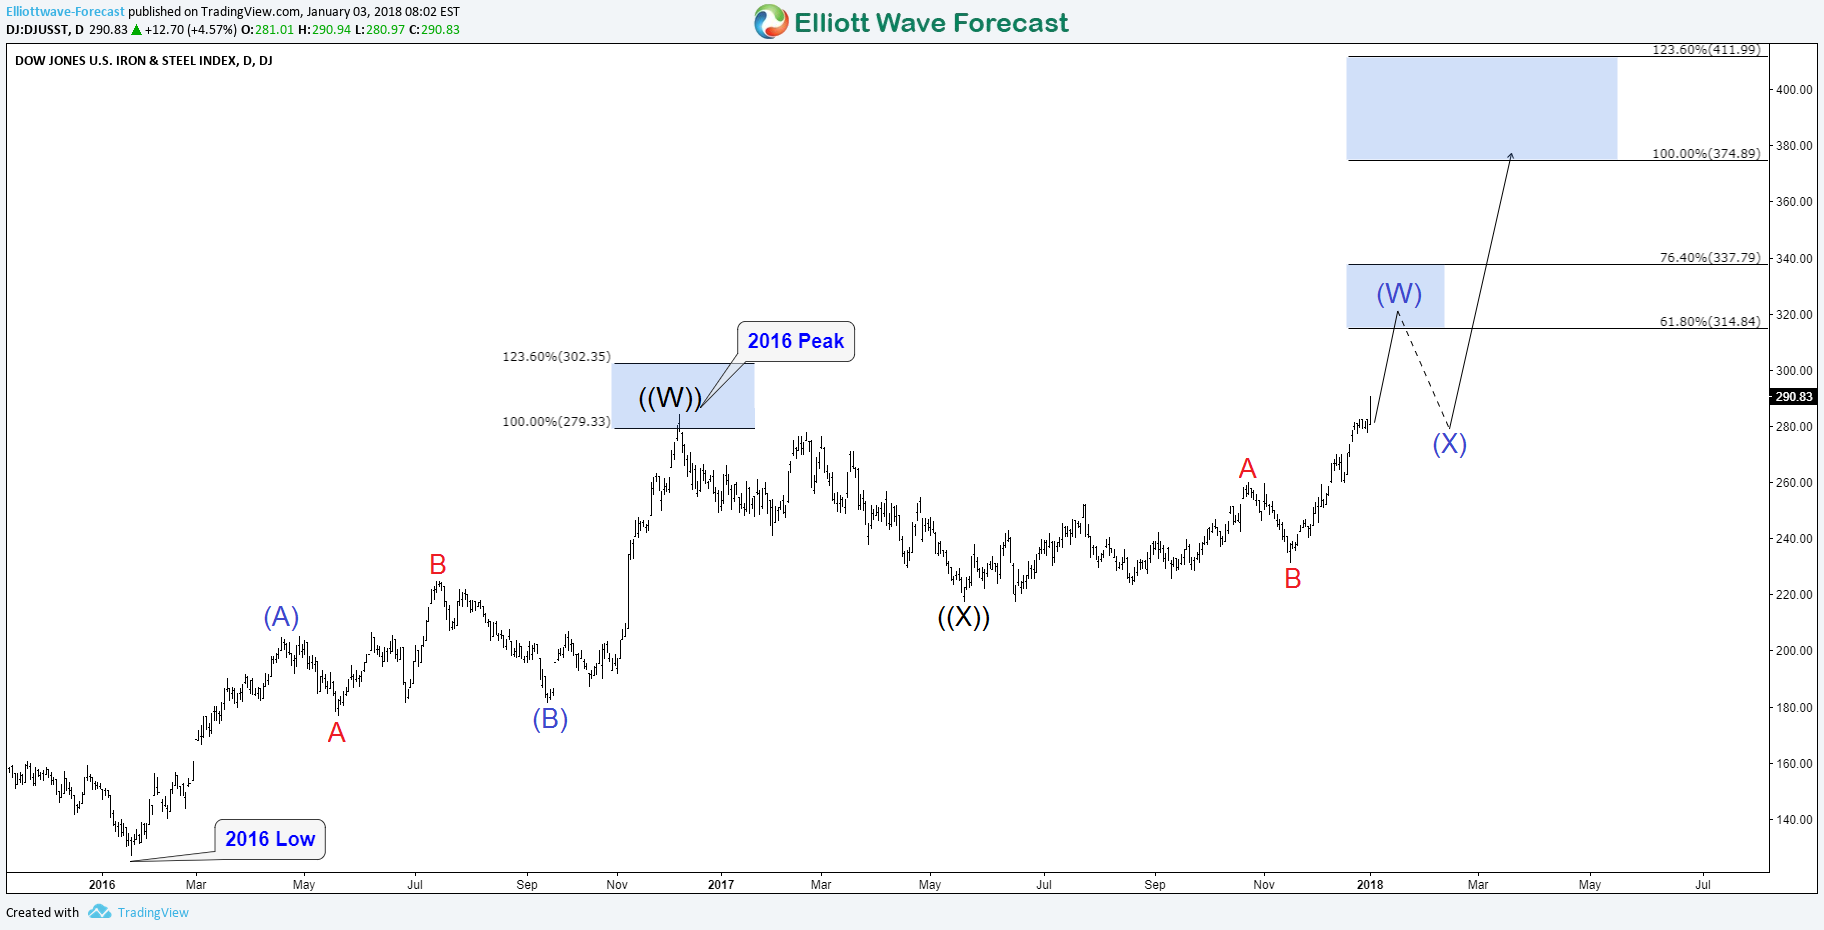
Last month, Dow Jones Iron & Steel Index DJUSST managed to break above December 2016 peak and created an incomplete bullish sequence from 2016 low calling for a move higher toward equal legs area $374 -$411. In the daily chart, we can see that the move higher was expected to pullback from the 61.8% – $76.4 fib ext area before resuming the trend to the upside.

DJUSST Daily Chart 01/03/2018


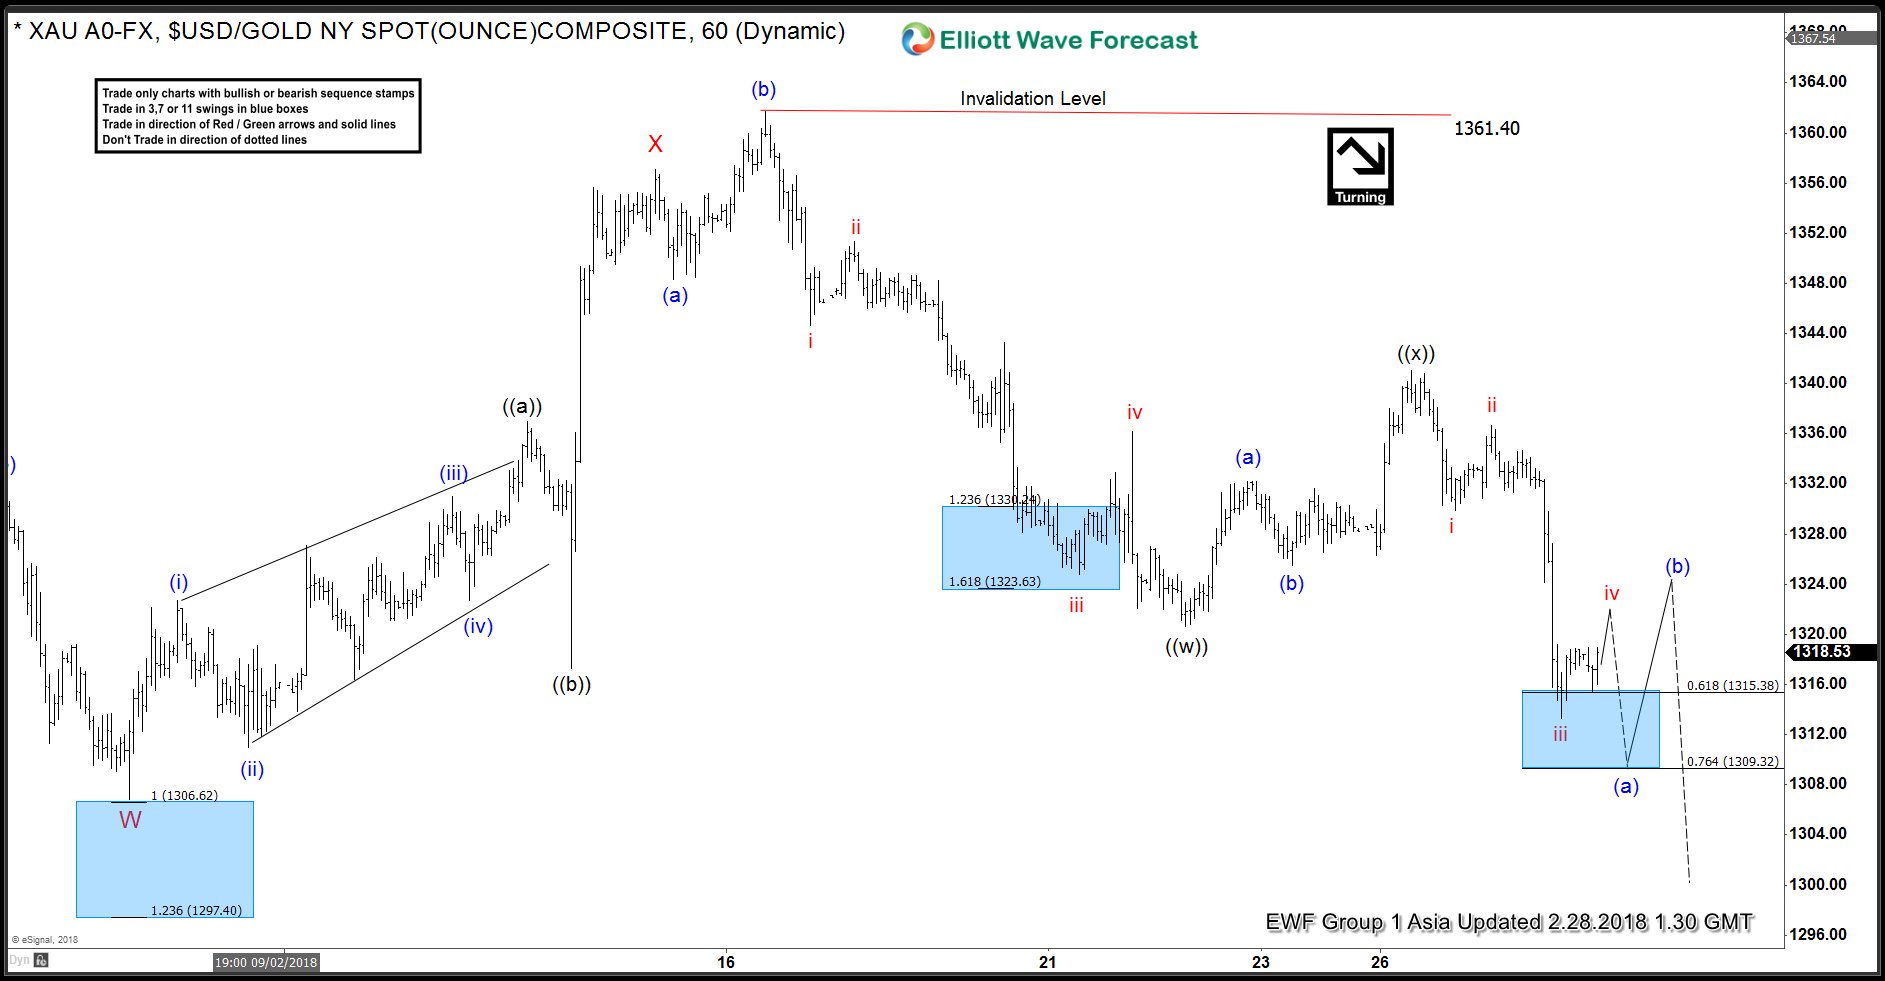
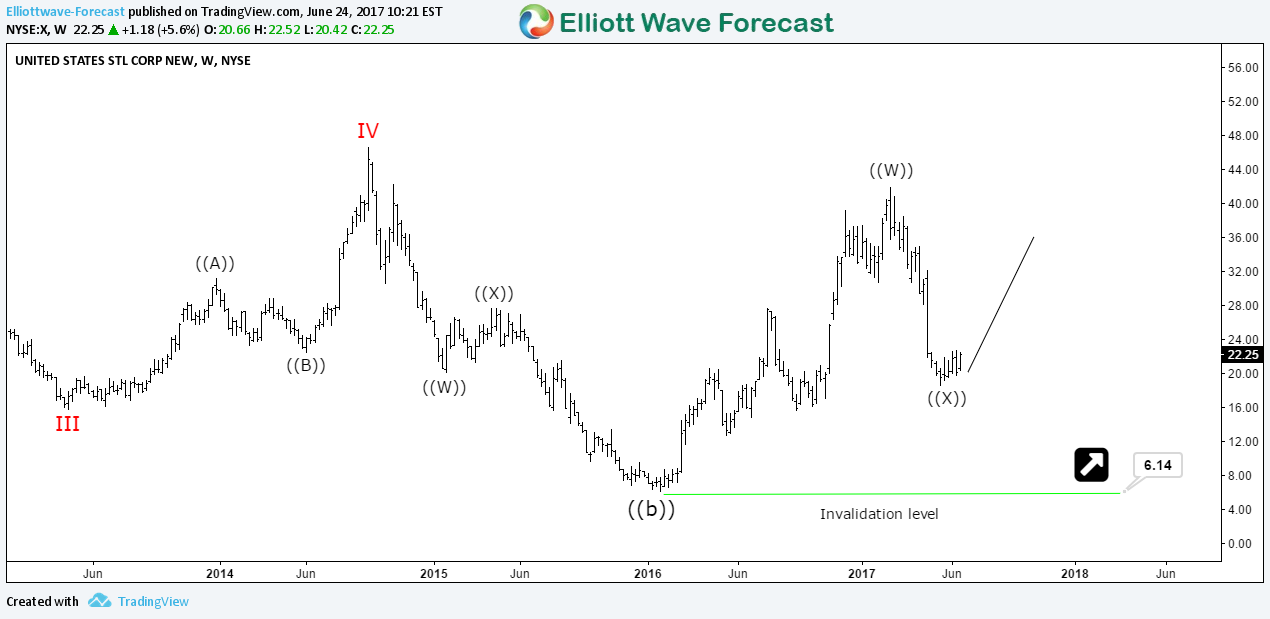
In the next chart, we can notice that DJUSST already ended the 5 swings higher slightly below the 61.8 % area and started the 6th swing pullback which we expect to find buyers in 3, 7 or 11 swings against June 2017 low then it will resume higher or bounce in 3 waves at least.

DJUSST Daily Chart 02/05/2018


Recap

Dow Jones Iron & Steel Index DJUSST is showing an incomplete 5 swings bullish sequence from 2016 low and expected to hold above June 2016 low. Any related stock to Iron & Steel will remain supported in 2018 until it ends the cycle from 2016.
 

Elliottwave-Forecast

Master Trader
Feb 17, 2017
2,460
9
84
www.elliottwave-forecast.com
Elliott Wave Analysis: Calling the low in place in Bitcoin

Bitcoin ticker symbol: ( BTCUSD ) Short Term Elliott Wave view suggests that the decline from December 17.2017 peak to February 05.2018 low (5920.72) ended the Super Cycle wave “(b)” lower. Above from there, the rally is unfolding as a leading diagonal Elliott Wave structure. Where Intermediate wave (1) ended at 9090.8 high as Elliott Wave Double three structure. Where internals of Intermediate wave (1) ended in Minor wave W at 8648.9 high and Minor wave X at 7543.3 low.

Below from 9090.8 high, the pair ended it’s short-term correction against 2/05 cycle in Intermediate wave (2) low at yesterday’s low 7820. The internals of Intermediate wave (2) unfolded as Elliott Wave Zigzag correction, where Minor wave A ended at 8170.9 and Minor wave B ended at 8589.1 high. Above from there, the pair is expected to resume the upside. However, a break of 9090.8 high remains to be seen to avoid the double correction lower in Intermediate wave (2) dip. Up from 9090.8 low, the rally is unfolding as Zigzag Elliott wave structure. Where Minute wave ((a)) ended in 5 waves at 8992.9 high, below from there, the pair is doing a short-term correction against 7820 low in 3, 7 or 11 swings within Minute wave ((b)) dip. Near-term, while dips remain above 7820 low and more importantly the pivot from 5920.72 low remains intact during the dips pair is expected to resume higher. We don’t like selling it into a proposed pullback.

BTCUSD 1 Hour Elliott Wave Chart
 

Elliottwave-Forecast

Master Trader
Feb 17, 2017
2,460
9
84
www.elliottwave-forecast.com
Elliott wave Analysis: USDJPY calling for more downside

USDJPY Short-term Elliott Wave view suggests that the rally to 110.48 high ended Intermediate wave (4) bounce on February 02.2018 peak. Below from there, the decline is unfolding as an Ending Diagonal Structure within Intermediate wave (5) lower. Where Minor wave 1 ended at 108.44 low as Zigzag structure, Minor wave 2 bounce ended at 109.77 in a Double three correction. Currently, Minor wave 3 remain in progress in a Double three correction, where internals of each leg is unfolding as Elliott Wave Zigzag pattern.

Where Minutte wave ((w)) ended at 108.03 low, Minute wave ((x)) ended at 108.87. Below from there Minute ((y)) of wave 3 remains in progress as zigzag structure. When Minutte wave (a) ended in 5 waves at 107.39 low and Minutte wave (b) ended at 107.89. Near-term cycle from 2/08 high (109.77) is mature already in Minor wave 3 lower after reaching blue box area (as shown on Chart). And pair can now start the Minor wave 4 bounce anytime soon in 3, 7 or 11 swings. However within the shorter-term cycles pair could extend lower towards 106.39-105.47 100%-161.8% Fibonacci extension area of (a)-(b) within ((y)) of 3 lower before a bounce in Minor wave 4 takes place. We don’t like buying the pair and as far as a pivot from 2/08 high 109.77 holds the wave 4 bounce should get rejected in 3, 7 or 11 swings for further downside extension in Minor 5 of (5) lower.

USDJPY 1 Hour Elliott Wave Chart
 

Elliottwave-Forecast

Master Trader
Feb 17, 2017
2,460
9
84
www.elliottwave-forecast.com
Elliott Wave Analysis: Gold Favored Higher Against 1306.96

Gold Short Term Elliott Wave view suggests that Intermediate wave (X) ended with the decline to 1306.96. Up from there, the yellow metal is rallying in 5 waves impulse Elliott Wave structure where Minutte wave (i) ended at 1337, Minutte wave (ii) ended at 1317.27, Minutte wave (iii) ended at 1357.12, Minutte wave (iv) ended at 1348.30, and Minutte wave (v) ended at 1361.72.

The 5 waves rally from 1306.96 to 1361.72 ended a higher degree Minute wave ((a)) of a zigzag Elliott Wave Structure. Minute wave ((b)) is currently in progress to correct cycle from 2/8 low in 3, 7, or 11 swing. The next extreme area in 7 swing comes at 1330.07 – 1334.15 where Minute wave ((b)) can end. Afterwards, as far as pivot at 2/8 low (1306.96) stays intact, expect Gold to extend higher. We don’t like selling Gold and expect buyers to appear at 1330.07 – 1334.15 area for a 3 waves bounce at least.

Gold 1 Hour Elliott Wave Chart
 

Elliottwave-Forecast

Master Trader
Feb 17, 2017
2,460
9
84
www.elliottwave-forecast.com
Baidu (BIDU) Resuming the Bullish Cycle

Baidu, Inc. (NASDAQ: BIDU) is one of the largest Chinese multinational technology companies specializing in Internet-related services & products and one of the premier AI leaders in the world.

Last week, Baidu has reported excellent results in Q4 which helped its stock to bounce +15%. Solid margin expansion and good developments on several fronts were on the headlines behind the recent rally which switched the opinion of many major investment firms to the bullish side.

We at Elliott Wave Forecast believe the market is ruled by the technical aspect and fundamental news comes in the second place to drive the price to a pre-determined direction. Therefore, we’ll take a look at the 4H chart of BIDU and analyse it using the Elliott Wave Theory.

BIDU 4H Chart 02.20.2018


Since October 2017 peak, BIDU did a typical 3 waves correction to the downside which reached equal legs area $211 – $198. Up from there the stock started a new cycle higher and looking to break above $275 peak later on to open a bullish sequence higher.

Currently, the stock ended 5 waves from the lows and expected to see another 3 waves correction which could take it back toward $230 – $218 area before resuming higher again. However, until the stock manage to break above October peak, a double correction lower can still take place.

To have a better perspective about BIDU, we’ll switch to the monthly chart :

BIDU Monthly Chart 02.20.2018


The Chinese giant Baidu, is showing an incomplete 5 swings bullish sequence from all time low which is different from the regular 5 waves move , as this advance is part of the double three 7 swings structure which suggest more upside toward the target at equal legs area $347 – $406.

BIDU seems to have already ended the 6th swing correction the the red wave x and started the next leg higher. The move will support the rest of related technology stock and we expect the sector to see more upside in the coming years until BIDU achieve its target.

Consequently, after a break above October 2017 peak, BIDU will have a short term bullish sequence and we would favor buying the pullbacks in 3 , 7 or 11 swings whenever available.
 

Elliottwave-Forecast

Master Trader
Feb 17, 2017
2,460
9
84
www.elliottwave-forecast.com
Elliott Wave Analysis: Gold Ending Correction

Gold Short Term Elliott Wave view suggests that the decline to 1306.96 ended Intermediate wave (X). The rally from there is unfolding in 5 waves impulse Elliott Wave structure. Minutte wave (i) ended at 1337, Minutte wave (ii) ended at 1317.27, Minutte wave (iii) ended at 1357.12, Minutte wave (iv) ended at 1348.30, and Minutte wave (v) ended at 1361.72.

The 5 waves rally also ended a higher degree Minute wave ((a)) of a zigzag Elliott Wave Structure. Minute wave ((b)) pullback is currently in progress to correct cycle from 2/8 low in 3, 7, or 11 swing. Minute wave ((b)) has reached 1323.39 – 1334.07 area where it could end. As far as pivot at 2/8 low (1306.96) stays intact, expect Gold to extend higher. We don’t like selling the yellow metal and expect buyers to appear at 1330.07 – 1334.15 area for a 3 waves bounce at least.

If pivot at 2/8 low (1306.96) fails, then Gold is doing a double correction in Intermediate wave (X). In this case, the yellow metal then can extend lower to 1289.48 – 1303.34 area where wave (X) can end and the rally resumes.

Gold 1 Hour Elliott Wave Chart
 

Elliottwave-Forecast

Master Trader
Feb 17, 2017
2,460
9
84
www.elliottwave-forecast.com
Elliott Wave Analysis: Gold Can do a Double Correction

Gold Short Term Elliott Wave view suggests that the yellow metal is still correcting cycle from 12.13.2017 low ($1236.30) as a double three Elliott Wave structure. Down from 1.25.2018 high ($1366.06), the decline is unfolding as a double three where Minor wave W ended at $1306.96 and Minor wave X bounce ended at $1361.81.

Minor wave Y is in progress and the subdivision is also unfolding as a double there where Minute wave ((w)) ended at $1324.75 and Minute wave ((x)) ended at $1336.21. Near term, while bounces stay below $1336.21, but more importantly below $1361.81, the yellow metal has scope to extend lower towards $1288.27 – $1302.28 to end Minor wave Y. Afterwards, expect Gold to resume the rally higher or at least bounce in larger 3 waves to correct cycle from 1.25.2018 high. We don’t like selling the proposed pullback

For this view to be gain more validity, Gold needs to break below Minor wave W at $1306.96. Until then, there is no guarantee Gold will extend lower and the right side remains higher as the yellow metal still has 5 swing bullish sequence from 12.15.2016 low. We do not like selling the proposed pullback and expect buyers to appear at $1228.27 – $1302.28 (if reached) for a 3 waves bounce at least.

Gold 1 Hour Elliott Wave Chart
 

Elliottwave-Forecast

Master Trader
Feb 17, 2017
2,460
9
84
www.elliottwave-forecast.com
World Indices: What Will Happen in 2020 – 2022

2020-2022 What will happen to the World Indices, A US Constitutional Crisis or Something Else?

The market move by Technical sequences, levels, and areas. Every day we see how the price moves from one area to another and relates the time frames from Subminutte cycles to the Grand Super cycles. The Idea is relating the degrees and creating sequences in each time frame in an impulse nature of 5-9-13 or corrective in 3-7-11. We track over 80 instruments at Elliottwave-Forecast and we related them then divided in groups each day. We understand the nature of the Market and we knew back in 2017, that in 2018 the World Indices will be ending a Cycle degree and another cycle degree will start and run into the 2020-2022 period when many cycles will reach the 100% extreme areas within the Grand Super cycle and also reach the time 100% extension within the Super cycle degree. The World Indices are running a Grand Super Cycle in which the $SPX and $INDU have reached the 100% and trading within a Blue Box, which in our system mean the extreme areas have been reached and as far as below the 1.618% extreme most of the time a cycle will end. We see many Indices like $FTSE, $NIKKEI, $DAX all needing an extension within the super cycle which started in 2009. As we mention before, we believe the Market is completed Technical, but for years we understand that something always happens to justify the move and we are afraid that this time around we need to be something bigger. The reason for this is because the correction in 2000-2009 in World Indices was a Gran super cycle correction and was justified by the Housing crisis which indeed many World Indices were at the same stage which we will be in 2020-2022 area, the big difference is that in 2 years we will be in a double degree Grand Super cycle, which make the same degree as 2000-2009, but double in size. Consequently, we are trying to find in the future which event can be taking place at that time. Looking ahead, we got The US presidential election in 2020, maybe a Constitutional crisis, maybe a huge conflict around the World will take place, we know and understand something big needs to happen because something will need to justify the biggest correction, we have ever seen.

NIKKEI Super cycle degree

NI225-sequences20180220152528.jpg

The Index like every World Index started a Super cycle degree in 2009, from there the Index ended a cycle degree at 2015 and started another one in 2016, Index just finished a Primary cycle degree and should do another one which should take 2 or more years, we labeled as RED 7, then will see 7 REDS and 3 BLACKS which can provided the biggest declined since 2009 minimum.

NIKKEI Super Cycle in Time

NI225-sequences20180220153505.jpg

The above chart show 2 cycles degree which will be equal in time and price by 2020-2022.

FTSE Super cycle degree

UKX-FTSE-sequences20180220145353.jpg


The Index is showing the same degree and cycle as $NIKKEI and we should see another leg higher into the 3 BLUE and 7 BLACKS which should end the cycle from 2009 low, the sequence is the same as $NIKKEI and most World Indices.

FTSE Grand Super cycle

UKX-FTSE-sequences20180220150100.jpg

The Index is showing a higher degree possible extreme situation by 2020-2022 and not only can be ending the Super Cycle, but also a Grand Super Cycle.

FTSE Super Cycle in Time
NI225-sequences20180220153505.jpg

Index is showing the same time sequences and cycles as many world Indices and 2020-2022 will align Time and price.

SPX Time and Price Super Cycle

SPX-WEEKLY20180220155318.jpg


The Index like every other World Indices is showing a Super cycle since lows at 2009 and related to 2016, the price target will be 3274 and time should be around 2020-2022.
Every World Indice shows the same degree in price and time, as always we believe in the one Market concept, but we also believe when the Market reaches those areas, some event will happen around the World to manipulate the crowd and created the illusion the even created the correction when it is otherwise.
 

Elliottwave-Forecast

Master Trader
Feb 17, 2017
2,460
9
84
www.elliottwave-forecast.com
Elliott Wave Analysis: Gold Ended Correction

We revise our Gold Short Term Elliott Wave view to a more aggressive one and call the decline to 2.8.2018 at $1306.8 ending Intermediate wave (X). For this view to get validity however, the yellow metal needs to break above Intermediate wave (W) at $1366.06. Until then, the alternate view can’t be ruled out that the yellow metal can do a double correction in Intermediate wave (X) towards $1228.27 – $1302.28 before the rally resumes.

Up from $1306.8, the rally is proposed to be unfolding as a zigzag Elliott Wave structure where Minute wave ((a)) ended at $1361.72 and Minute wave ((b)) is proposed complete at $1320.60. Near term, while pullbacks stay above there, and more importantly above $1306.8, expect Gold to extend higher. We don’t like selling the yellow metal. If Gold breaks below $1306.8, then the yellow metal is doing a double correction in Intermediate wave (X) and opens extension lower towards $1228.27 – $1302.28 where buyers should appear for at least a 3 waves bounce.

Gold 1 Hour Elliott Wave Chart
 

Elliottwave-Forecast

Master Trader
Feb 17, 2017
2,460
9
84
www.elliottwave-forecast.com
Gold Elliott Wave Analysis: 2.27.2018

Short Term Elliott Wave view in Gold suggests the decline to $1306.8 ended Intermediate wave (X). However, the yellow metal needs to break above Intermediate wave (W) at $1366.06 to rule out the possibility of a double correction in wave (X). Up from $1306.8, the rally is proposed to be unfolding as a double three Elliott Wave structure where Minute wave (w))) ended at $1357.12 and Minute wave ((x)) is proposed complete at $1320.60. Near term, while pullbacks stay above there, and more importantly above $1306.8, expect the yellow metal to extend higher. We don’t like selling the yellow metal. If Gold breaks below $1306.8, then Intermediate wave (X) is unfolding as a double correction and opens extension lower towards $1228.27 – $1302.28 where buyers should appear for at least a 3 waves bounce.

Gold 1 Hour Elliott Wave Chart
 

Elliottwave-Forecast

Master Trader
Feb 17, 2017
2,460
9
84
www.elliottwave-forecast.com
Elliott Wave Analysis: Gold in Double Correction

Revised Short Term Elliott Wave view in Gold suggests that the yellow metal is still correcting cycle from 12/13/2017 low ($1236.3) as a double three Elliott Wave structure. Up from 12/13/2017 low, Intermediate wave (W) ended at $1366.06 and Intermediate wave (X) pullback remains in progress as a double three.

Down from $1366.06, Wave W of (X) ended at $1306.80 and wave X of (X) ended at $1357.12. Near term, while bounces stay below $1361.4, expect Gold to extend lower in wave Y of (X) towards $1288.1 – $1302.11 before the rally resumes. We don’t like selling the yellow metal and expect buyers to appear from the above area for at least a 3 waves bounce if not an extension to new high.

Gold 1 Hour Elliott Wave Chart
 

Elliottwave-Forecast

Master Trader
Feb 17, 2017
2,460
9
84
www.elliottwave-forecast.com
CADJPY Elliott Wave Analysis: Correction Expected Before Lower Again

Short Term CADJPY Elliott Wave view suggests that the decline from 1/5/2018 high (91.58) is unfolding as an impulse Elliott Wave Structure where Minor wave 1 ended at 87.785, Minor wave 2 ended at 89.439, Minor wave 3 ended at 84.468, and Minor wave 4 ended at 85.24. Minor wave 5 remains in progress as an impulse Elliott Wave structure where Minute wave ((a)) of 5 is expected to end soon.

Minute wave ((a)) of 5 is unfolding as an impulse Elliott Wave structure where Minutte wave (i) ended at 83.82, Minutte wave (ii) ended at 84.82, Minutte wave (iii) ended at 82.94, and Minutte wave (iv) ended at 83.65. Pair has reached the minimum target in price and swing to end Minutte wave (v) of ((a)) although another extension lower can’t be ruled out. Expect pair to bounce in Minute wave ((b)) soon to correct cycle from 2/21 peak (85.24) in 3, 7, or 11 swing before the decline resumes. We don’t like buying the proposed bounce.

CADJPY 1 Hour Elliott Wave Chart
 

Elliottwave-Forecast

Master Trader
Feb 17, 2017
2,460
9
84
www.elliottwave-forecast.com
United States Steel Corporation $X Daily Elliott Wave View

United States Steel Corporation (NYSE: X) is the second largest steel domestic producer behind Nucor Corporation (NYSE: NUE) and also the world’s 24th largest steel producer.

Last year, Steel price surged higher reaching new all time high of 4772 in December gaining +60% before a correction took place. The price is expected keep rising in the coming years as the demand for steel in critical industries keeps increasing.


The world global steel production growth rate increased by 5.3% which is one of the major factors helping the related companies to continue its growth

During this month, the United States Steel Corporation stock X price surged 30% breaking above 2017 peak as the move accelerated after the U.S. Department of Commerce recommended metal import tariffs for the federal government.

The current Elliott Wave count for the stock is suggesting a double three structure taking place from January 2016 low and it’s also showing an incomplete 5 swing bullish sequence from May 2017 low. Both bullish cycles have a target around equal legs area $53 -$62 and as long as the stock remain above the recent February low $30.9 then it should continue it’s move to the upside.

X Daily Chart 2.27.2018


Last year, despite X loosing more than 50% during the correction lower , we expected the stock to remain supported and continue the rally similar to the one from 2016 low as the commodity sector has ended a multi-year correction from 2011 peak.

X Weekly Chart 24.6.2018


The current expected move higher in X will be supported by the fact that the Dow Jones Iron & Steel Index DJUSST is also sharing the same bullish sequence from 2016 low and both instrument should be rallying together during 2018 before reaching the target higher then ending that cycle. Consequently, investors and trader can still look for buying opportunities in any steel stock like X or NUE in 3 , 7 or 11 swings.
 

Elliottwave-Forecast

Master Trader
Feb 17, 2017
2,460
9
84
www.elliottwave-forecast.com
DAX Elliott wave view: Calling for another extension lower

DAX, the index from Germany, is correcting higher degree cycle from February 2016. Short-term Elliott Wave view suggests that the rally to 12597.51 at February 26.2018 ended Primary wave ((X)). Down from there, the decline unfolded as a 5 waves Elliott Wave Impulse Sequence which ended at 11730.50 and this 5 waves ended Intermediate wave (A) of a Zigzag structure in the higher degree. Zigzag structure is a 5-3-5 sequence and according to Elliott wave theory, after ending the first 5 waves, there should be a correction against the first leg in 3, 7 or 11 swings. The correction should then fail & extend in another 5 waves into the direction of first leg, i.e either Higher/lower. In DAX case, Intermediate wave (B) bounce should fail below 12597.51 high in 3, 7 or 11 swings for another extension lower in Intermediate wave (C) lower.

The internals of the decline from 12597.51 high ended Minor wave 1 at 12388, Minor wave 2 ended at 12515.5, Minor wave 3 ended at 11867, Minor wave 4 ended at 12006.50, and Minor wave 5 of (A) ended at 11725. The Index is currently correcting the cycle from 12597.51 high in Intermediate wave (B) bounce as Elliott Wave Zigzag correction, where Minor wave A ended at 12028 and Minor wave B ended at 11942.5. Above from there, Minor wave C of (B) remains in progress and expected to find sellers at 12242.73-12314.26, which is the 100%-123.6% Fibonacci extension area of A-B. The Index should extend lower in Intermediate wave (C) lower as far as pivot from February 26, 2018 peak (12597.51) remains intact. Also, it’s important to note that the 1-hour Chart below is showing bearish sequence tag, which represents the incomplete sequence to the downside. We don’t like buying it and once it reaches 12242.73-12314.26 100%-123.6% Fibonacci extension area of A-B, we are expecting sellers to appear again for 3 waves reaction lower at least.

DAX 1 Hour Elliott Wave Chart
 

Elliottwave-Forecast

Master Trader
Feb 17, 2017
2,460
9
84
www.elliottwave-forecast.com
DAX Elliott Wave View: Correction Ended

DAX is correcting higher degree cycle from February 2016. Short-term Elliott Wave view suggests that Primary wave ((X)) ended with the rally to 12597.51. Decline from there is unfolding as a Zigzag Elliott Wave structure where Intermediate wave (A) ended at 11725 and Intermediate wave (B) is proposed complete at 12270.50 high in New York earlier today. However, Index still needs to break below Intermediate wave (A) at 11725 to give validity to this view.

Zigzag structure is a 5-3-5 sequence and according to Elliott wave theory, after ending the first 5 waves, there should be a correction against the first leg in 3, 7 or 11 swings. The correction should then fail & extend in another 5 waves into the direction of first leg, i.e either Higher/lower. In DAX case, Intermediate wave (B) bounce appears complete at 12270.50, and Index should do another extension lower in Intermediate wave (C) lower.

The internals of Intermediate wave (A) unfolded as 5 waves Elliott Wave Impulse structure where Minor wave 1 at 12388, Minor wave 2 ended at 12515.5, Minor wave 3 ended at 11867, Minor wave 4 ended at 12006.50, and Minor wave 5 of (A) ended at 11725. Internals of Intermediate wave (B) unfolded as Elliott Wave Zigzag correction where Minor wave A ended at 12028, Minor wave B ended at 11942.5, and Minor wave C of (B) ended at 12270.50. Near term, while bounces stay below 12270.50, and more importantly below 12597.5, expect the Index to extend lower.

DAX 1 Hour Elliott Wave Chart
 

Elliottwave-Forecast

Master Trader
Feb 17, 2017
2,460
9
84
www.elliottwave-forecast.com
Elliott Wave Analysis: USDJPY Correction Should Fail Below 107.9

Short Term USDJPY Elliott Wave view suggests that the rally to 107.9 ended Minor wave X. Pair is expected to resume lower while bounces stay below this level. Down from Minor wave X at 107.91, Minor wave Y is in progress as a double three Elliott Wave Structure. Minute wave ((w)) of Y ended at 105.23 as a zigzag Elliott Wave pattern. Above from there, Minute wave ((x)) is currently in progress to correct cycle from February 21 peak as a double three Elliott Wave structure in 3, 7, or 11 swing.

Internal of Minute wave ((w)) of Y unfolded as a zigzag Elliott Wave pattern where Minutte wave (a) ended at 106.35, Minutte wave (b) ended at 107.67, and Minutte wave (c) of ((w)) ended at 105.23. Up from there, internal of Minute wave ((x)) is unfolding as a double three Elliott Wave Structure where Minutte wave (w) ended at 106.46 and Minutte wave (x) ended at 105.43. Near term, expect pair to extend higher towards 106.66 – 106.95 area to end Minutte wave (y) of ((x)), then as far as pivot at 2/21 peak (107.9) stays intact, expect pair to extend lower. We don’t like buying the pair.

USDJPY 1 Hour Elliott Wave Chart


Elliottwave-Forecast

Master Trader
Feb 17, 2017
2,460
9
84
www.elliottwave-forecast.com
Elliott Wave Analysis: Copper at Risk of Further Weaknesses

Copper (HG_F) broke below $3.5 low ($3.095) earlier today. As a result, it shows a bearish sequence from 2/16 peak ($3.272), risking for further downside. Current short term Elliott Wave view in Copper suggests that the rally to $3.272 on 2/16 ended Primary wave ((X)). The decline from there is unfolding as a double three Elliott Wave structure where Intermediate wave (W) ended at $3.0955 on 3/5 and Intermediate wave (X) ended at $3.178 on 3/6. Intermediate wave (Y) remains in progress, and while near term bounces stay below $3.178, Copper should see further downside.

Internal of Intermediate wave (W) unfolded as a zigzag Elliott Wave structure where Minor wave A of (W) ended at $3.164 on 2/21, Minor wave B of (W) ended at $3.243 on 2/23, and Minor wave C of (W) ended at $3.0955 on 3/5. A zigzag structure has a 5-3-5 subdivision and the chart is showing a nice 5 waves impulse Elliott Wave structure subdivision within Minor wave A and Minor wave C.

Intermediate wave (X) correction from $3.0955 low has a subdivision of a zigzag Elliott Wave structure. Minor wave A of (X) ended at $3.142, Minor wave B of (X) ended at $3.129, and Minor wave C of (X) ended at $3.179. Decline from $3.179 appears to be unfolding as a zigzag with first leg Minor wave A subdivided as 5 waves. Minute wave ((i)) of A ended at $3.1175, Minute wave ((ii)) of A ended at $3.1445, Minute wave ((iii)) of A ended at $3.0705, Minute wave ((iv)) of A ended at $3.087, and Minute wave ((v)) of A appears complete at 3.055. Minor wave B bounce is in progress to correct cycle from 3/6 high in 3, 7, or 11 swing. While Minor wave B bounce stays below $3.179, expect Copper to extend lower.

Copper 1 Hour Elliott Wave Chart
 

Elliottwave-Forecast

Master Trader
Feb 17, 2017
2,460
9
84
www.elliottwave-forecast.com
Bitcoin BTCUSD Elliott Wave View Calling for Rally toward $15.000

Since all time high in December 2017, Bitcoin BTCUSD ( Value in US Dollar ) dropped 70% before finally bottoming around $6590 on the 6th of February 2018. The big decline drove fear into the digital market as many new investors / traders lost their money during that period so they decided to stay away and avoid further losses because the mainstream media was again calling Bitcoin as a busted Bubble even though they were amazed by the Rise of Cryptocurrencies in 2017.

During the recent 2 months , Bitcoin daily confirmed transaction has been dropping significantly hitting 2 years low despite a +90% bounce seen in BTCUSD since February low. Data from different brokers show that current consumer desire to ‘hodl’ on to one’s bitcoins and watch the market, rather than cash out or convert into currencies.

Bitcoin Transaction per day since 2016

Therefore, the cryptocurrency market have been seeing lower volume in trading and cheaper fees which didn’t encourage investors yet to jump again into the digital world of Bitcoin which continued to struggle to regain its value as the sideways price action continue trapping it between $11.000 and $8.000.

Betting on the price of Bitcoin without owning any existed already by either using an unregulated futures exchanges or by trading the Bitcoin Investment Trust Fund (GBTC), which essentially functions as an ETF, and that was an early solution for people to avoid using directly bitcoin but those methods have failed to attract institutional investors until we saw the introduction of Bitcoin futures in CME and CBOE.

BTC Futures & ETF track the price of bitcoin despite some difference in time as the cryptocurrency market is always open ( 24 Hours , 7 days a week) while those instruments depends on the exchanges schedule which have fixes trading hours and may cause some gaps in price compared to the real data.

BTCUSD Overlay With BTC_F & GBTC


On the above chart, we notice the 3 instruments sharing the same cycles and swings which can allow regular traders to have exposure to this new market as it’s considered as another financial instrument. For that reason we’ll take a look at the current technical picture for Bitcoin Futures using Elliott Wave Theory:

BTC Futures 4H Chart 03.09.2018


Since the introduction of Bitcoin futures in December 2017, the price dropped for 2 months before finally bottoming on February 2018. Up from there, the instrument started a new cycle to the upside meaning a wave ((1)) already in place and wave ((2)) currently ending around short term equal legs area $9420 – $8022, then it’s expected to resume the rally toward new highs. However Bitcoin could be also just doing a corrective 3 waves structure and the next leg higher will fail below the previous December peak.

Consequently, the two scenarios is suggesting at least another leg higher to take place which would be targeting the 50% – 61.8% Fibonacci retracement levels ( $13.329 – $15.064 ) of the previous decline then depending on the reaction from there we can decide how the next leg would occur.
 

Elliottwave-Forecast

Master Trader
Feb 17, 2017
2,460
9
84
www.elliottwave-forecast.com
Breakthrough in Brexit Negotiation Boosts Poundsterling

March 20, 2018 By EWFHendra

Brexit Transition Period Agreement Breakthrough
Yesterday the UK has struck a deal with the EU to the Brexit transition period. The transition period is the 21 month period which starts from 29 March 2019 (official Brexit day) to 31 December 2020. UK Prime Minister Theresa May likes to call this period an implementation phase. This period allows businesses time to prepare for new arrangement before the eventual permanent arrangements between UK-EU relations kick in. During this transition period, the UK will continue to enjoy the single market and custom union. However, The British government needs to concede defeats in a series of demands. The UK will lose decision making ability during this period and follow EU rules. In addition, the UK also concedes on its demand on the rights of expatriate citizens and emergency backstop option on Irish border.

In the issue of the right of expatriate citizens, British citizens and European citizens arriving in the UK during the transition period will have the same rights to those who arrive before Brexit. The UK also agrees on the emergency “backstop” option to avoid hard border in Ireland. This emergency option says that if Britain and the EU could not find a solution to avoid custom barriers and other mechanisms which renew tensions in Northern Ireland, the province should follow EU economic rules even if the rest of the UK does not.

Brexit secretary David Davis said the agreement in transition period should provide considerable assurance to individuals and companies affected by Brexit. Mr. Davis also hoped that with this breakthrough, negotiations on the UK’s future relationship with the EU, including a free trade arrangement, can start as soon as possible. The aim is for a deal to be agreed in the Autumn to allow time for EU member states and the UK Parliament to ratify it before Brexit in March 2019. Prime Minister’s Theresa May’s priority has been to secure a political accord to ease the concern of businesses operating in UK. To this end, the breakthrough in the negotiation has achieved the purpose. This accord is now likely to be supported by the leaders of the 27 EU member states at the summit on Friday.

The financial markets love this agreement. Poundsterling receives a boost against other major currencies. GBPUSD rallies 1% against to $1.408 while EURGBP drops 0.8% 0.8746.

EURGBP 4 Hour Elliott Wave Chart 3.12.2018


$EURGBP Short term Elliott Wave view suggests that cycle from 10.12.2017 high (0.9033) remains active as a double three Elliott Wave structure. Down from 10.12.2017 high, Minor wave W ended at 0.8687 and Minor wave X ended at 0.8968. Subdivision of Minor wave W unfolded as a Flat Elliott Wave structure where Minute wave ((a)) ended at 0.8732, Minute wave ((b)) ended at 0.9014, and Minute wave ((c)) of W ended at 0.8687. Subdivision of Minor wave X also unfolded as a Flat Elliott Wave structure where Minute wave ((a)) ended at 0.8929, Minute wave ((b)) ended at 0.8685, and Minute wave ((c)) of X ended at 0.8968.

After ending Minor wave X at the extreme area (blue box), pair accelerated the move lower upon the news of successful Brexit transition period negotiation. Now while bounces stay below 0.8968, pair should extend lower in Minor wave Y. However, to add validity to this view, pair needs to break below 1.25.2018 low (0.8685).
 

Elliottwave-Forecast

Master Trader
Feb 17, 2017
2,460
9
84
www.elliottwave-forecast.com
NZDJPY Selling the Elliott Wave bounces

March 20, 2018 By [URL deleted] Hassan Sheikh

In this Technical blog, we are going to take a quick look at the past [URL deleted] Elliott Wave Chart performance of NZDJPY. Which we presented to our clients at [URL deleted] elliottwave-forecast site. We are going to explain the structure and the forecast. As our members know, we were pointing out that the sequence from July 27.2017 peak is incomplete to the downside. Therefore, we advised our members to avoid buying into proposed bounces and should rather look for selling opportunity based on the incomplete bearish sequence to the downside from July 2017 peak. So let’s take a quick look at the past 1-hour performance of our charts below.

NZDJPY 12 March 2018 1 Hour Elliott Wave Chart

Above is the 1-hour Chart from March 12.2018 from New York update, in which the pair is showing a recovery in Intermediate wave (X) bounce as [URL deleted] Elliott Wave Double Three structure. And that moment in time, the pair was having a 5 swing incomplete corrective sequence from 75.91 blue wave (W) low. Which thus supported the double three structure for another push higher to (78.53-78.95) 100%-123.6% Fibonacci extension area of red W-X to complete the 7 swing structure from blue (W) low (75.91) as far as it traded above 76.77 red wave X low before it resumes the decline.

NZDJPY 13 March 2018 1 Hour Elliott Wave Chart


While above 76.77 red wave X low the pair then made a push higher as expected to our blue box area (potential seeling zone) at 78.53-78.95 to end the 7 swing structure from blue (W) low (75.91). Thus offered our client’s a good selling opportunity for 3 wave reaction lower at least as the right side of the market was selling the bounces. Also, it’s important to note that the 1-hour Chart above is showing bearish sequence tag, which represents the bearish trend to the downside.

NZDJPY 19 March 2018 1 Hour Elliott Wave Chart from London update


Here’s the 1-hour latest Chart from 19 March London update, showing the reaction lower in the pair after reaching our blue box area at 78.53-78.95. The pair then formed the peak in intermediate wave (X) bounce at 78.63 and made a nice decline lower for almost 200+ pips in profit so far. Thus allowed our members to create a risk-free position in the trade (where we advised member’s to lock the profit by putting the stop loss on entry level).

Currently, as far as bounces fail below 78.63 level pair is expected to see more downside to reach our target at 73.73-71.89 area. However, pair still needs to see a break below 85.91 intermediate wave (W) low to confirm the next extension lower in the pair and until than double correction in intermediate wave (X) bounce can’t be ruled out yet. Which if it happens then we would like to be seller’s again at the next set of equal legs area.

Keep in mind that the market is dynamic and the view could change in the meantime. Success in trading requires proper risk and money management as well as an [URL deleted] understanding of Elliott Wave theory, cycle analysis, and correlation. We have developed a very good trading strategy that defines the entry.
 
Last edited by a moderator: