Elliottwave-Forecast

Master Trader
Feb 17, 2017
2,462
9
84
www.elliottwave-forecast.com
USDJPY Elliott Wave view: Resuming lower

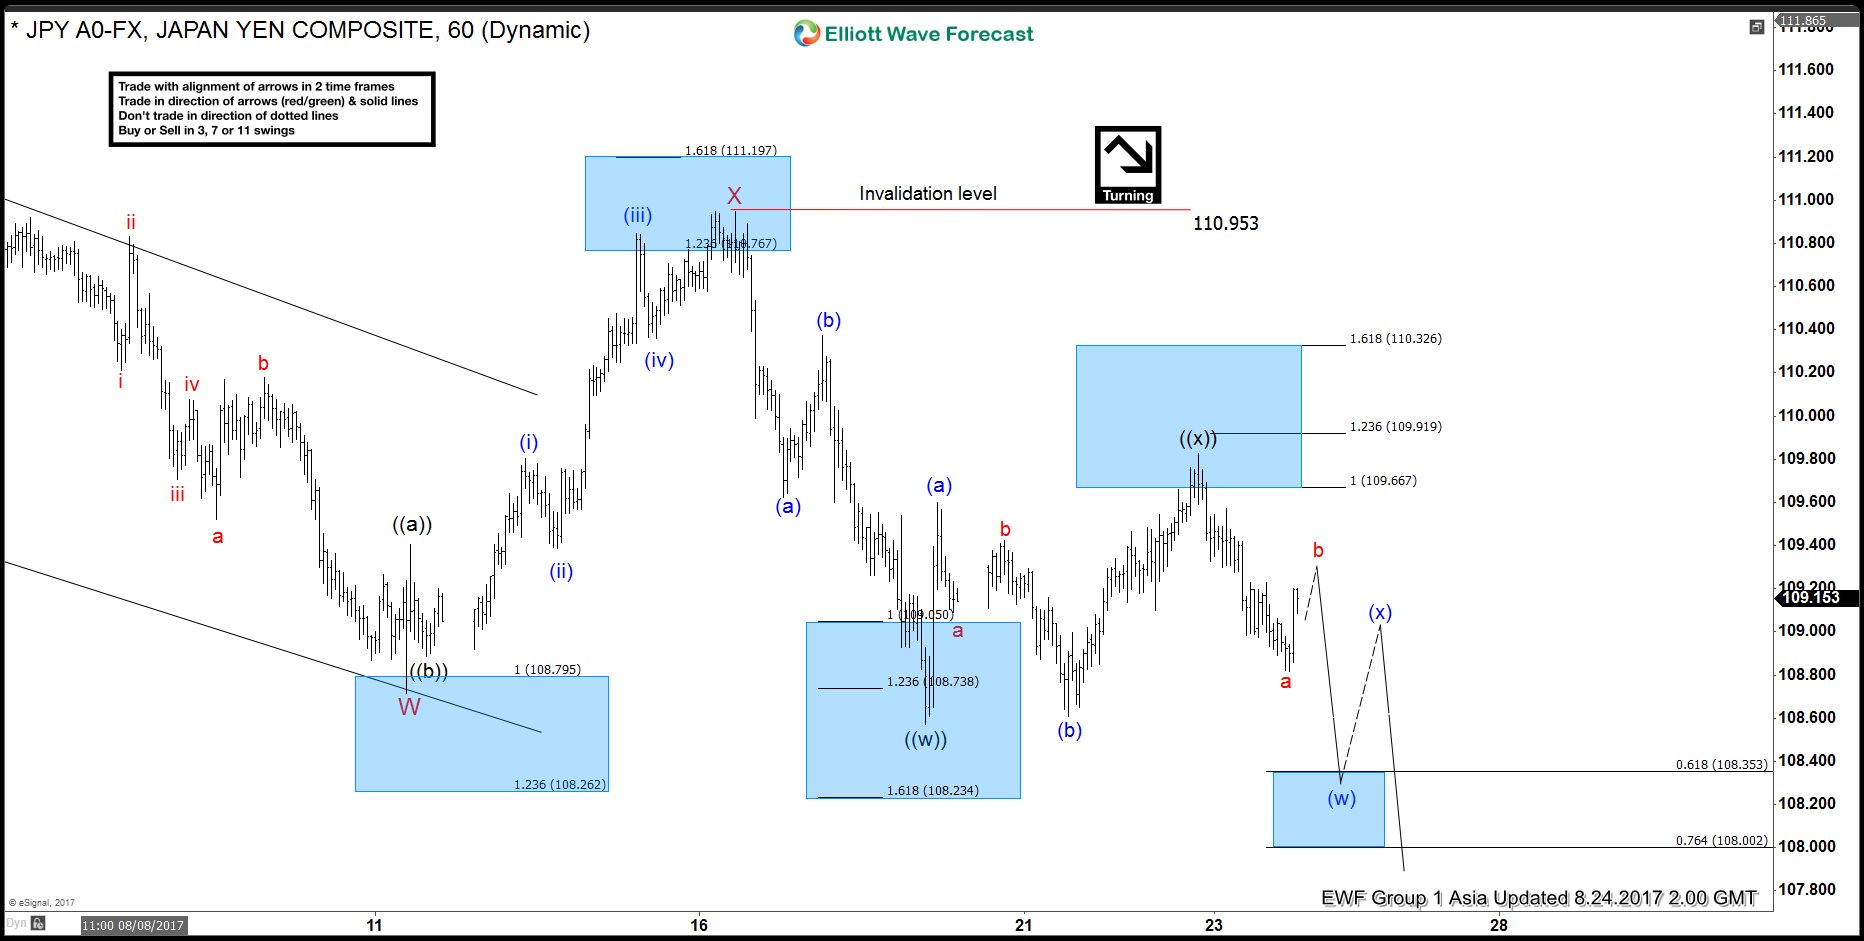
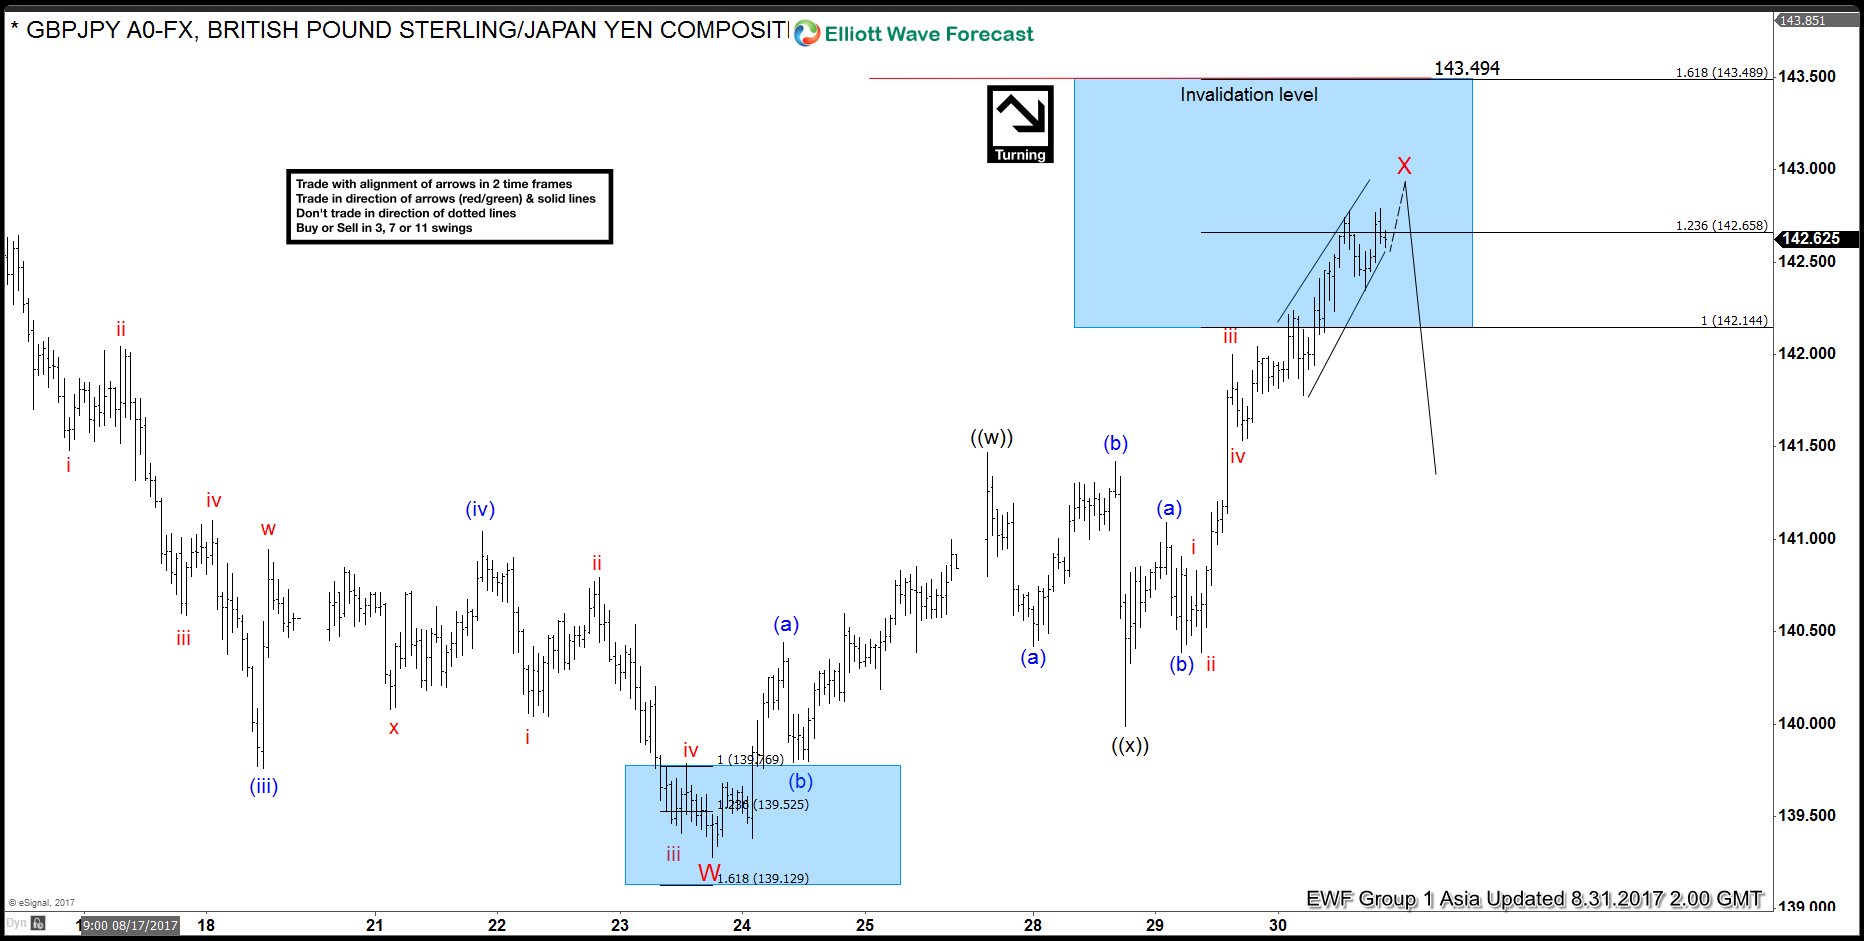
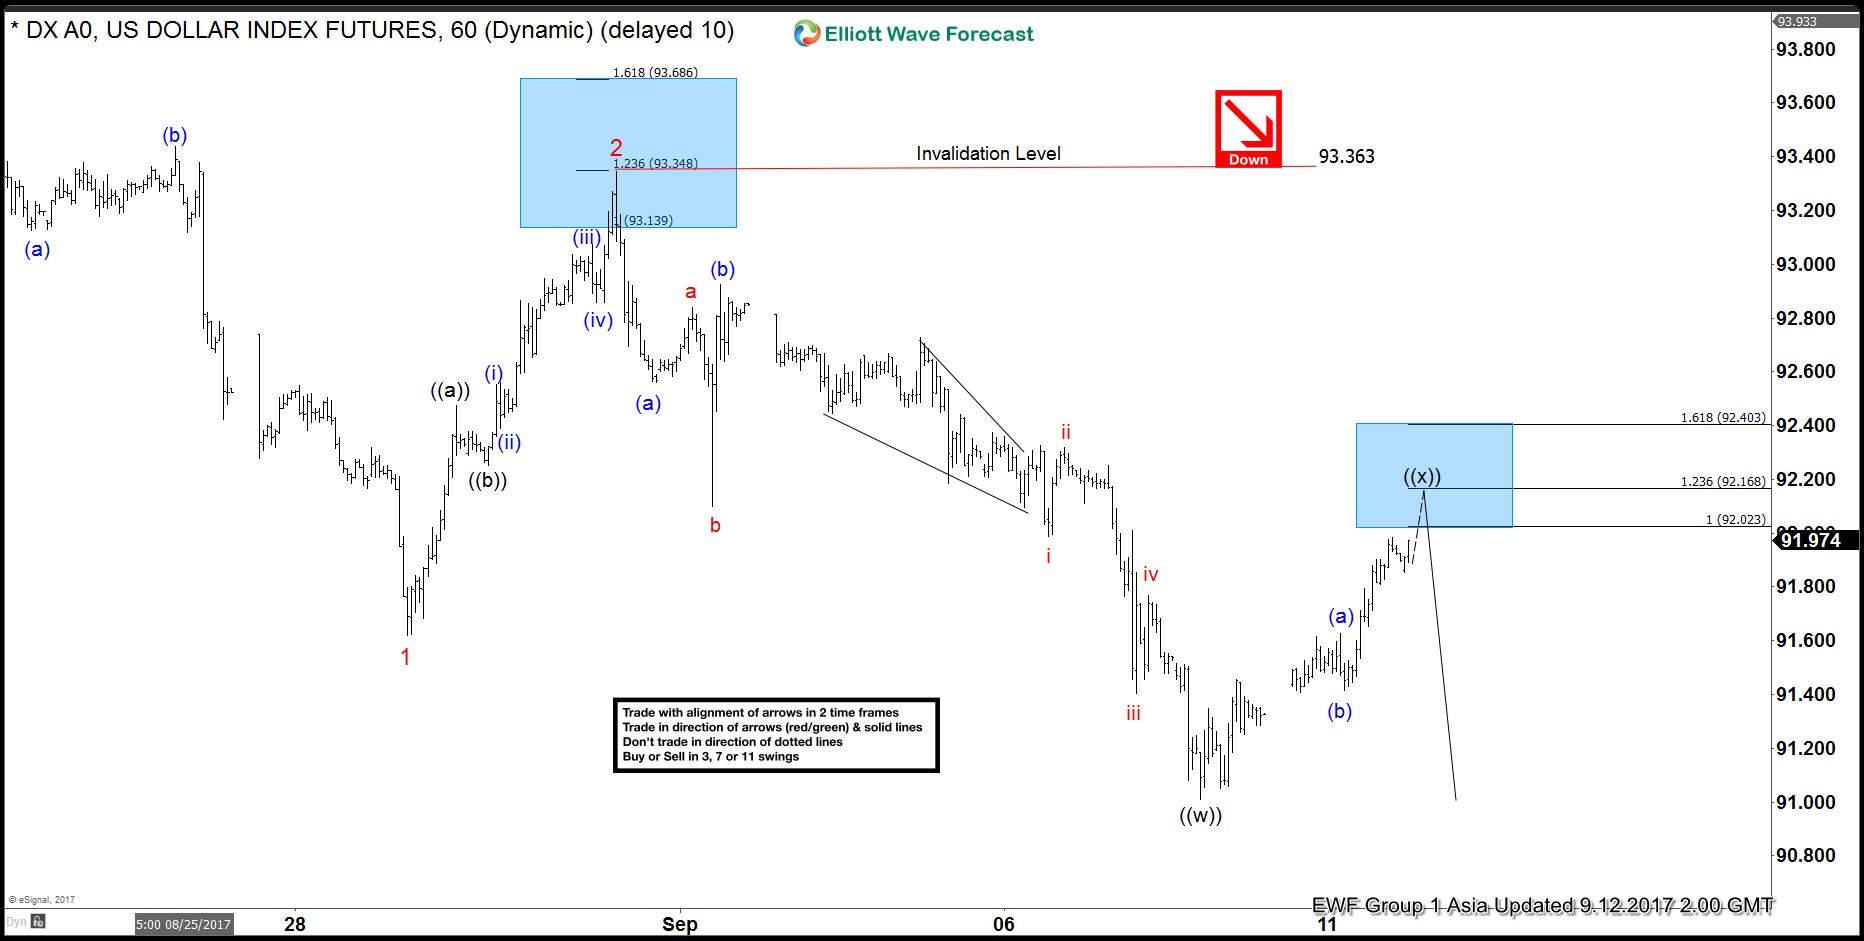
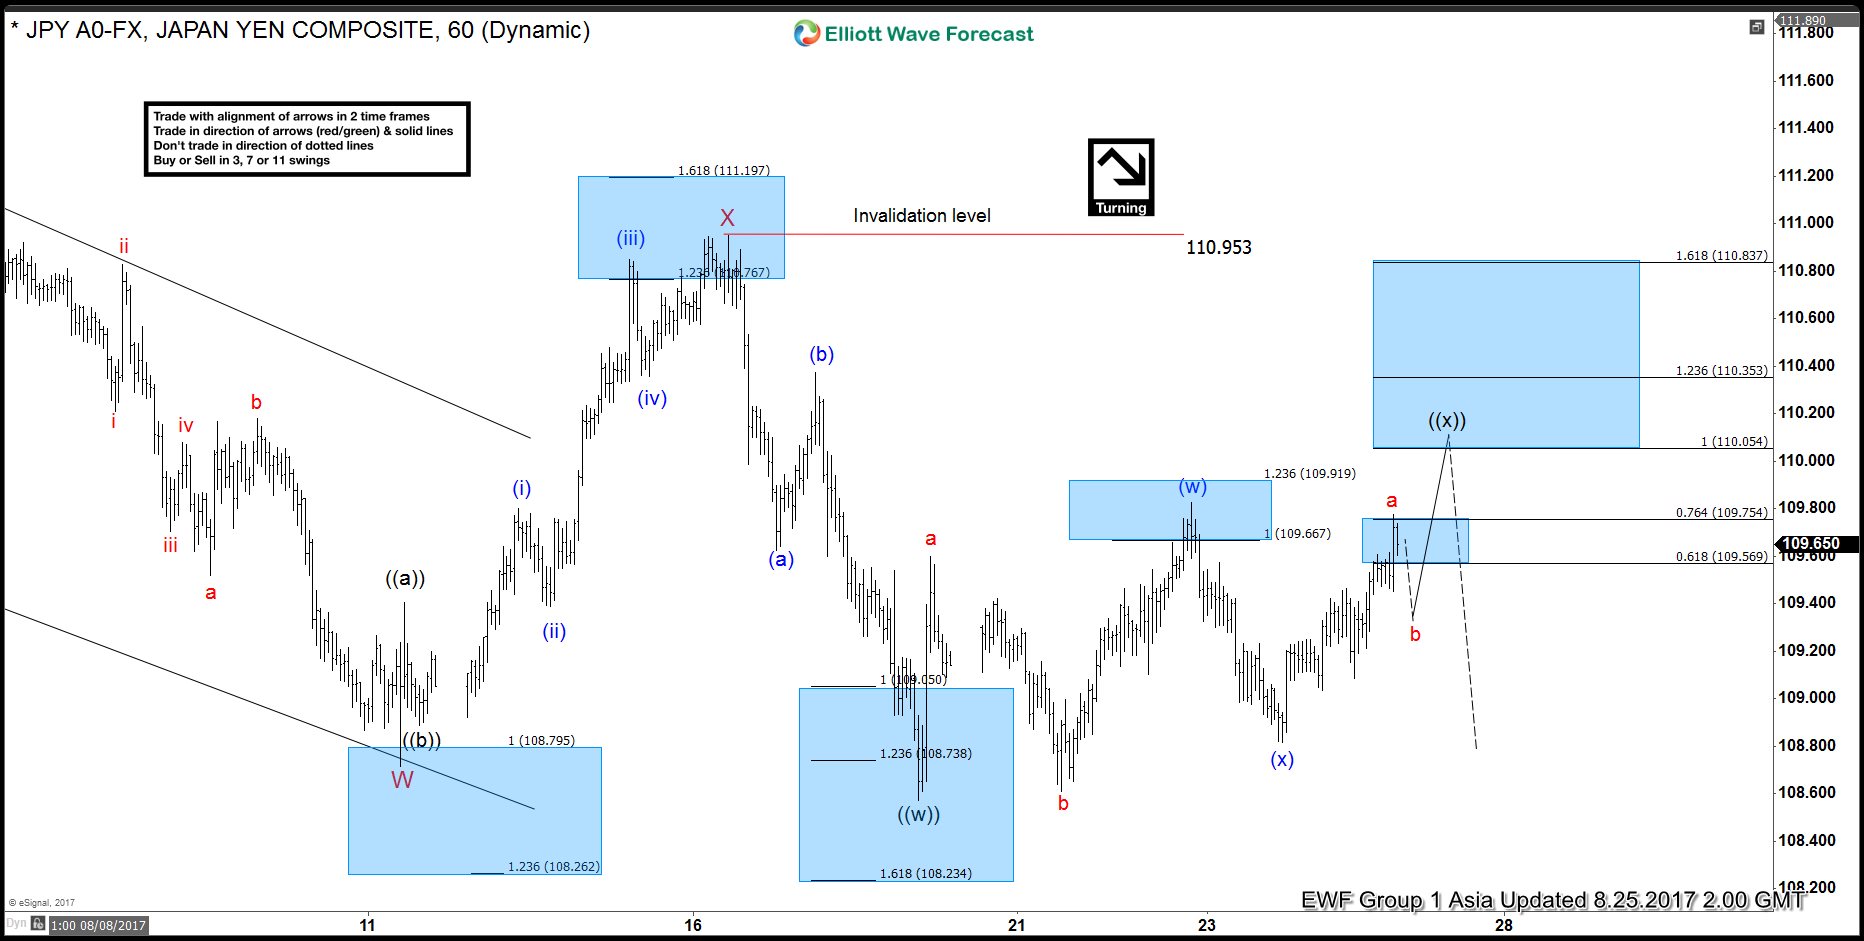
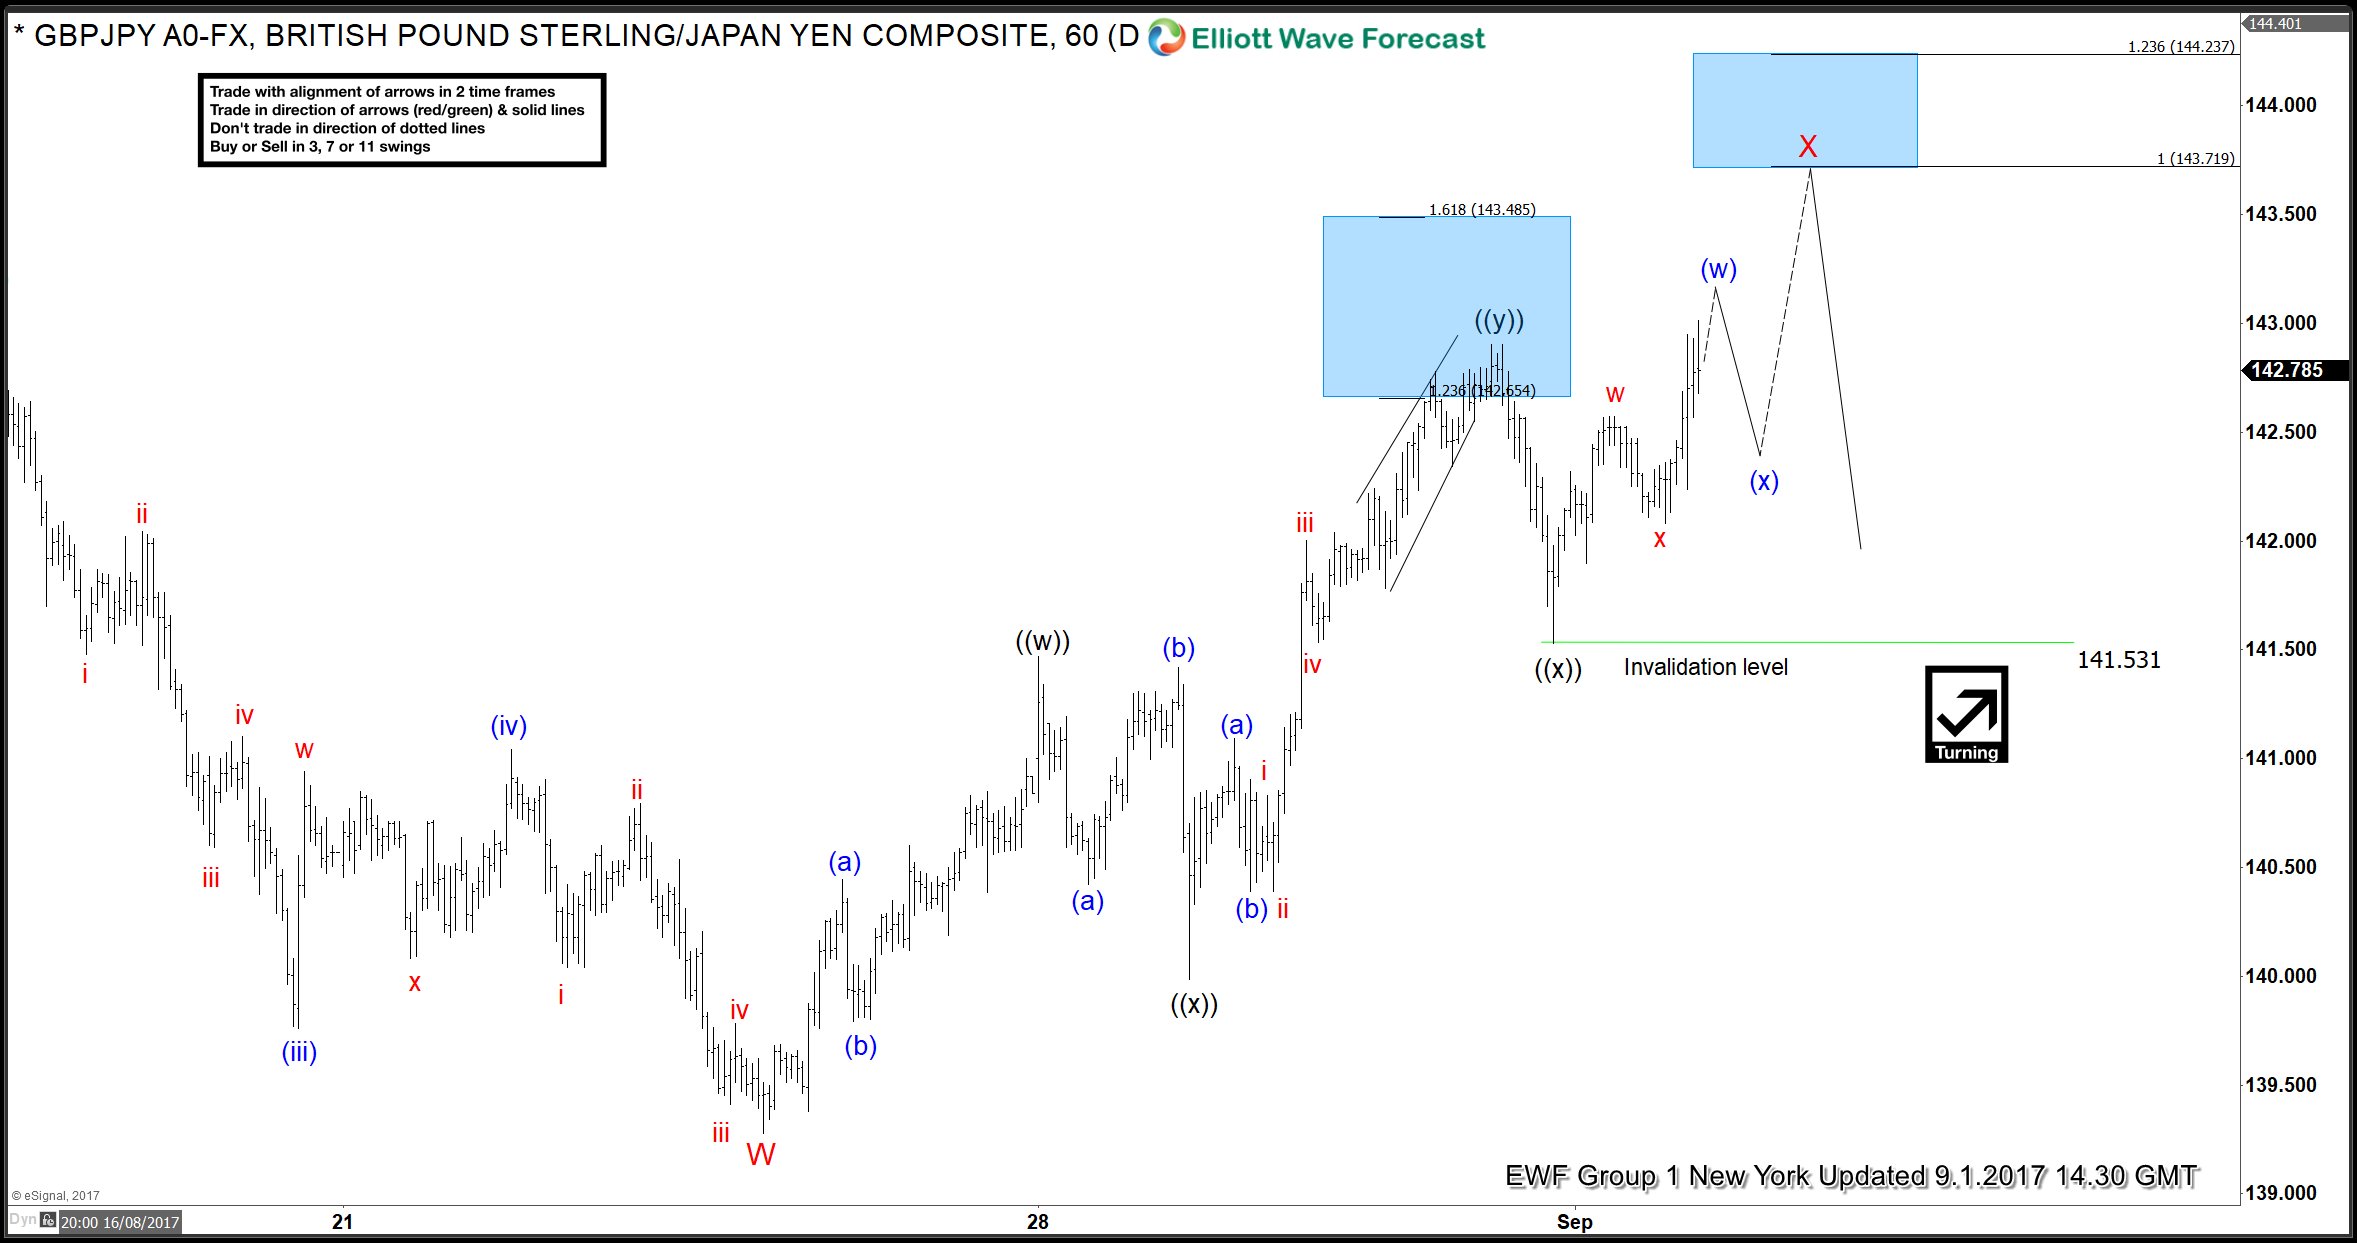
Short term USDJPY Elliott wave view suggest the decline from 7/11 peak is unfolding as a double three Elliott wave structure. Decline to 108.71 low ended Minor wave W and Minor wave X bounce ended at 110.95 peak. Subdivision of Minor wave Y is unfolding as a Zigzag structure. Minute wave ((w)) of ((Y) ended at 108.59 low and Minute wave ((x)) of (Y) bounce ended at 109.82. The pair has reacted lower from the blue box, but the move lower will get validation only with a break below 108.59. Until then a double correction in Minutte wave ((x)) still can happen.

Down from 108.59, Sub Minutte wave a of (y) ended at 108.82 low and the pair is in Sub Minutte wave b bounce to correct the decline from 109.82 peak. Near term, while bounces fail below 109.82 peak and more importantly below 110.95, expect pair to extend lower. Initial target to the downside is 108.35-108 area to complete Minutte wave (w). Afterwards, pair should bounce in Minutte wave (x) before the decline resumes. We don’t advise buying the pair and expect more downside in the pair as far as bounces fail below 110.95 peak.

USDJPY 1 Hour Elliott Wave Chart
 

Elliottwave-Forecast

Master Trader
Feb 17, 2017
2,462
9
84
www.elliottwave-forecast.com
USDJPY Elliott Wave view: Double Correction

Short term USDJPY Elliott wave view suggests the decline from 7/11 peak is unfolding as a double three Elliott wave structure. Decline to 108.71 low ended Minor wave W and Minor wave X bounce ended at 110.95 peak. Subdivision of Minor wave Y is unfolding as another double three structure of a lesser degree. Minute wave ((w)) of ((Y) ended at 108.59 low and revised view suggests Minute wave ((x)) of (Y) bounce remains in progress to correct cycle from 8/16 peak towards 110.05 – 110.35 before pair turns lower. We don’t like buying the proposed bounce, and as far as pivot at 110.95 remains intact, expect sellers to appear at 110.05 – 110.35 for a new low or at least pullback in 3 waves.

USDJPY 1 Hour Elliott Wave Chart
 

Elliottwave-Forecast

Master Trader
Feb 17, 2017
2,462
9
84
www.elliottwave-forecast.com
The Big Long in World Indices

Since the decline starting from year 2000, the world has been calling for a huge crash in world indices. The world indices did in fact corrected nicely in the year 2000 and 2009. The correction took the form of a FLAT Elliott wave structure and reached 50%-61.8% of the all-time rally in most of the world indices. This correction is even recorded in a movie titled “The Big Short” telling story about a group of traders shorting the market.

The crowd does not have enough with the 50%- 61.8 % correction between year 2000 and 2009, which is almost 9 years of correction. People want more and they want a crash after another crash. However, the reality is that the Market does not work that way. Most traders do not have a long career as most believe that the World Indices trend is bearish following the 2009 decline. This is a wrong bias which has cost traders billions of dollars.

The World Indices trend will always be bullish because it’s simply the Human nature. We used to live in the cave, but now we have a nice house, hotels and many other development to make our lives more comfortable. This is called progress, and by nature, we humans always will look for something better and the Indexes are a reflection of the Human progress. We understand that corrections are needed and they will always be a part of the Market. We can say that traders who shorted in 2007 – 2008 and caught the move lower got very lucky.

The World Indices ended the all-time cycle until that moment at 4.2.2000 and pullback in 7 swings into the 776 area using the $SPX as reference. By 2002, the correction has reached 50% of the all-time rally ina corrective 7 swing structure, and technically the correction was enough and a new bullish trend could develop. The World Indices even made a new high in 2007 and then crashed into a C wave completing a flat structure. Selling wave B at 2007-2008 high into wave C lower with a new high above the previous peak at 2000 is luck. Yes the move lower happened, but selling is against the trend at that time, and whoever caught that short got lucky.

It sounds and looks easy in a movie, but it is a wrong trade. It is a mass crowd trade, and we know better. We proposed “The Big Long” instead, which is more natural and easier to trade with no pain. The Index has rallied since 2009 and this rally is the good side of the Market, the one with no pain. The trend is always smoother and more natural, but most of the time the crowd does not see the trend. We do understand The Big long has reached the minimum target at 2234, if it is labelled as an ABC or a corrective sequence. However, the Market is saying more upside is possible and 3197 can still be reached if the Big Long becomes an extended Big Long.

Trading is about reading the Market and understanding the natural path and not forcing against the trend. We keep and will keep calling extension and buy into The Big long because we understand that pickers got it right one time and wrong 9 times. We would rather get it right 9 times and wrong 1 time. As we always said, nobody is 100% correct and it is impossible to be perfect, but when you trade the trend it becomes easier. The Big Short which everyone is waiting is a crowd and popular trade. The reality is that few people look the other side which is the Big long. This side is not over and can become extended Big Long.


SPX Elliott Wave Chart
 

Elliottwave-Forecast

Master Trader
Feb 17, 2017
2,462
9
84
www.elliottwave-forecast.com
Royal Gold Bullish Structure Calling Higher

Royal Gold (NASDAQ: RGLD) is one of the world’s leading precious metals royalty & stream companies, it’s engaged in the acquisition and management of gold, silver, copper, lead and zinc. The Company owns interests on 194 properties in over 20 countries, including interests on 39 producing mines and 21 development stage projects.

During last week, Royal Gold announced fourth quarter dividend of US$0.24 per share of common stock payable on October 20, 2017. It’s stock price closed on Friday at new 5 years high with a total gain of +37% YTD and +250% from last year low.

The recent move higher during the month of August was significantly important for the stocks because the price managed to break above the 2016 peak and that opened a new extension to the upside. So let’s take a look at RGLD technical chart.

Royal Gold Elliott Wave Technical Analysis
RGLD rallied from 01/20/2016 low before topping at $87.74 on 08/02/2016. That peak held for 1 year in which the stock corrected for 4 months before resuming the move higher and finally managing to break it on 08/10/2017. Royal Gold is now showing an incomplete 5 swings bullish sequence from 2016 low and the stock is expected to continue to the upside toward the minimum target at equal legs area $123 – $138 with a possible extension toward $162.

RGLD Weekly Chart


Using Elliott Wave theory, we can label the move from 2016 low as a start of a 5 waves diagonal so that could be forming wave (III) or only the first leg of it because the 3rd wave usually extend toward the 1.618 fib ext level which will come around $187.

Royal Gold still needs to break above 2012 peak to confirm the bullish move higher and open another bullish sequence. So either way, the move will extend higher as 5 waves or will end up as 3 waves Zigzag ABC from 1991 low. The equal legs from there comes at $125 – $149 which is around the same extreme area from 2016 suggesting that the stock could see a pullback from that area before deciding the next path.

RGLD Monthly Chart


Recap

Royal Gold technical picture is strongly bullish after the recent break higher and that’s why buyers can be seen now during pullbacks in 3 , 7 or 11 swings with targets higher above $120 area unless the move higher is part of a flat structure which means it will still do another leg lower against 2016 before rallying again. The stock is getting support from the commodity sector overall and especially of rise in the price of precious metals.
 

Elliottwave-Forecast

Master Trader
Feb 17, 2017
2,462
9
84
www.elliottwave-forecast.com
BBY Best Buy Earnings Report 08/29/17 – Weekly ElliottWave Count

BBY Best Buy Inc. earnings report due to this week, the 29th of August. Before we get into the details few words about the company we are about to analyze.
According to Wikipedia, Best Buy Co. (NYSE: BBY), Inc. is an American multinational consumer electronics corporation headquartered in Richfield, Minnesota, a Minneapolis suburb. Internationally, it also operates in Canada and Mexico. It was formerly operational in China until February 2011 (when the faction was merged with Five Star) and in Europe until 2012. According to Yahoo! Finance, Best Buy is the largest specialty retailer in the U.S. consumer electronics retail industry.

Regarding earning, Best Buy Co., Inc. is expected to report earnings the 29th of August 2017 before market open. The report will be for the fiscal Quarter ending Jul 2017. According to Zacks Investment Research, based on 12 analysts’ forecasts, the consensus EPS forecast for the quarter is $0.63. The reported EPS for the same quarter last year was $0.57.

Overall view, Best Buy (NYSE: BBY) shares are surging this year, a company many investors though was in big trouble because of the threat from Amazon. The stock is up by 55% this year and up by approximately 240% since the company named Hubert Joly as its CEO five years ago.


Main reasons why BBY Best Buy has been surging:


    • The Nintendo Switch console launch
    • Best Buy proved Amazon-proof in contrast with Circuit City and RadioShack
Despite the very encouraging data, it is worth to mention that the BBY stock is well behind AMZN’s performance. Since August 2012, AMZN stock is up by 300% yet if we account the S&P 500 is up by 75% during the same time frame and while the S&P Retail ETF (XRT) has risen only 25%, BBY Best Buy still has an astonishing performance.

Coming back to the Earnings subject, Jefferies raised Best Buy Sales and Earnings estimates on Tuesday for the second quarter, citing strength in the video game, appliance and smartphone categories.

“Based on our field checks and other research, we believe Best Buy should be able to grow domestic SSS [same-store sales] at the high end or better than mgmt.’s plan,” analyst Daniel Binder wrote in a note to clients. “We expect Best Buy to benefit from strength in appliances and connected home, however we also expect robust growth in entertainment from the introduction of two gaming consoles in Q1 and mobile to benefit from a full quarter of Samsung S8/S8+ availability.”

“We believe that Best Buy’s entertainment category saw a second consecutive quarter of robust growth driven by the launch of the Nintendo Switch and the 1TB PlayStation Slim Gold console as the company laps fairly significant comparable store sales declines in this category,” he wrote.
As a result, the analyst raised his July quarter Best Buy U.S. same-store sales growth estimate to 2.5 percent from 2.0 percent. He also increased his earnings-per-share forecast for the same quarter to 66 cents from 59 cents versus the Wall Street consensus of 63 cents.


Our View in ElliottWave-Forecast[URL deleted]

When it comes to our BBY’s stock price analysis, Best Buy is still a buy in the dip on the weekly time frame while still missing the minimum target of the 70’s level. The 70’s price target is the equal legs of the (w) – (x) swing since the stock first started trading. The rally since 12/2012 as well seems incomplete. Price took the equal legs at the 56’s zone but RSI yet to show divergence, a fact suggesting we are most likely going to see the next level at the 1.236% extension around the 66’s, just 4$ from the equal legs at 70’s mentioned above.


BBY Best Buy Weekly Elliott Wave Count


BBY Best Buy Weekly Elliott Wave Count

At this stage we would like to see price correcting down to the 56’s zone where the supporting trend line since 06/01/16 is holding. From there we expect price to bounce and ideally extend to new highs towards our target or at least create a 3 wave bounce which should provide longs the ability to get Risk Free.
 
Last edited by a moderator:

Elliottwave-Forecast

Master Trader
Feb 17, 2017
2,462
9
84
www.elliottwave-forecast.com
SPX Elliott Wave View: At Weekly Inflection Area

SPX S&P 500 Long Term Elliott Wave view suggests that the Index has reached the minimum target at 2234.35 to end a big cycle from an all time low. If we assume the Index starts from all-time low of 0, then the rally can be labeled as a zigzag Elliott Waves tructure. The first leg wave A ended in March 2000 at 1553.11 during the dot com bubble. From 2000 peak, the Index corrected in 3 waves and reached 50% retracement at 766.67 in the year 2002. SPX then started a new leg higher which broke above 2000 peak in October 2007. Technically, with the break above 2000 peak, S&P formed a bullish sequence (a higher high) from all-time low and the natural path is to extend higher, especially considering that it has corrected 50% into 2002.

As SPX formed a new peak in the year 2007, the Market did an unexpected detour. Instead of the natural path of extending higher, the Index declined strongly in 5 waves into the year 2009 during the financial crisis due to subprime mortgage default and collapse of Lehman Brothers. This collapse is even captured in the movie titled “The Big Short” when several traders made money by correctly betting on the ensuing crash. In reality however, these traders got lucky as they were trading against a natural cycle, which happens only in a wave C of a FLAT structure.

The decline broke below 2002 low, sentiment was very negative at that time and no one was talking about buying the Index. What people don’t realize is that the Market is a reflection of human progress and thus it should never go back to zero. Correction is natural and allows the market to reset. The Market ended a 3-3-5 Expanded Flat Elliott Wave structure in 2009 and then began the Big Long. Interestingly, nobody is filming or talking about the Big Long, and nowadays most people still talk about the impending big crash almost every single year even when the market keeps rallying. Almost nobody is talking about how great the move higher is as people don’t understand the primary trend in the human nature is up.

Right now, S&P has reached an interesting weekly inflection area in which we can label the entire move from all time 0 as a zigzag Elliott Wave Structure. Wave A started from all-time 0 to 2000 high. The 3 waves correction from 2000 high to 2009 low is labelled as wave B and take the form of Expanded Flat. Then from 2009 low to present day, it is labelled as wave C. The minimum target wave C = A at 2234.35 has been reached, but that doesn’t mean the Indices will crash from here. We acknowledge that the Index could indeed have a decent pullback from this area, but keep in mind that it’s possible for the Index to extend higher within the blue box at 2234.35 (100% of A-B) – 3196.41 (161.8% of A-B).

If the Index reaches 3196.41, then the whole move from all-time 0 can be labelled instead as 1-2-3. If reaching 3196.4, the third wave in this case is extended, which is the typical characteristic of wave 3 in an impulse. Thus the Big Long at this point in time can even become an extra Big Long, until it gets denied.

SPX S&P 500 Long Term Elliott Wave Chart


Recording of our seminar “Are the Indices Ready for the Biggest Crash of all time”

Below please find the recording of our public seminar on 8/28/2017 in which we discussed about S&P and the state of World Indices at this time.
 

Elliottwave-Forecast

Master Trader
Feb 17, 2017
2,462
9
84
www.elliottwave-forecast.com
CL_F Oil Elliott Wave View: Pullback in progress

Oil Short Term Elliott Wave suggests that the decline from 8/1 peak is unfolding as a double three Elliott Wave Structure where Minute wave ((w)) ended at 46.46 and Minute wave ((x)) ended at 48.76. Oil has since made a new low below Minute wave ((w)) at 46.46 suggesting the next leg lower has started. Wave ((y)) is in progress and also subdivided as a double three where Minutte wave (w) ended at 46.15 and Minutte wave (x) is proposed complete at 46.96.

Near term, while bounces stay below Minute wave ((x)) at 48.76, Oil has scope to extend lower towards 43.92 – 44.85. This is an inflection area where Minute wave ((w)) = Minute wave ((y)) and buyers can appear in this area for at least a 3 waves bounce. We don’t like selling Oil and expect buyers to appear at 43.92 – 44.85 area (if reached) for at least a 3 waves bounce, provided that pivot at 6/21 low (42.07) remains intact.

Oil 1 Hour Elliott Wave Chart
 

Elliottwave-Forecast

Master Trader
Feb 17, 2017
2,462
9
84
www.elliottwave-forecast.com
GBPJPY Elliott Wave View: Ending correction

GBPJPY Short Term Elliott Wave suggests that the decline to 8/23 low at 139.27 ended Minor wave W. Minor wave X bounce is currently unfolding as a double three Elliott Wave Structure. Minute wave ((w)) of X ended at 141.47, Minute wave ((x)) of X ended at 139.98, and Minute wave ((y)) of X is subdivided into a FLAT. Minutte wave (a) of ((y)) ended at 141.09 and Minutte wave (b) of ((y)) ended at 140.39. Minute wave ((y)) of X has now reached 1.236 extension of ((w))-((x)) and thus the cycle from 8/23 low (139.27) is mature. Sellers may appear anytime from 142.65 – 143.49 area for an extension lower or at least a 3 waves pullback. We don’t like buying the pair.

GBPJPY 1 Hour Elliott Wave View
 

Elliottwave-Forecast

Master Trader
Feb 17, 2017
2,462
9
84
www.elliottwave-forecast.com
GBPJPY Elliott Wave View: Wave Red X Still in Progress

GBPJPY Short Term Elliott Wave suggests that the decline to 8/23 low at 139.27 ended Minor wave W. Minor wave X bounce is currently still in progress as a double three Elliott Wave Structure. Minute wave ((w)) of X ended at 141.47, Minute wave ((x)) of X ended at 139.98, and Minute wave ((y)) of X is proposed complete at 142.93. The move higher from Minor W can be counted as a triple three. In this case, it will open extension higher to 143.75 – 144.27 area before pair turns lower.

GBPJPY 1 Hour Elliott Wave View
 

Elliottwave-Forecast

Master Trader
Feb 17, 2017
2,462
9
84
www.elliottwave-forecast.com
Gold Elliott Wave View: 5 Waves Up

Gold Short Term Elliott Wave suggests that the rally from 8/15 low is unfolding as a zigzag. The first leg Minor wave A is subdivided as an impulse. Minute wave ((i)) of A ended at 1300.83, Minute wave ((ii)) of A ended at 1274.45, Minute wave ((iii)) of A ended at 1326, and Minute wave ((iv)) of A ended at 1297.52. Minute wave ((v)) of A is currently in progress and also subdivided as an impulse.

Minutte wave (i) of ((v)) ended at 1323.63, Minutte wave (ii) of ((v)) ended at 1316.3, and Minutte wave (iii) of ((v)) ended at 1339.77. Gold is currently in Minutte wave (iv) of ((v)) pullback before another leg higher to complete Minor wave A. Afterwards, Gold should pullback in Minor wave B to correct cycle from 8/15 low before the rally resumes. We don’t like selling Gold and expect buyers to appear once wave B pullback is over in 3, 7, or 11 swing as far as pivot at 8/15 low (1267.21) stays intact.

Gold 1 Hour Elliott Wave Chart
 

Elliottwave-Forecast

Master Trader
Feb 17, 2017
2,462
9
84
www.elliottwave-forecast.com
AUDUSD Elliott Wave View: More Upside

AUDUSD Short Term Elliott Wave view suggests that the rally from 8/15 low is unfolding as a double three Elliott Wave structure. Up from 8/15 low, Minute wave ((w)) ended at 0.79957 and Minute wave ((x)) ended at 0.7868. Minute wave ((y)) is in progress and the subdivision also unfolds as a double three. Minutte wave (w) of ((y)) ended at 0.7995 and Minutte wave (x) of ((y)) ended at 0.793. Near term, while pullbacks stay above 0.793, but more importantly above 0.7868, expect pair to extend higher towards 0.806 – 0.8108. We don’t like selling the pair.

AUDUSD 1 Hour Elliott Wave Chart
 

Elliottwave-Forecast

Master Trader
Feb 17, 2017
2,462
9
84
www.elliottwave-forecast.com
North Korea Nuclear test poses little threat to Indices rally

Geopolitical tensions intensified after North Korea conducted its sixth and most powerful nuclear test on Sunday, detonating what it said was a hydrogen bomb meant for intercontinental ballistic missile. The United States warned it could launch a “massive” military response if it or its allies were threatened. Most of the Stock Markets in the World reacted negatively to the news with stocks from around the World ending the day in the red.

We believe what we saw was some panic selling and not a huge sell off. We believe that markets move on the basis of cycles and swing sequences and news just acts as a catalyst rather than driving the markets. We believe North Korea’s nuclear test poses little threat to the rally in Indices as mid-long term cycles are still bullish. We will present long-term view in South Korean Stock Exchange to support our view that any sell off seen due to escalating geo-political tensions is still a buying opportunity.

$KOSPI-KOR denies huge sell off due to North Korea


KOSPI-KOR Index from South Korea is within 7th swing from 1980 low but has not yet reached the ideal target area. Sequence from 2008 low is also incomplete and calls for more upside towards 2891 – 3362 area as far as dips hold above 2011 low. As the sequence from 1980 and 2008 low in KOSPI-KOR is incomplete, any dips remain a buy in 3, 7 or 11 swings as far as pivot at 2011 low remains intact. North Korea’s nuclear test or any military offensive should have a direct impact on South Korea’s stock exchange and as the sequence is bullish, we believe nothing drastic will come out of the current scenario, it can cause a pull back but that should be a buying opportunity looking for a move higher towards 2891 – 3362 area.

$KOSPI-KOR Long-Term Elliott Wave View


$KOSPI-KOR rally from 1980 low could be viewed as a double three Elliott wave structure or it could be viewed to be in wave (III) of an incomplete Leading Diagonal structure. In either case, rally sequence is incomplete and as dips hold above wave ((2)) and more importantly “b” low, expect the Index to resume the rally towards 2893 – 3362 area to reach the extreme from 1980 low. From this area, Index can see a larger pull back to correct the cycle from 1980 low or at least from 2008 low labelled as (x) / (II). We don’t like selling the Index and expect to see buyers appearing after dips in 3, 7 or 11 swings as far as pivot at 2015 and 2011 lows remain intact.
 

Elliottwave-Forecast

Master Trader
Feb 17, 2017
2,462
9
84
www.elliottwave-forecast.com
AUDUSD Elliott Wave View: Bullish above 0.787

AUDUSD Short Term Elliott Wave view suggests that the rally from 8/15 low is unfolding as a double three Elliott Wave structure. Up from 8/15 low, Minute wave ((w)) ended at 0.79957 and Minute wave ((x)) ended at 0.7868. Minute wave ((y)) is in progress and the subdivision also unfolds as a double three. Minutte wave (w) of ((y)) ended at 0.7995 and Minutte wave (x) of ((y)) ended at 0.793. Near term, while pullbacks stay above 0.793, but more importantly above 0.7868, expect pair to extend higher towards 0.806 – 0.8108. We don’t like selling the pair.

AUDUSD 1 Hour Elliott Wave Chart
 

Elliottwave-Forecast

Master Trader
Feb 17, 2017
2,462
9
84
www.elliottwave-forecast.com
Gold Soars Above $1300 as Concerns Mount

Gold has tested $1300 level 3 times since April and it finally broke above the level on Monday and rose to the highest level this year. The trigger of the break seems to be the North Korea firing a ballistic missile over Japan, which boosts the safe haven demand. The yellow metal then extended the rally to 11 month high after North Korea nuke test. Gold’s strength, however, can not be attributed to just one event, but rather over a series of concerns which start to build a wall of worry among investors.


A few weeks ago, White House chief economic adviser Gary Cohn came close to resigning after president Trump’s response of blaming “both sides” in the deadly violence at Charlottesville, Virginia. Mr. Cohn is the main architect of President Trump’s tax reform agenda, and thus when news of his possible departure started to circulate around Aug 17, markets were spooked. Then there are also concerns of government shutdown if the debt ceiling is not raised. If this happens, it will trigger technical default on U.S debt.

Apart from the argument of safe haven demand, Gold for some people is considered as the best form of sound money. Unlike fiat money which can be printed ex nihilo, Gold has limited quantities. It has survived thousands of years as a form of money, longer than any other alternative forms of payment. The chart below compares Gold’s role as store value vs the fiat:


The chart above shows that while equity markets are hitting all-time highs in USD term, it peaked against Gold in 2000 and remain 70% below the peak.

We believe Gold’s dual role as sound money and safe haven demand will become more prominent in the next coming months as the massive Quantitative Easing experiment by central banks around the world start to reveal the true costs. This month, we shall also see the market reaction to the U.S. Fed’s plans to normalize their balance sheet and taper bonds reinvestment. On paper, this is the same as money tightening and thus could have the opposite effect of money printing.

Gold Daily Elliottwave Sequence Chart


The Daily Chart of Gold shows the sequence from 12.15.2016 is bullish and favors more upside towards 1376.8 – 1417.6. When Gold reaches this area, it will also break above 7.6.2016 peak at 1375.15 which opens another larger bullish sequence from 12.3.2015 low. Thus, we don’t like selling Gold in any pullback and prefer to buy dips in 3, 7, or 11 swing.
 

Elliottwave-Forecast

Master Trader
Feb 17, 2017
2,462
9
84
www.elliottwave-forecast.com
GBPUSD Elliott Wave View: More Upside

GBPUSD Short Term Elliott Wave view suggests that the rally from 8/24 low is unfolding as an impulse Elliott Wave structure. Up from 8/24 low (1.2773), Minor wave 1 ended at 1.2979 and Minor wave 2 ended at 1.2851. Minor wave 3 is in progress and the subdivision is unfolding as an impulse Elliott Wave structure. Minute wave ((i)) of 3 ended at 1.2947, Minute wave ((ii)) of 3 ended at 1.2907, Minute wave ((iii)) of 3 ended at 1.3082 and Minute wave ((iv)) of 3 ended at 1.303. Minute wave ((v)) of 3 is expected to end soon within 1.3104 – 1.3182 area. Afterwards, pair should pullback in Minor wave 4 before the rally resumes. We don’t like selling the proposed pullback.

GBPUSD 1 Hour Elliott Wave Chart
 

Elliottwave-Forecast

Master Trader
Feb 17, 2017
2,462
9
84
www.elliottwave-forecast.com
Under Armour UAA Weekly Elliott Wave Outlook

Under Armour (NYSE: UAA) is one of the leading sporstwear companies around the world. However it’s stock has been struggling in the recent 2 years as it lost %68 since September 2015.

In our previous article, we pointed out to the current correction taking place which could turn out to be 3 waves flat structure. It turned out to be the case for UAA and the stock currently extending lower into the 123.6% – 1.618% fib ext area (21.49 – 13.32) where it’s expected to end the correction in wave ((II)) and resume higher or bounce in 3 waves at least.

UAA can extend further toward 10.98 which is the target for wave I = wave V but we need to be aware that it has already enough number of swings in place to end the cycle from 09/17/2015. That’s why it’s not recommended to chase the short side at current stage.

Overall, UAA will remain under pressure until it manage to break the short term pivot of wave IV at 23.46 as a first step then we’ll be looking for the next leg higher to take it above $52 or fail below it for a double correction taking place in a later stage.

UAA Weekly Chart
 

Elliottwave-Forecast

Master Trader
Feb 17, 2017
2,462
9
84
www.elliottwave-forecast.com
INSM Insmed Inc Stock Skyrocketed

INSM Insmed Inc Stock Skyrocketed by a staggering 120% higher recently.

According to Nasdaq.com, the Insmed Inc. INSM stock advanced more than double in the pre-market trading after the company announced that its new drug, an inhaled antibiotic known as Alis, successfully treated patients with a rare lung disease. More specifically:

Alis met the main goal in a late-stage study involving 336 adult patients with nontuberculous mycobacterial lung infections. According to Insmed, the addition of the drug showed statistically significant reduction in bacterial density by month six in 29% of patients, compared to just 9% in patients receiving the standard treatment.

INSM Insmed Inc Stock Skyrocketed – Weekly Time Frame

Without any further delays lets take a look at the Weekly Chart. Price has extended from the all time lows at 2.60 suggesting cycle from 08/28/2000 has been completed and should see at this stage a correction against the 199.22 highs. And of course is too early too make huge calls, the reason we are going to take it step by step.

At this stage and as the following chart indicates, INSM has extended with waves iii red while in 3rd swing up for ((w)). Short cycles we should see a short term pull back and from there extend higher again to reach the equal legs – 1.236% extension at the zone of 34.80’s – 40.90’s before sellers appear. The view comes inline with our analysis relating to IBB and XLV ETF’s while both Funds are looking for additional extension higher. So at this point we are looking for the dip in wave iv red to trigger Long entries towards the targets higher as mentioned above.


Elliottwave-Forecast

Master Trader
Feb 17, 2017
2,462
9
84
www.elliottwave-forecast.com
DXY Dollar Index Elliott Wave View: 9.12.2017

DXY Dollar Index Short Term Elliott Wave view suggests that the decline from 8/16 peak is unfolding as an Ending Diagonal Elliott Wave structure. Down from 8/16 high, Minor wave 1 ended at 91.62 and Minor wave 2 ended at 93.347. Minor wave 3 is unfolding as a double three Elliottwave structure. Minute wave ((w)) of 3 ended at 91.01 and Minute wave ((x)) of 3 is in progress. The internal subdivision of Minute wave ((x)) shows a zigzag Elliottwave structure. Minutte wave (a) of ((x)) ended at 91.62 and Minutte wave (b) of ((x)) ended at 91.41.

The Index has reached an inflection area where Minutte wave (c) = Minutte wave (a) and thus cycle from 9/8 low is mature. Expect Minute wave ((x)) of 3 to end at 92.02 – 92.4. While bounces stay below 93.36, Index should resume lower or at least pullback in 3 waves. We don’t like buying the Dollar Index.

DXY 1 Hour Elliott Wave Chart
 

Elliottwave-Forecast

Master Trader
Feb 17, 2017
2,462
9
84
www.elliottwave-forecast.com
VSTM Verastem Inc – Bullish Break

VSTM Verastem Inc (NASDAQ: VSTM) stock price has created a strong bullish break in the weekly time frame. The break comes in line with the recent announcement on Wednesday the 6th 09/17 relating to their progressing treatment for Leukemia which sky rocked the stock 44% higher. Wednesday’s catalyst for the rally is the positive top-line data from the Pivot Phase 3 DUO study for the treatment of certain types of Leukemia and Lymphoma.

According to reteurs.com

  • Verastem said its drug, Duvelisib, reduced the risk of disease progression or death in patients by 48 percent when compared with the current standard of care, Novartis’s Arzerra.

  • The oral drug was tested in 319 patients suffering from chronic lymphocytic leukemia (CLL) or small lymphocytic lymphoma (SLL), who did not respond to initial treatment or whose cancer had relapsed. CLL and SLL affect cells in the immune system, causing them to grow and multiply uncontrollably. There will be about 62,000 new cases of leukemia in the United States this year; of which CLL will account for about a quarter, according to the American Cancer Society. Verastem said it would file for a marketing application for duvelisib in the first half of 2018. The study results were “squarely positive,” and suggested a commercial opportunity that was not fully reflected in Verastem’s stock price, Cantor Fitzgerald analyst Mara Goldstein said in a client note.

Before we get into more details about the Stock, few words about the company.

According the company’s official website verastem.com, Verastem Inc. (NASDAQ: VSTM) is a clinical stage biopharmaceutical company focused on discovering and developing drugs which improve patients with cancer. Verastem’s product candidates seek to treat cancer by targeting malignant cells both directly and through modulation of the tumor microenvironment. Our most advanced programs target the phosphoinositide-3-kinase (PI3K) and Focal Adhesion Kinase (FAK) pathways.

VSTM Verastem Inc – Bullish Break in the Weekly TF


(NASDAQ: VSTM) Verastem Inc. stock price broke the multi year bearish trend line the 07/10/2017; suggesting that the 07/08/2013 cycle from the all time highs of 18.70’s has been completed at the 1.05 lows. As we all know, after a trend line break, a retest follows to validate the move. The VSTM Stock price retraced lower after the break higher to retest the broken trend line. Price failed to extend below the 2.99 level and from there the stock extend higher. Recently, price broke one more important barrier, the larger degree descending channel’s median line adding additional strength to the overall bias.

At this stage; we anticipate a short term pull back to retest the median line around the 4.84 area.

VSTM Verastem Inc – Bullish Break in the Daily TF


The (NASDAQ: VSTM) Verastem Inc. stock at the Daily time frame has inline a bullish incomplete sequence from the 1.03 lows. At the time of conducting the study, price is trading at the 5.24 level. That level is the 61.8% – 76.4% Fibonacci extension of the (W) – (X) blue swings. From around current levels, we want to see the short term correction lower. The correction should mark wave B (red) and ideally retrace to the 4.80’s area. Post completion, we expect an extension higher towards our target at the equal legs – 1.236% extension, around the 6.60’s – 7.50’s zone.

Overall View & Trade Recommendation:
Our view favors the (NASDAQ: VSTM) Verastem Inc. Stock higher and recommends; Long Trades post Short Term 3-Swing Pull Backs. Wave B should unfold in 3, 7 or 11 swings against first degree the 2.99 “(X) blue” and second degree the all time lows at the 1.03 invalidation level.
 

Elliottwave-Forecast

Master Trader
Feb 17, 2017
2,462
9
84
www.elliottwave-forecast.com
DXY Elliott Wave View: Zigzag Correction

DXY Dollar Index Short Term Elliott Wave view suggests that the Index ended Primary wave ((3)) at 91.01 and currently in a Primary wave ((4)) bounce. Internal of Primary wave ((4)) is unfolding as a zigzag Elliott wave structure. Preferred view suggests rally to 92.01 completed Intermediate wave (A) and dip to 91.71 ended Intermediate wave (B) as an expanded Elliott wave FLAT. Expect the Index to continue higher towards 92.71 – 92.95 area to complete Primary wave ((4)). Afterwards, the Index should resume the decline lower or at least pullback in 3 waves. We don’t like buying the Dollar Index. Expect sellers to appear at 92.71 – 93.33 area for a 3 waves reaction lower at least. If the rally in the Dollar Index extends beyond 93.33 (1.168 extension), the move from 9/8 low could unfold as impulse instead.

DXY 1 Hour Elliott Wave Chart