Elliottwave-Forecast

Master Trader
Feb 17, 2017
2,426
9
84
www.elliottwave-forecast.com
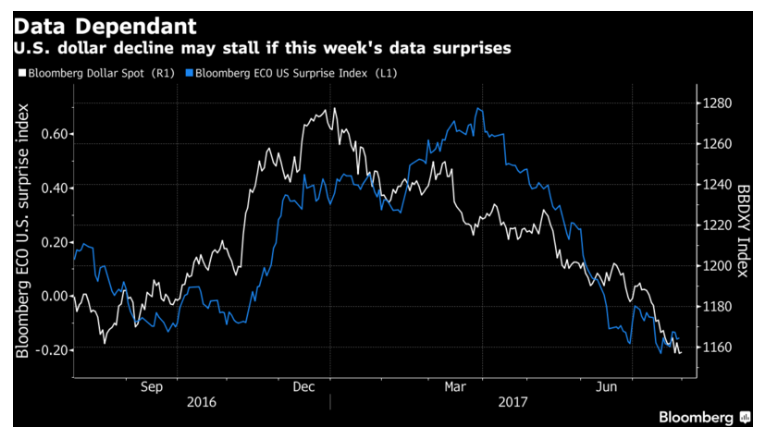
US Dollar to stay soft in 2017

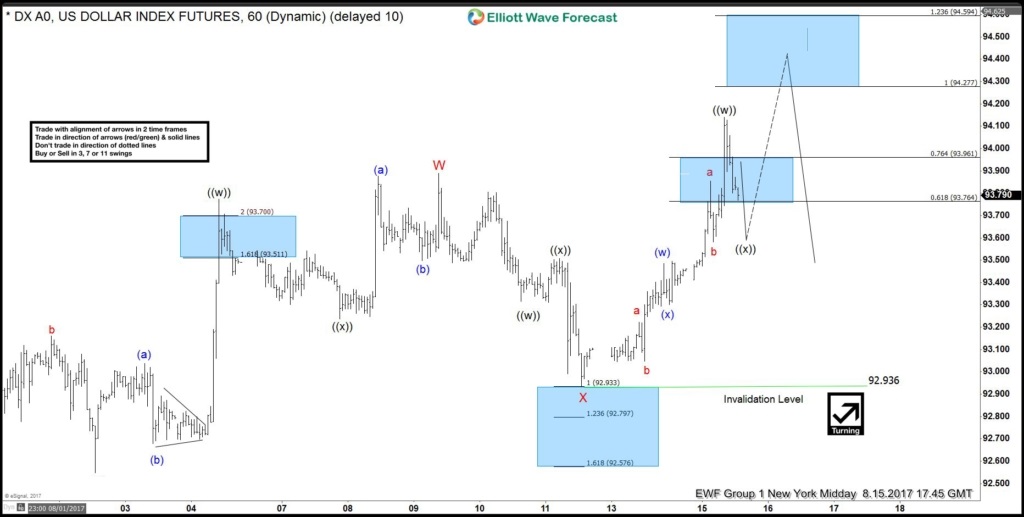
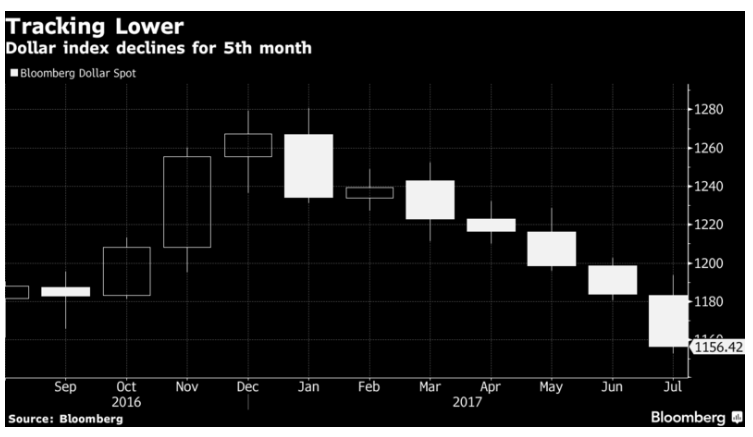
The USD Index has dipped over 9% this year. The weakness in US Dollar has been broad-based and consistent against all major currencies. The Dollar Index closed fifth straight month in losses , something which hasn’t happened since 2011. The USD weakness started with the Euro early this year then continues to widen to other currencies.


There are several factors which contribute to this weakness.

  1. The market gets disappointed with the ability of Trump’s administration to deliver the pro-growth agenda. The failure of Trump’s administration to repeal Obamacare and the elimination of border-adjusted tax have reduced prospective revenue sources for Trump’s fiscal plan. These legislative gridlock made tax-reform an ever-distant prospect.
  2. Meanwhile, Fed’s policy normalization is no longer helping the US Dollar as other central banks also start to normalize their monetary policy. BOC (Bank of Canada) last month started to raise the interest rate by 25 bps. ECB (European Central Bank) is also expected to announce gradual winding down of its quantitative easing (QE) program on Sept 7 meeting as the economic growth in the Euro zone has improved.
  3. The Fed indicated last month that rates are close to a “netural” level and not in need of a significant move higher. The Fed also said they are more concerned about weaker inflation. The Fed’s focus therefore will shift from rate hike to shrinking the QE balance sheet (Quantitative tightening).
  4. The debt ceiling issue coming in September. Congress has already left for August recess and when they return, they only have weeks to raise the debt ceiling by September 29 or the US could run out of money to pay its bills. A deal will raise the US borrowing limit to continue routine payment, such as Social Security benefit
  5. Escalating geopolitical tension with Russia and North Korea.
The above factors could remain in play for the remainder of 2017 which suggests USD should remain soft. However, in the short term, correction is possible as USD selloff has reached the extreme area. This week is likely an important week for the dollar as traders wait for the nonfarm payrolls number. The USD decline may stall if there’s a data surprise. In addition, technically USD Index is near the 200 Weekly Moving Average at 92.3 which may provide temporary support


US Dollar Long Term Outlook
Below we will take a look at two USD pairs: USDCAD and USDNOK to forecast the path of USD for the next few months:

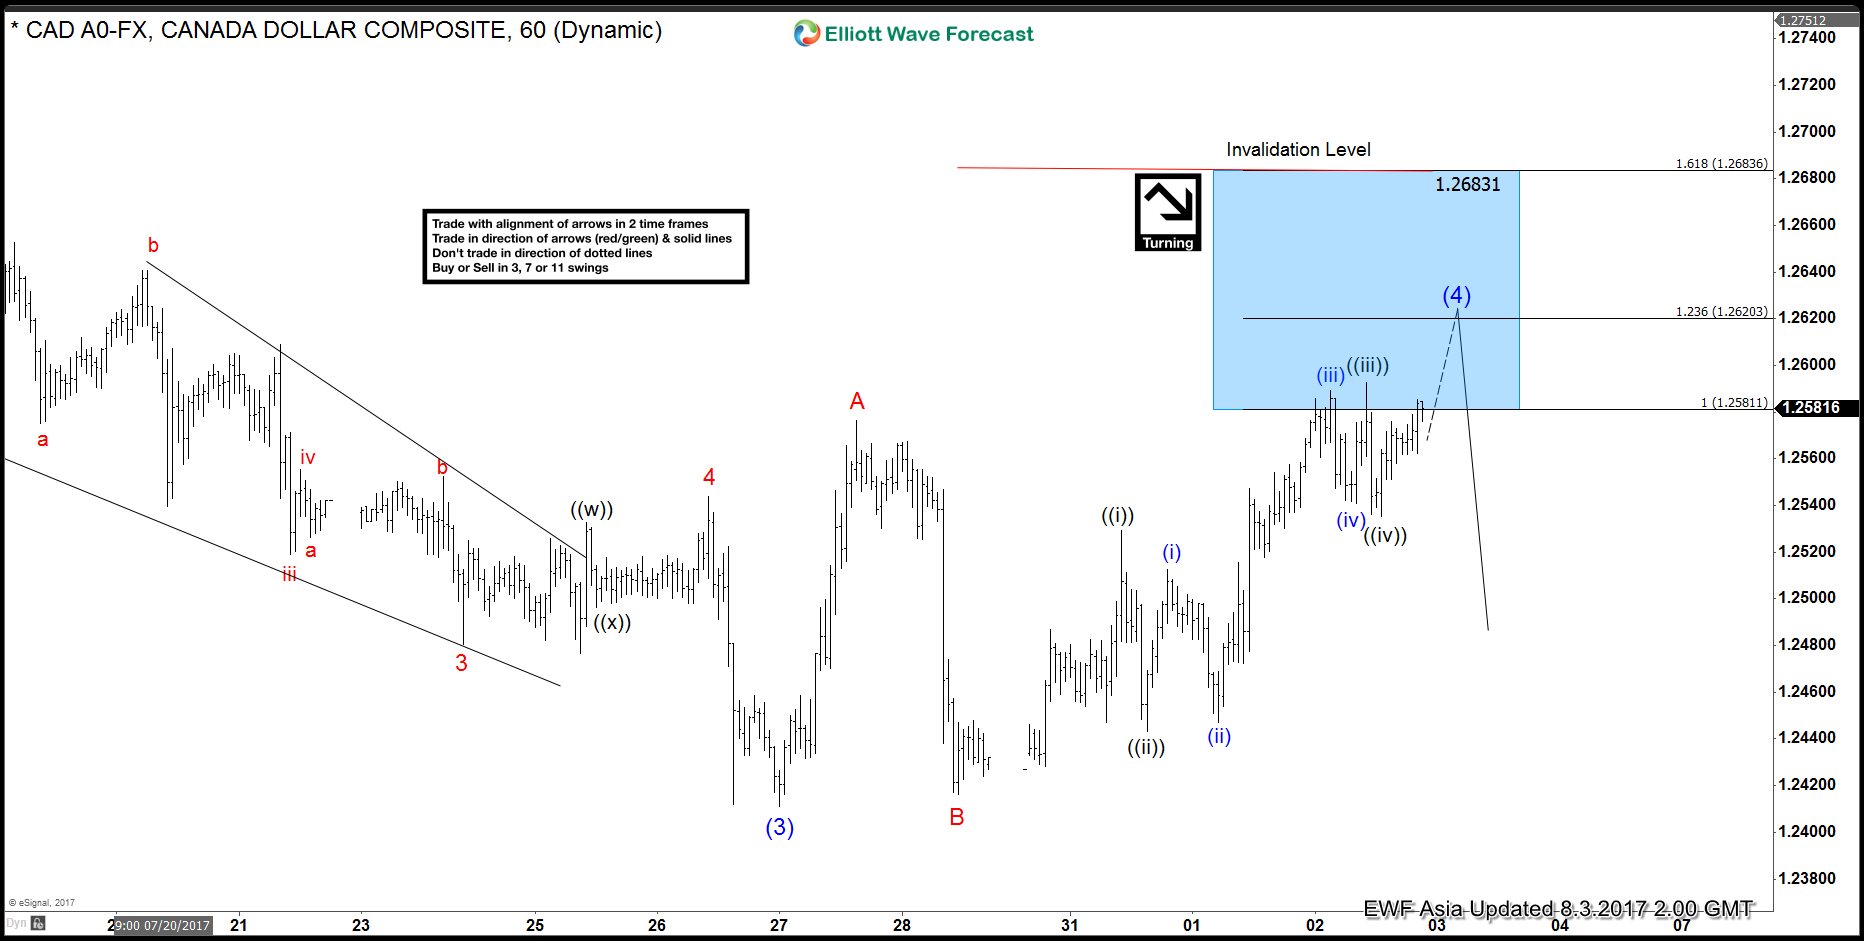
Daily USDCAD Bearish Sequence


USDCAD Daily Chart is showing a bearish sequence from 1.19.2016 peak as the pair broke below 5.2.2016 low. Although bounces could be expected in the near term, pair has scope to extend lower towards 1.123 – 1.171 area in the next few months before larger support can be seen. We expect USDCAD to remain heavy despite the selloff in the past 2 months.

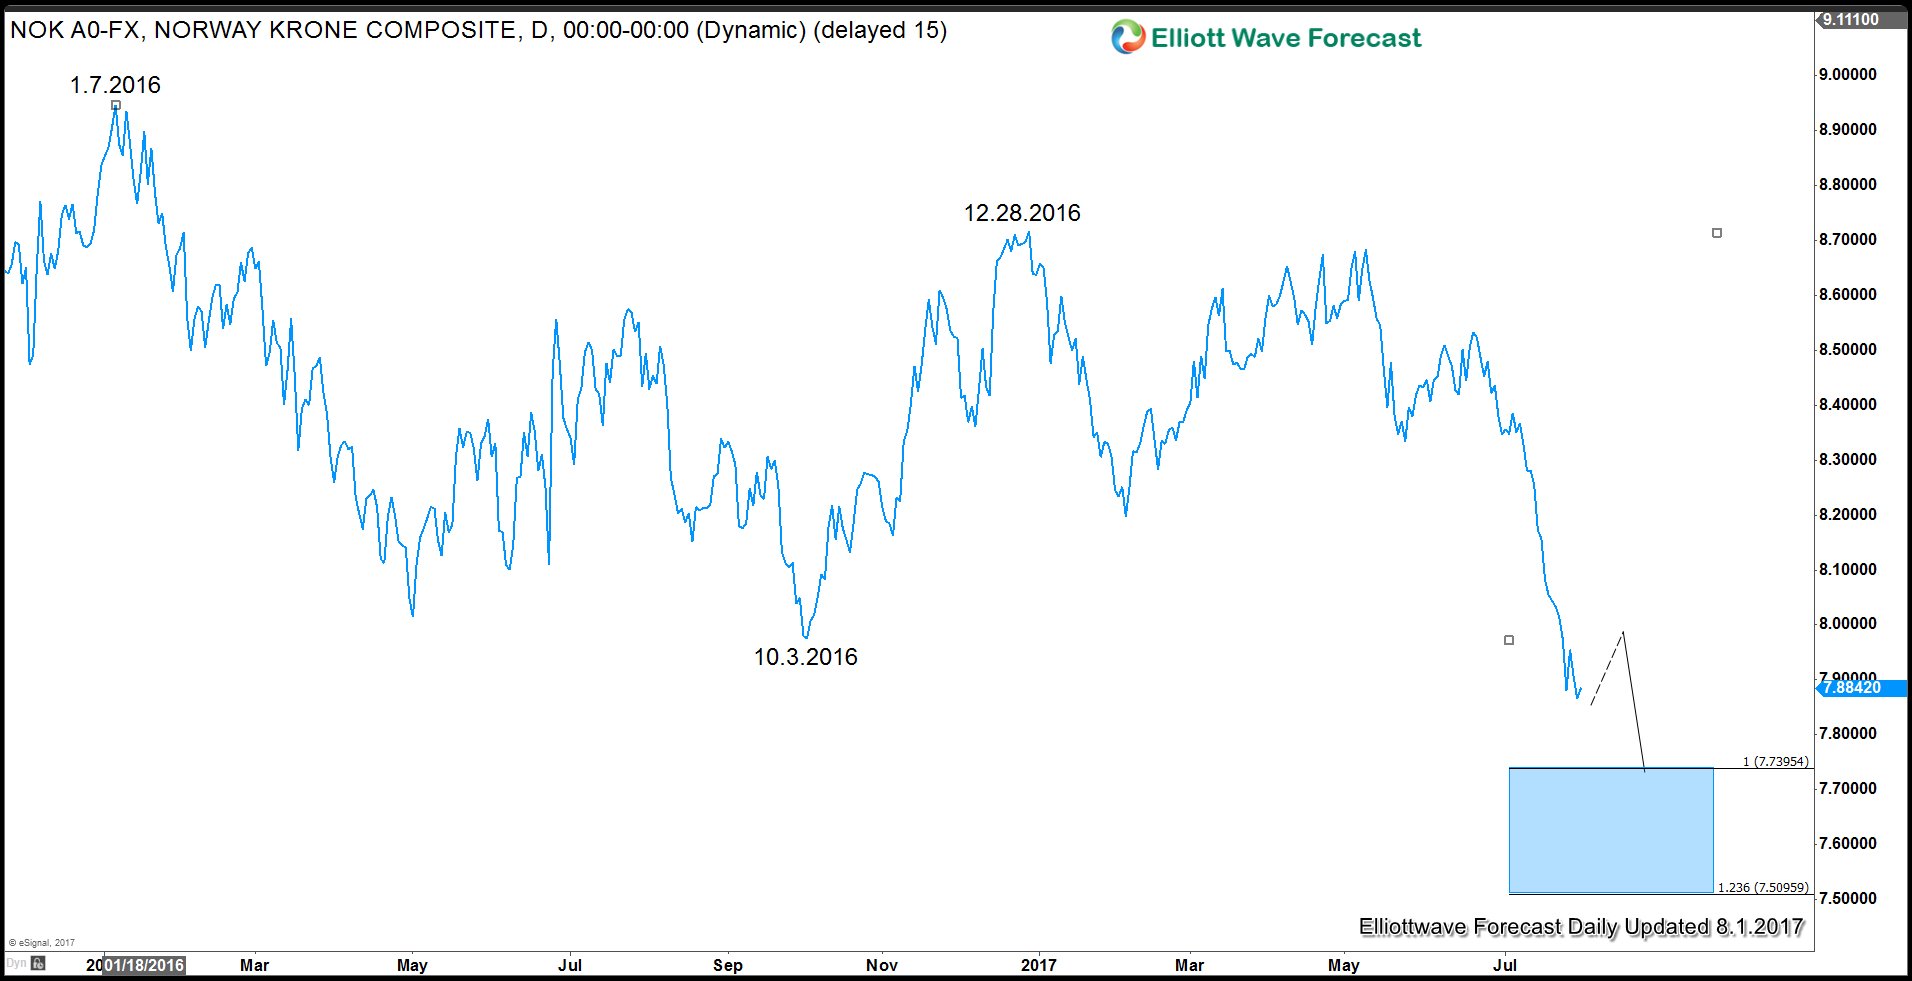
Daily USDNOK bearish sequence


Similar to USDCAD, Daily chart of USDNOK also shows bearish sequence from 1.7.2016 high as pair has broken below 10.3.2016. Pair has scope to extend lower to 7.5096 – 7.395 area to end cycle from 1.7.2016 peak before larger support is seen. The pair is also telling us that USD could remain heavy for the next few months, although short term bounces could be seen along the way.

As the market is dynamic, traders need to keep up with the most up-to-date analysis of their favorite instrument. Successful traders need to have a good trading system and also strict risk management with rules that define entry, stop loss, and take profit levels with high accuracy to allow traders to get into a risk free position in your trade as quickly as possible.
 

Elliottwave-Forecast

Master Trader
Feb 17, 2017
2,426
9
84
www.elliottwave-forecast.com
USDCAD Elliott Wave View: Flat correction

Short term USDCAD Elliott Wave view suggests the decline to 1.2411 ended Intermediate wave (3) of an Elliott Wave impulse structure from 6/2 peak. Intermediate wave (4) bounce is in progress as a flat Elliott wave structure where Minor wave A ended at 1.2576 and Minor wave B ended at 1.2416. Minor wave C is subdivided as an impulse Elliott Wave structure. Up from 1.2416 low, Minute wave ((i)) ended at 1.253, Minute wave ((ii)) ended at 1.2443, Minute wave ((iii)) ended at 1.2593 and Minute wave ((iv)) ended at 1.2355. Near term focus is on 1.262 – 1.2683 to complete Intermediate wave (4) flat. Afterwards, pair should either resume to new low or at least pullback in 3 waves. We don’t like buying the proposed bounce.

USDCAD 1 Hour Elliott Wave Chart


Elliott Wave FLAT structure is a 3 waves corrective pattern and there are 3 different types of Flats:
– Regular flat.
– Expanded flat
– Running flat.

The flat seen in USDCAD above is the Regular flat type. A Regular flat is a 3 waves corrective pattern which could often be seen in the market nowadays. The internal subdivision of Flat is labeled as A,B,C with 3-3-5 structure. Waves A and B are subdivided in corrective structures such as zigzag, flat, double three or triple three. Third wave C is always 5 waves structure, either as a motive impulse or an ending diagonal pattern. It’s important to notice that in a Regular Flat, wave B completes slightly above the starting point of wave A. Wave B usually ends at 50%, 61.8%, 76.4%, or 85.4% of wave A and Wave C of regular flat usually ends close to 100% -1.236% Fibonacci extension of A related to B.


Elliottwave-Forecast

Master Trader
Feb 17, 2017
2,426
9
84
www.elliottwave-forecast.com
EURCAD Selling Opportunity

On June 13/2017 I published an article EURCAD : Sell the Bounce Bearish Pattern where I called for the pair to make another move lower after a bounce/retracement higher. EURCAD since then bounced and continued lower as expected but did not fully close the April 13/2017 market gap as I would have liked it to do. With still a market gap yet to be closed we at ElliottWave-Forecast believe EURCAD will make another push lower and the chart below explains where bears will be waiting to push the pair lower.

EURCAD 4 Hour Chart Bearish Pattern: Traders need to wait for price to hit the BC 0.50% (1.4865) where blue point D can possibly terminate and trigger sells. As long as price stays below the point B high (1.5255) expect EURCAD to continue lower. The area to watch for possible reversal lower is 1.4865 – 1.4920


If looking to sell EURCAD traders should be patient and wait for price to make a move higher towards the BC 0.50% Fib. retracement level at 1.4866. Waiting for price to hit the BC 0.50% Fib. retracement minimum will offer a better risk/reward trade setup. Blue bullish pattern is invalidated if price moves above point B of the pattern.

Of course, like any strategy/technique, there will be times when the strategy/technique fails so proper money/risk management should always be used on every trade.

*** Always use proper risk/money management according to your account size ***
 

Elliottwave-Forecast

Master Trader
Feb 17, 2017
2,426
9
84
www.elliottwave-forecast.com
Dow E-mini Future Elliott wave calling upside

In this Technical blog we are going to take a quick look at the past 1 hour Elliott Wave performance of Dow E-Mini Future (YM_F ) cycle from June 19 peak, which we presented to our clients at elliottwave-forecast.com. We are going to explain the structure from that cycle.

Dow E-mini Future 1 Hour Elliott Wave Chart from June 29


The cycle from May low April 19,2017 low has ended in the index at June 19 peak (21494). Below from there index was correcting the April cycle & expected to find buyer’s in 3 or 7 swings for further upside in the index. The structure from the peak looks to be overlapping, hence suggested that it’s a corrective structure from the peak. Where First leg lower ended i.e. Minute wave ((w)) at (21297) & Minute wave ((x)) ended at (21497) and 21235-21185 100%-123.6% extension area was expected to find buyer’s in the index for more upside or for a 3 wave bounce at least.

Dow E-mini Future 1 Hour Elliott Wave Chart from July 12


Then the index found the dip again at 21225 low in Minute wave ((x)) as expected in 3 swings and resume the next leg higher in the index towards 21600-21688 100%-123.6% fibonacci extension area of previous ((w))-((x)) to end the cycle from June 29 low (21137) and to start the Minor wave X correction. ( Note we adjusted some degree of labeling on the chart to align with higher degree time frames).

Dow E-mini Future 1 Hour Elliott Wave Chart from July 25


The index ended the cycle from June 29 low in Minor wave W higher at 21676 peak and also finished correcting that cycle in Minor wave X at 21442 low as Regular flat structure and above from there and more importantly as far as the pivot from June 29 low stayed intact was expected to resume the upside in Minor Y leg higher to complete the 7 swings structure from June 29 low (21137).

Dow E-mini Future 1 Hour Elliott Wave Chart from July 27


As the dips remained above 21444 low index broke to new highs suggesting the next leg higher has started in the index & so the near term focus remained towards 21719-21769 area to start the 3 waves back in the index within Minutte wave (x) before further upside was seen.

Dow E-mini Future 1 Hour Elliott Wave Chart from July 28


Then the index did a shallow connector in Minutte wave (x) pullback at 21632 and resume higher as expected and now has already reached the 100%-123.6% fibonacci extension area at 21933-22049 target area from June 29 low in 7 swings target area from the longs we had from June 29 low.
 

Elliottwave-Forecast

Master Trader
Feb 17, 2017
2,426
9
84
www.elliottwave-forecast.com
USDCAD Elliott Wave View: Correction Ended

Short term USDCAD Elliott Wave view suggests the decline to 1.2411 ended Intermediate wave (3) of an Elliott Wave impulse structure from 6/2 peak. Intermediate wave (4) bounce is in progress as a flat Elliott wave structure where Minor wave A ended at 1.2576 and Minor wave B ended at 1.2416. Minor wave C is subdivided as an impulse Elliott Wave structure. Up from 1.2416 low, Minute wave ((i)) ended at 1.253 and pullback to 1.2443 ended Minute wave ((ii)). Pair then rallied in Minute wave ((iii)) ending at 1.2593 and Minute wave ((iv)) pullback ended at 1.2355. Near term, Minute wave ((v)) of C is proposed complete at 1.2619, which also complete Intermediate wave (4). While bounces stay below 1.2619, and more importantly below 1.2683, expect pair to extend lower or at least pullback in 3 waves. We don’t like buying the pair.

USDCAD 1 Hour Elliott Wave Chart


Elliottwave-Forecast

Master Trader
Feb 17, 2017
2,426
9
84
www.elliottwave-forecast.com
TSLA Elliott Wave Calling Higher & Buying the Dips

Tesla stock TSLA saw an impressive rally from the start of the year gaining +78% in 6 month before a correction took place and despite the recent decline the stock is still with +60% in profits. In this Technical Blog we’re going to take a quick look at the past Elliott Wave charts of TSLA and we’re going to take a look at the price structures and explain the forecast.

Early this year, we wrote an article “Do you want Tesla shares in your Portfolio ?” in which we forecasted a move higher above $300 and a break of the 3 year consolidation range.

TSLA Hourly Chart 03.18.2017


TSLA first rally from November 2016 low ended on 02/13/2017 peak and the pullback unfolded as a 3 waves Flat structure which is tricky to trade but the stock bounced from the 1.618 Fibonacci extension level $142 and started rallying from there. At that stage we kept looking for buying opportunities in 3 , 7 or 11 swing and the second one came within the pullback against 241 low as TSLA found buyers around the 50% – 76% Fibonacci retracement area ( 253 – 247 ).

TSLA Daily Chart 04.13.2107


The automaker continued to impress as it managed to make new all time highs above 2014 peak which opened further extension to the upside showing an incomplete bullish sequence with a minimum target around $350 that’s why the stock remained supported into every dips in 3 , 7 or 11 swings.

TSLA Hourly Chart 05.17.2107

TSLA Hourly Chart 06.12.2017


The short term price action was ideal to join the ride to the upside as the stock kept making new highs and every Elliott wave corrective pullback provided the right levels to be able to buy the stock with a specific stop. On June the 12th, TSLA was looking to do a final push higher toward equal legs area 386 – 395 before ending 5 waves move as part of a bigger cycle and that was the ideal target for buyers to take profits.

TSLA Daily Chart 07.06.2017

From the mentioned area above, TSLA made a sharp correction to the downside and managed to end the cycle from November lows. However, buyers appeared again at the blue box area ( 306 – 282 ) where a 3 waves bounce at least were expected to happen.

TSLA Hourly Chart 08.02.2017


On 08/02/2017, we were looking for the stock to hold above the $303 low and rally from a short term extreme area. Later that day, Tesla reported it’s earning with a better number then expected in revenue which made the stock surge 8% after the close. But will it be able to continue the move higher to make a new all time highs or it’s just doing a 3 waves bounce which will end up failing below June peak for another correction to the downside ?
 

Elliottwave-Forecast

Master Trader
Feb 17, 2017
2,426
9
84
www.elliottwave-forecast.com
FTSE 100 Elliott Wave View: Pullback expected

Short term FTSE 100 ( UKX-FTSE ) Elliott Wave view suggests that Minor wave B ended on 6/30 low 7302.7 and the rally from there is unfolding as a double three Elliott wave structure where wave ((w)) ended at 7515.12 and wave ((x)) pullback ended at 7338.2. Index has reached 100% from 6/30 low so cycle is mature and Minor wave 1 can be complete anytime. Expect the Index to pullback in Minor wave 2 soon to correct cycle from 6/30 low before the rally resumes. As far as pivot at 7302.7 low remains intact, Index should find buyers within Minor wave 2 dips in the sequence of 3, 7, or 11 swing for further upside. If pivot at 7302.7 low fails during later pullback, the Index would be still remain in the same cycle from 6/2 peak. Index should then extend the correction to the downside. We don’t like selling the Index.

FTSE 1 Hour Elliott Wave Chart


Elliottwave-Forecast

Master Trader
Feb 17, 2017
2,426
9
84
www.elliottwave-forecast.com
Will North Korea situation create a Market correction?

The situation in North Korea went to another level last week when President Trump made some “Fire and Fury” comment. His response to the provocation by North Korea resulted in risk off with sell off across the market, higher VIX, Yen strength. Precious metals such as Gold and Silver also saw bids and started to rally in the back of the news. But did Indices really sell off because of President’s Trump remark as the business news and social media make it to be?

What’s interesting is that this is not the first time that the verbal exchange between North Korea and U.S. government happens. In the past, North Korea has also tested missiles several times and yet nothing happened with the market. So why now after Trump’s remark of “Fire and Fury”, suddenly the news media think this is the reason for the selloff? In reality, the market was already in the position to sell off before Trump’s remark. A close look at the Elliott Wave technical charts suggest the sequences and targets within the cycles in Indices and Yen pairs already warn us the impending selloff.

Many traders and so called experts try to relate the news and the tension created as the cause of the move, but the reality is otherwise. Market always shows a mysterious and impeccable timing when it reaches important area where sequences and cycles could end. Some news typically come out when cycles and sequences are over and those news are being used to justify the turn and create the backdrop story that people love to hear.

We at Elliottwave-Forecast who believe in technical trading always wonder why the news event always comes at the right moment when market is either ready for the move or it is showing sequences for the next move. We are always a bit suspicious about this coincident and in Live sessions, we tell members not to follow news events. We believe a better way is to follow the technical sequences, cycles and the Elliott wave patterns which speak louder than any news event or comments around the world.

In June 12th 2017, we published an article titled NIFTY-NSE: Next Warning Area for the Bulls. In the article, we showed the target of the $NIFTY-NSE, and we use this target as a possible end of the February 2016 low cycle across the World Indexes. At that time, the Nifty Index was showing a clear structure and lagging other Indices across the World. We said in the article that when NIFTY reaches 10053 area, the World Indices were ready for a 4 Hour pullback and this will represent a good sell off .

We also predict that this pullback will create another hysteria across Investors and World news outlets, and predictably everyone will be calling for another crash. We knew this before it happens, and like we always said the key for all investor is to anticipate the move, not to react to a news event. The June 12th, 2017 chart below shows Nifty was about to reach the blue box at that time and we forecasted it to turn lower. This is the exact area where Nifty and other world indices turned lower last week.

NIFTY Elliott Wave Chart in June 12th Looking for 10049 – 10557 target then a turn
NIFTY-NSE-DAILY20170612125224-Daily.jpg

This goes to show the complete anticipation of the turn and manipulation of the Market. In 2015 , we did another article titled $NIFTY reaching a warning area for the bulls. In this article, we also used the $NIFTY-NSE as a tool to spot the turn and we were also right. Why? Because we understand the sequence and cycle of the market. We can calculate the target and we know the market does not run in a straight line. The following chart shows the sequence of $NIFTY entering the 2015. It is showing a 7 swing sequence and has already reached the blue box (inflection area), so we knew either way the Index needs to pullback.

NIFTY Quarterly Chart in 2015 reaching inflection area and looking for pullback
NIFTY-NSE-WEEKLY20150625165101-1024x510.jpg

We mentioned earlier how YEN was supposed to get strong regardless of the news and the following chart of $USDJPY is showing the sequence and the YEN strength entering into last week news about North Korea.

USDJPY 4 Hour Elliott Wave Chart looking for more downside before North Korea news
1JPY-24020170813191439.png


It’s interesting to see that event and news happen when the market either has the minimum number of swings or has reached the target areas. Our years of analysis and trading lead us to believe that the market is completely manipulated and market makers use the events and news to justify the move. Technical trading is superior to news trading as it allow us to anticipate a market turn and quantify the risk.

We have been able to help investors to buy dips in the World Indices in the past years because we believe in sequence, cycle and targets. We advise every trader not to use news event and world situations as the basis of trading. Instead, traders need to understand the reality that the market is running in cycles and sequences and looking for specific target. The news events are part of the oscillations, but do not make the market.
 

Elliottwave-Forecast

Master Trader
Feb 17, 2017
2,426
9
84
www.elliottwave-forecast.com
Gold Elliott Wave View: More Upside

Short term Gold (XAUUSD) Elliott Wave view suggests that rally from 7/10 low is unfolding as a a double three Elliott wave structure. Up from 7/10 low (1204.69), Minor wave W ended at 1274.11 and pullback to 1251.27 ended Minor wave X. Wave Y is currently in progress as a zigzag Elliott wave structure where Minute wave ((a)) is expected to complete with one more leg higher and can reach as high as 1294.3 – 1304.6, then it should pullback in Minute wave ((b)) before the rally resumes, We don’t like selling Gold and expect buyers to appear again after Minute wave ((b)) pullback is complete in 3, 7, or 11 swing, provided pivot at 1251.27 low remains intact.

Gold 1 Hour Elliott Wave Chart
 

Elliottwave-Forecast

Master Trader
Feb 17, 2017
2,426
9
84
www.elliottwave-forecast.com
Dow Future Elliott Wave View: Resuming Higher

Short term Dow Futures (YM_F) Elliott Wave view suggests that rally from 6/29 low is unfolding as a a double three Elliott wave structure. Up from 6/29 low (21138), Minor wave W ended at 22132 and pullback to 21790 ended Minor wave X. Rally from there is unfolding as an impulse Elliott wave structure. Up from 21790, Subminutte wave i ended at 21884, Subminutte wave ii ended at 21815, Subminutte wave iii ended at 21988 and Subminutte wave iv ended at 21946. Expect Subminutte wave v of (a) to complete soon and thus cycle from 8/11 low to end. Index should then pullback in Minutte wave (b) to correct cycle from 8/11 low before resuming higher again. We don’t like selling the proposed pullback and expect buyers to appear once Minutte wave (b) pullback is complete in 3, 7, or 11 swing provided pivot at 21787 low stays intact.

Dow Future 1 Hour Elliott Wave Chart
 

Elliottwave-Forecast

Master Trader
Feb 17, 2017
2,426
9
84
www.elliottwave-forecast.com
Dow Futures Elliott Wave View: 3 waves pullback

Short term Dow Futures (YM_F) Elliott Wave view suggests that rally from 6/29 low is unfolding as a a double three Elliott wave structure. Up from 6/29 low (21138), Minor wave W ended at 22132 and pullback to 21790 ended Minor wave X. Rally from there is unfolding as an impulse Elliott wave structure. Up from 21790, Subminutte wave i ended at 21884, Subminutte wave ii ended at 21815, Subminutte wave iii ended at 21988, Subminutte wave iv ended at 21946, and Subminutte wave v of (a) ended at 22034. Minutte wave (b) is in progress to correct cycle from 8/11 low in 3, 7, or 11 swing before the Index resumes the rally. We don’t like selling the proposed pullback and expect buyers to appear once Minutte wave (b) pullback is complete in 3, 7, or 11 swing provided pivot at 21787 low stays intact.

Dow Futures 1 Hour Elliott Wave Chart
 

Elliottwave-Forecast

Master Trader
Feb 17, 2017
2,426
9
84
www.elliottwave-forecast.com
SPX forecasting the rally and buying the dips

Hello fellow traders. In this technical blog we’re going to take a quick look at the past Elliott Wave chart of SPX published in members area . In further text we’re going to explain the Elliott Wave count and trading strategy.

SPX Elliott Wave 1 Hour Chart 06.27.2017
As our members know, we were pointing out that SPX is supported due to its bulish sequences in Daily time frame. Back then, the index was showing incomplete bullish swings structure in the cycle from the 2083.4 ( November’s 2016 low). Consequently, we recommended members to avoid selling it and keep buying the dips in 3,7,11 swings. On the chart below we can see the index is bullish against the 2415.78 pivot in first degree. We expect it to ideally complete 3 waves from the peak soon. Short term technical area: 2427.14-2421.7 should ideally see buyers for 3 wave bounce. We recommend members to buy it at these levels against the 2415.7 invalidation level , and to make position risk free as soon bounce happen.


SPX Elliott Wave 1 Hour Chart 06.29.2017
The index found buyers as expected. SPX bounced from there and made long positions risk free. In mean time sellers were strong and the index made the new short term low. We measured next set of equal legs area from the peak and we got 2409.6-2401.6 as new buying zone. As we were out of the prevous trade without loss, we opened new long positions at mentioned area.


SPX Elliott Wave 1 Hour Chart 06.30.2017
We got nice reaction from buying zone and made long positions risk free. While the price stays above 2405.72 we’re calling wave 4 red pull back completed there and keep open long positions, expecting further rally toward new highs.


SPX Elliott Wave 4 Hour Chart 08.03.2017
In the mean time the index retested 2405.72 low and held it. We got nice rally toward new highs. The price has reached important technical area at 2483.95-2503.19 where buyers will be taking profits. Keep in mind market is very dynamic.

https://elliottwave-forecast.com/amember/go.php?r=2885&i=l3


Elliottwave-Forecast

Master Trader
Feb 17, 2017
2,426
9
84
www.elliottwave-forecast.com
Microsoft Reaching Extreme Area

Microsoft stock (NASDAQ: MSFT) is reaching an important equal legs area around 75 – 83 coming from 2009 low . The video below explains what we expect the stock to do from there and how this will affect the rest of the market.


Microsoft is showing 3 swings from all time lows and approaching the equal legs area ( 75 – 96 ) where a correction can be seen, but the move from 2009 low could still extend further if it’s the 3rd wave of an impulsive 5 waves move that’s why it’s not recommended to sell it despite it’s reaching a multi-year extreme area.


The cycle from 2009 low can be counted as an impulsive move with an extended 5th wave which still needs to end wave III then a pullback in IV before a final rally to end that cycle. This scenario is supporting more upside into the blue box area 74.92 – 83.23 and suggesting that pullbacks can still be bought in 3 , 7 or 11 swings.

Microsoft Daily Chart ( 5 waves )


The second scenario is suggesting that MSFT is doing a double three 7 swings structure which also will be reaching equal legs area 74.92 – 83.23 and from there a pullback is expected to happen to correct that cycle.

Microsoft Daily Chart ( 7 swings )


Consequently, both scenario presented above are indicating that Microsoft is reaching an important extreme area that could put pressure on the stock and produce a correction from there later on. Adding to that, we have Amazon stock and Nifty Index reached equal legs area from 2016 low which means that cycle is in bonus time if not already ended that’s why we need to be careful about chasing the long side in the stock market.

Amazon Daily Chart

AMZN-2016-Cycle-1024x523.png


NIFTY Daily Chart

NIFTY-2016-Cycle-1024x523.png


Recap
Microsoft is one of the strongest companies and it’s heavily correlated to Nasdaq which already reached a similar area, so if we combine both instrument then we notice that there could be a choppy time ahead for the technology sector which will be also reflected on the rest of the market.
 

Elliottwave-Forecast

Master Trader
Feb 17, 2017
2,426
9
84
www.elliottwave-forecast.com
USDX Elliott wave view: Double three

Short term USDX index Elliott Wave view suggests that the decline to 8/02 (92.54) low ended intermediate wave (3) then the rally from there is unfolding as a a double three Elliott wave structure. As the structure from the 8/02 looks to be overlapping, hence suggesting it’s corrective structure, either W,X,Y or W,X,Y,Z.

Where the first leg higher ended in Minor wave W at 93.77 & pullback to 92.93 low ended Minor wave X. Minor wave Y currently in progress as double three structure , where Minute wave ((w)) ended at today’s peak 94.04. And while near term dips remains above 92.93 low index has scope to extend 1 more push higher towards 94.27-94.59 100%-123.6% fibonacci extension area to end the cycle from 8/02 lows in intermediate wave (4) bounce then index has scope to resume the decline or should do a 3 waves pullback at least ( if it continues to extend higher later on as W,X,Y,Z). However we don’t like buying the index and expect seller’s to appear again in between 94.27-94.59 area for more downside or for 3 waves pullback at least.

USDX 1 Hour Elliott Wave Chart


Elliottwave-Forecast

Master Trader
Feb 17, 2017
2,426
9
84
www.elliottwave-forecast.com
Dow Futures Elliott Wave View 8.17.2017

Short term Dow Futures (YM_F) Elliott Wave view suggests that rally from 6/29 low is unfolding as a a double three Elliott wave structure. Up from 6/29 low (21138), Minor wave W ended at 22132 and pullback to 21790 ended Minor wave X. Rally from there is unfolding as an impulse Elliott wave structure. Up from 21790, Subminutte wave i ended at 21884, Subminutte wave ii ended at 21815, Subminutte wave iii ended at 22034, Subminutte wave iv ended at 21942, and Subminutte wave v of (a) ended at 22067. Minutte wave (b) is in progress to correct cycle from 8/11 low in 3, 7, or 11 swing before the Index resumes the rally. We don’t like selling the proposed pullback and expect buyers to appear once Minutte wave (b) pullback is complete in 3, 7, or 11 swing provided pivot at 21787 low stays intact.

Dow Futures 1 Hour Elliott Wave Chart
 

Elliottwave-Forecast

Master Trader
Feb 17, 2017
2,426
9
84
www.elliottwave-forecast.com
GOOGL Awaiting New Highs with the new Google Android 8.0 OS Version

Before we get into the subject, Alphabet, Inc. is a holding company and engages in acquisition & operation of different companies and operates through the Google and Other Bets segments. The Google segment includes Internet products such as the Google Search engine, Google Ads, Google Commerce, Google Maps, YouTube, Apps, Cloud, Android, Chrome, Google Play as well as hardware products, such as Chromecast, Chromebooks and the well known Nexus Smartphones. Other Bets segment includes businesses such as Access or Google Fiber, Calico, Nest, Verily, GV, Google Capital, X, and other initiatives. Alphabet Inc is headquartered in Mountain View, CA.

Google (NASDAQ:GOOGL) presentation of the new version of its Operating System for Smartphone and Tablets is just a few days away. According to some tweets from a pair of well-connected Android reporters, the specific day for release at this stage should be August 21st where Android 8.0 (Oreo?) will be coming finally publicly available.

Currently in Beta Version for Testers and Programmers, according to Google, the new Android 8.0 version is expected to deliverer many performance, security and user experience improvements over the latest Android Nougat 7.0 version introduced back in August the 22nd of 2016. Those improvements should help Google with the overall mobile search segment which in combination with the YouTube platform are the main drivers of growth for Alphabet Inc. In numbers, Google’s mobile search segment performed superbly this quarter, total advertising revenue was spurred upwards by increased mobile search use. Worth to note that both Android and IOS (Apple) devices use Google search as a default search engine and the increased usage of mobile devices over the last few years has resulted in Alphabet’s mobile search growth. As of their latest quarter, there are now over 2 billion monthly active Android devices around the world and keep increasing. Not only does this increase in users help mobile search growth but it helps their application store, Google Play and many more to generate more revenue for the company.

When it comes to Google’s Stock analysis, price has been consolidating sideways since the 06.05.2017 unable to break above the recent highs at 1008.61 and break below recent lows at 915.31 indicating that the Investors waiting for a catalyst for direction, possibly the announcement of Android 8.0 OS in a few days or if later, the presentation of the Google’s new Pixels Smartphones devices which is are in direct competition with Apple’s iPhones.

According to our proprietary system of equal legs extensions, the 3, 7 and 11 swings market sequence and Market Analysis via correlations, despite that GOOGL already reached the target of the equal legs for the cycle from 01.12.2015, we still believe that the stock can see new highs from current levels or at least a 3 wave bounce from lower against the yearly trendline. Below our Weekly Elliott Wave count which is calling for one more leg higher before the stock start to correct the cycle from 01.12.2017 at the 490.91 lows.


In the shorter cycles, we are waiting to see GOOGL complete the consolidation from 06.05.2017 in waves ((iv)), ideally test the yearly supporting trendline, from there see a bounce and decide whether price will extend to new highs or do at least a 3 swing bounce before fail again. In either case, we expect the bounce against the trendline to create a Risk Free position and if the bounce fail to extend into new highs to get stopped at least Break even.
 

Elliottwave-Forecast

Master Trader
Feb 17, 2017
2,426
9
84
www.elliottwave-forecast.com
Dow Futures Elliott Wave view 8.18.2017

Short term Dow Futures (YM_F) Elliott wave view suggest that the rally to 8/08 peak 22177 ended the “Cycle” from Feb 11, 2016 low. The decline from there is unfolding as an impulse suggesting the index could be following a Elliott Wave Zigzag pattern in larger degree correction. From there Intermediate wave (1) ended at 21789 in 5 waves at 21789 low and bounce from there ended in 3 swings at 22070 peak as another zigzag pattern within intermediate wave (2).

The decline from there is unfolding as an impulse Elliott wave structure within intermediate wave (3). Below from 21789 peak, Minor wave 1 ended at 21993, Minor wave 2 ended at 22034 peak. Below from there Minute wave ((i)) ended at 21885, Minute wave ((ii)) ended at 21950, Minute wave ((iii)) ended at 21705 low and above from there doing a Minute wave ((iv)) bounce. Which is expected to unfold in 3 swings and shouldn't pass the 0.382% Fibonacci retracement area 21798 of Minute wave ((iii)) for the idea to remain alive for further downside in Minute wave ((v)) of 3 lower initially. We don’t like selling the pullback and expect further downside extension as far as pivot from 22070 peak & more importantly from 22177 peak remains intact to continue correction lower.

Dow Futures 1 Hour Elliott Wave Chart
 

Elliottwave-Forecast

Master Trader
Feb 17, 2017
2,426
9
84
www.elliottwave-forecast.com
USDJPY Elliott Wave View: Ending bounce

Short term USDJPY Elliott wave view suggest that the decline from 7/11 peak is unfolding as a double three Elliott wave structure. Decline to 108.71 low ended Minor wave W and correction of that cycle ended in a Minor wave X at 110.95 peak. Subdivision of Minor wave Y is unfolding as a Zigzag structure. Minute wave ((w)) of ((Y) ended at 108.59 low and Minute wave ((x)) of (Y) bounce is in progress as another Zigzag structure.

Up from 108.59 wave ((w)) low, Minutte wave (a) of ((x)) ended at 109.6 peak and Minutte wave (b) of ((x)) pullback ended at 108.609. Above from there, Minutte wave (c) of ((x)) is in progress towards 109.67-109.92 or 100%-123.6% Fibonacci extension area of (a)-(b). Afterwards, pair should resume the decline or pullback in 3 swings at least. We don’t advise buying the pair into the bounce. Expect sellers to appear after Minute wave ((x)) bounce is complete in 3, 7 or 11 swings for further downside, provided pivot at 110.95 peak stays intact.

1 Hour USDJPY Elliott Wave Chart
 

Elliottwave-Forecast

Master Trader
Feb 17, 2017
2,426
9
84
www.elliottwave-forecast.com
HPQ HP Inc Earnings Report and Price Analysis for 08/23/17

According to Nasdaq.com, NYSE HPQ HP Inc. is expected to report earnings on 08/23/2017 after market close. The report will be for the fiscal Quarter ending Jul 2017. According to Zacks Investment Research, based on 6 analysts’ forecasts, the consensus EPS forecast for the quarter is $0.42. The reported EPS for the same quarter last year was $0.48. Last quarter, the company posted a positive earnings surprise of 2.6%. Notably, the stock surpassed the Zacks Consensus Estimate thrice and came in line once, over the trailing four quarters. It has an average positive earnings surprise of 3%.

Few Words about NYSE:HPQ. HP Inc. (also known as Hewlett Packard) is an American technology company leading as a global provider in computing and imaging solutions and services for business and home. The company is focused on capitalizing on the opportunities of the Internet and the proliferation of electronic services. Its major businesses include Imaging and Printing Systems, Computing Systems and Information Technology Services. HPQ was formed on November 1, 2015 out of the personal computer and printer divisions of the original Hewlett-Packard Company, with its enterprise products and services businesses becoming Hewlett Packard Enterprise. The split was structured so that Hewlett-Packard changed its name to HP Inc. and spun off Hewlett Packard Enterprise as a new publicly traded company. HP Inc. retains Hewlett-Packard’s pre-2015 stock price history and its former stock ticker symbol, HPQ, while Hewlett Packard Enterprise trades under its own symbol, HPE.

Regarding the coming earnings, Zacks.com model does not support that HP will likely beat the Zacks Consensus Estimate in its upcoming release due to that fact that Earnings ESP, which represents the difference between the Most Accurate estimate and the Zacks Consensus Estimate, is currently pegged at 0.00%. This is because the Most Accurate estimate of 42 cents comes in line with the Zacks Consensus Estimate. One more reason for the above assumption is that HP carries a Zacks Rank #2. Though this increases the predictive power of ESP, the company’s ESP of 0.00% makes surprise prediction difficult.

Despite that, many analyst hold Bullish HPQ due to the following reasons:
  • HP is the leader in Printing Company World Wide especially after September 12, 2016 announcement that Hewlett Packard NYSE:HPQ set to buy Samsung Electronics’ OTC:SSNLF printer business for a cash payment of $1.05 billion. The acquisition is expected to close in 2017 and is expected to be accretive in the first full year following closing. After closing, Samsung has agreed to make a $100 million to $300 million equity investment in HP through open market purchases.
  • Numerous Studies surfing the internet indicating by various Price Valuation Models, HPQ Stock price still remains relatively undervalued.

When it comes to our view relating to NYSE:HPQ, in the weekly time frame we remain overall Bullish the Stock. At this stage we would like to see a break above the multi year descending trend line around the 20’s and from there expect price to extend to the 22’s – 25’s area to reach the equal legs – 1.236% extension from the 11/19/2012 cycle’s lows at 5.16 before price could see sellers and correct lower. Note, HPQ can see a continuation in the pull back towards the supporting trendline around the level of 17.80’s before extend higher or see at least a 3 wave bounce against the highs at 19.60’s.

HPQ HP Inc Weekly


In the case of new highs above 24.85’s (wave b red) then the Stock will mark a incomplete bullish sequence in the weekly time frame from 07/22/2002 and from there recommend the buying the dips in 3 7 or 11 swings.
 

Elliottwave-Forecast

Master Trader
Feb 17, 2017
2,426
9
84
www.elliottwave-forecast.com
USDJPY Elliott Wave View: Turning Lower

Short term USDJPY Elliott wave view suggest that the decline from 7/11 peak is unfolding as a double three Elliott wave structure. Decline to 108.71 low ended Minor wave W and Minor wave X bounce ended at 110.95 peak. Subdivision of Minor wave Y is unfolding as a Zigzag structure. Minute wave ((w)) of ((Y) ended at 108.59 low and Minute wave ((x)) of (Y) bounce is proposed complete at 109.82.

However, a break below 108.59 is needed to add conviction to this view. Until then a double correction in Minutte wave ((x)) can’t be ruled out. Near term, as far as pivot from 110.95 peak stays intact, expect pair to extend lower in Minute wave ((y)) or pullback in 3 waves at least. We don’t advise buying the pair and expect more downside in the pair towards 107.46-106.92 area next before a bounce is seen.

USDJPY 1 Hour Elliott Wave Chart