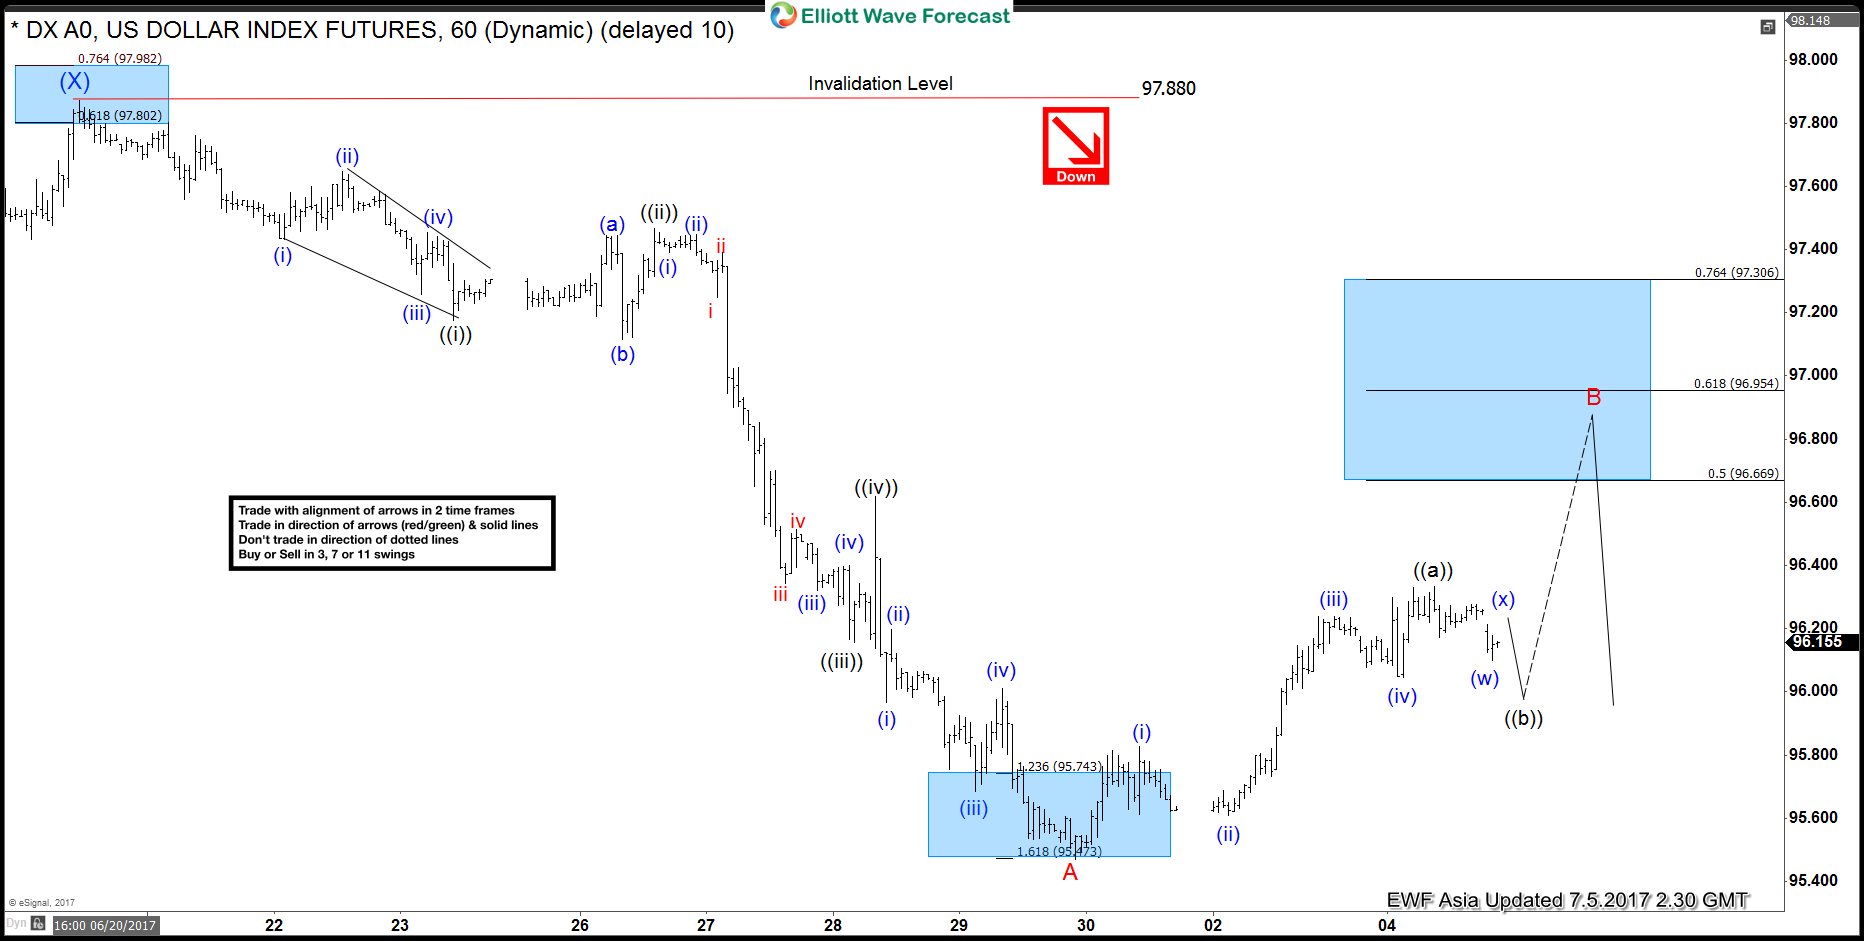
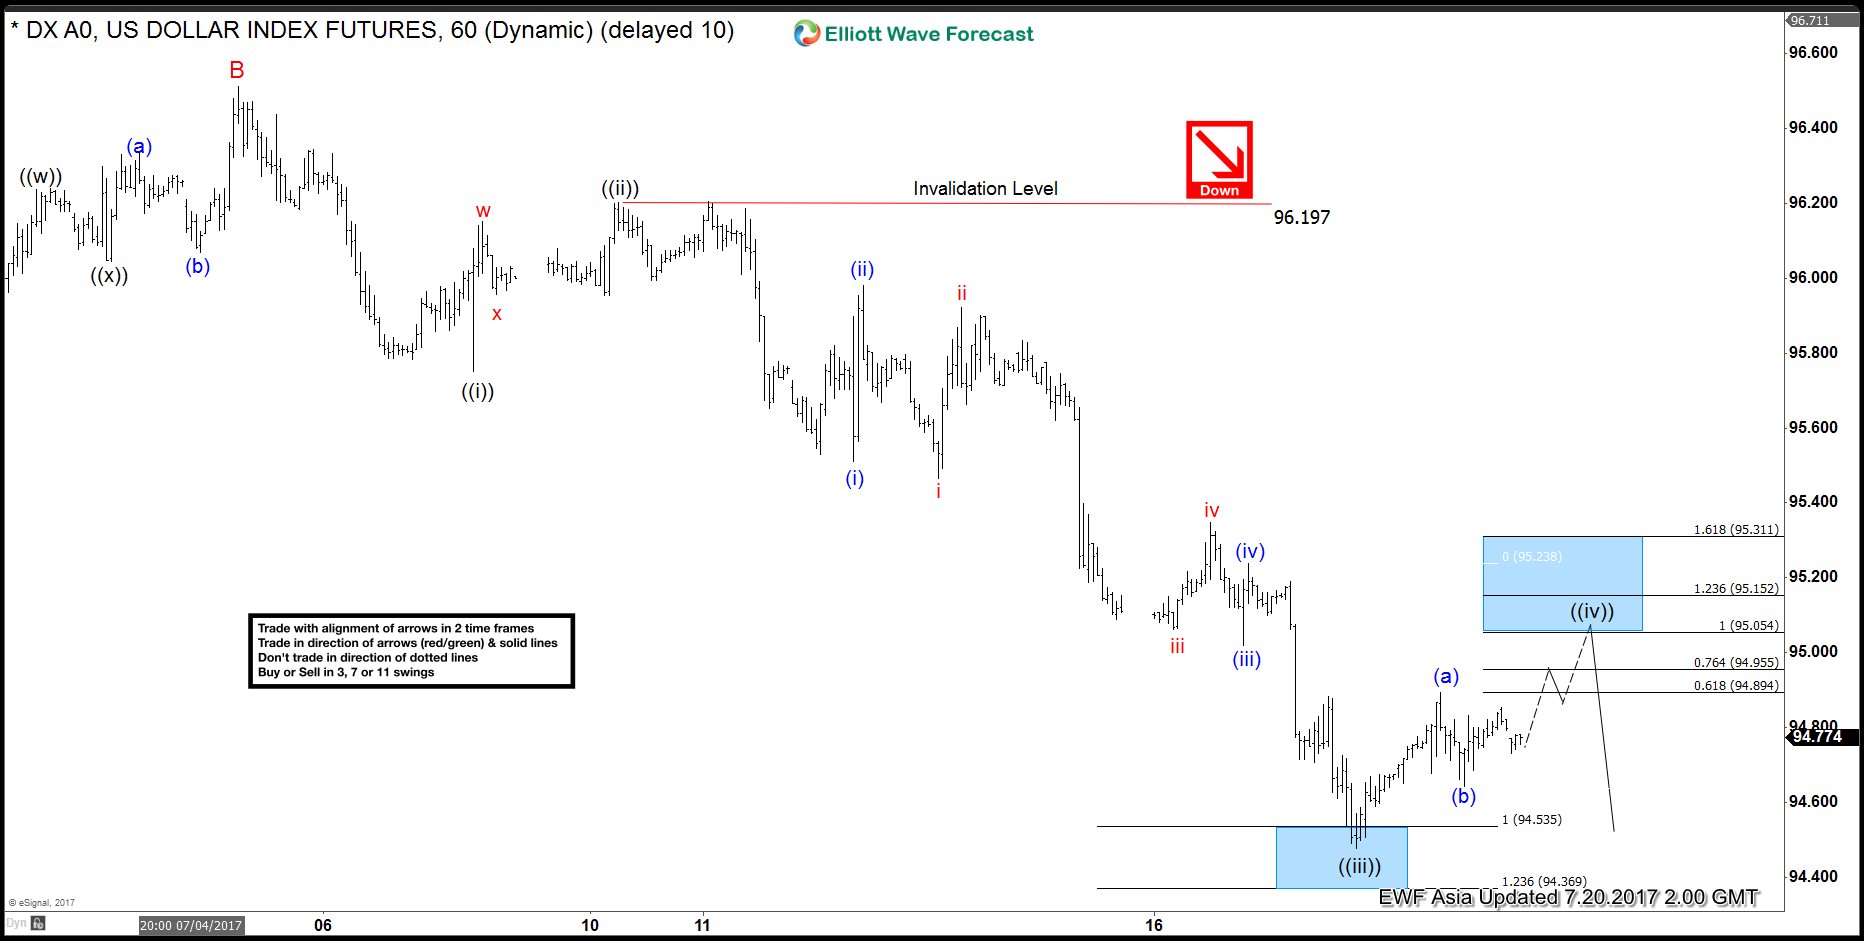
Short term USDX (USD Index) Elliott Wave view suggests the rally to 97.88 high on 6/20 ended Intermediate wave (X). Decline from there is unfolding as an impulse Elliott Wave structure with extension and ended at 95.47 low on 6/29. This 5 wave move could be Minor wave A of an Elliott wave zigzag structure structure, where Minute wave ((i)) ended at 97.17 and Minute wave ((ii)) ended at 97.47. Minute wave ((iii)) ended at 96.15, Minute wave ((iv)) at 96.61 and Minute wave ((v)) of A ended at 95.47.
Minor wave B bounce is currently in progress to correct cycle from 6/20 peak. The subdivision of Minor wave B is unfolding as an Elliott wave zigzag structure. Minute wave ((a)) ended at 96.33 and near term, Minute wave ((b)) pullback is in progress to correct cycle from 6/29 low in 3, 7, or 11 swing before turning higher again. While the pullback stays above pivot at 6/29 low (95.47), USDX has scope to extend higher one more leg towards 96.66 – 96.95 area to end Minor wave ((c)) of B. Afterwards, while bounces stay below pivot at 6/20 high (97.88), expect USDX to resume lower again. We don’t like buying the proposed bounce.
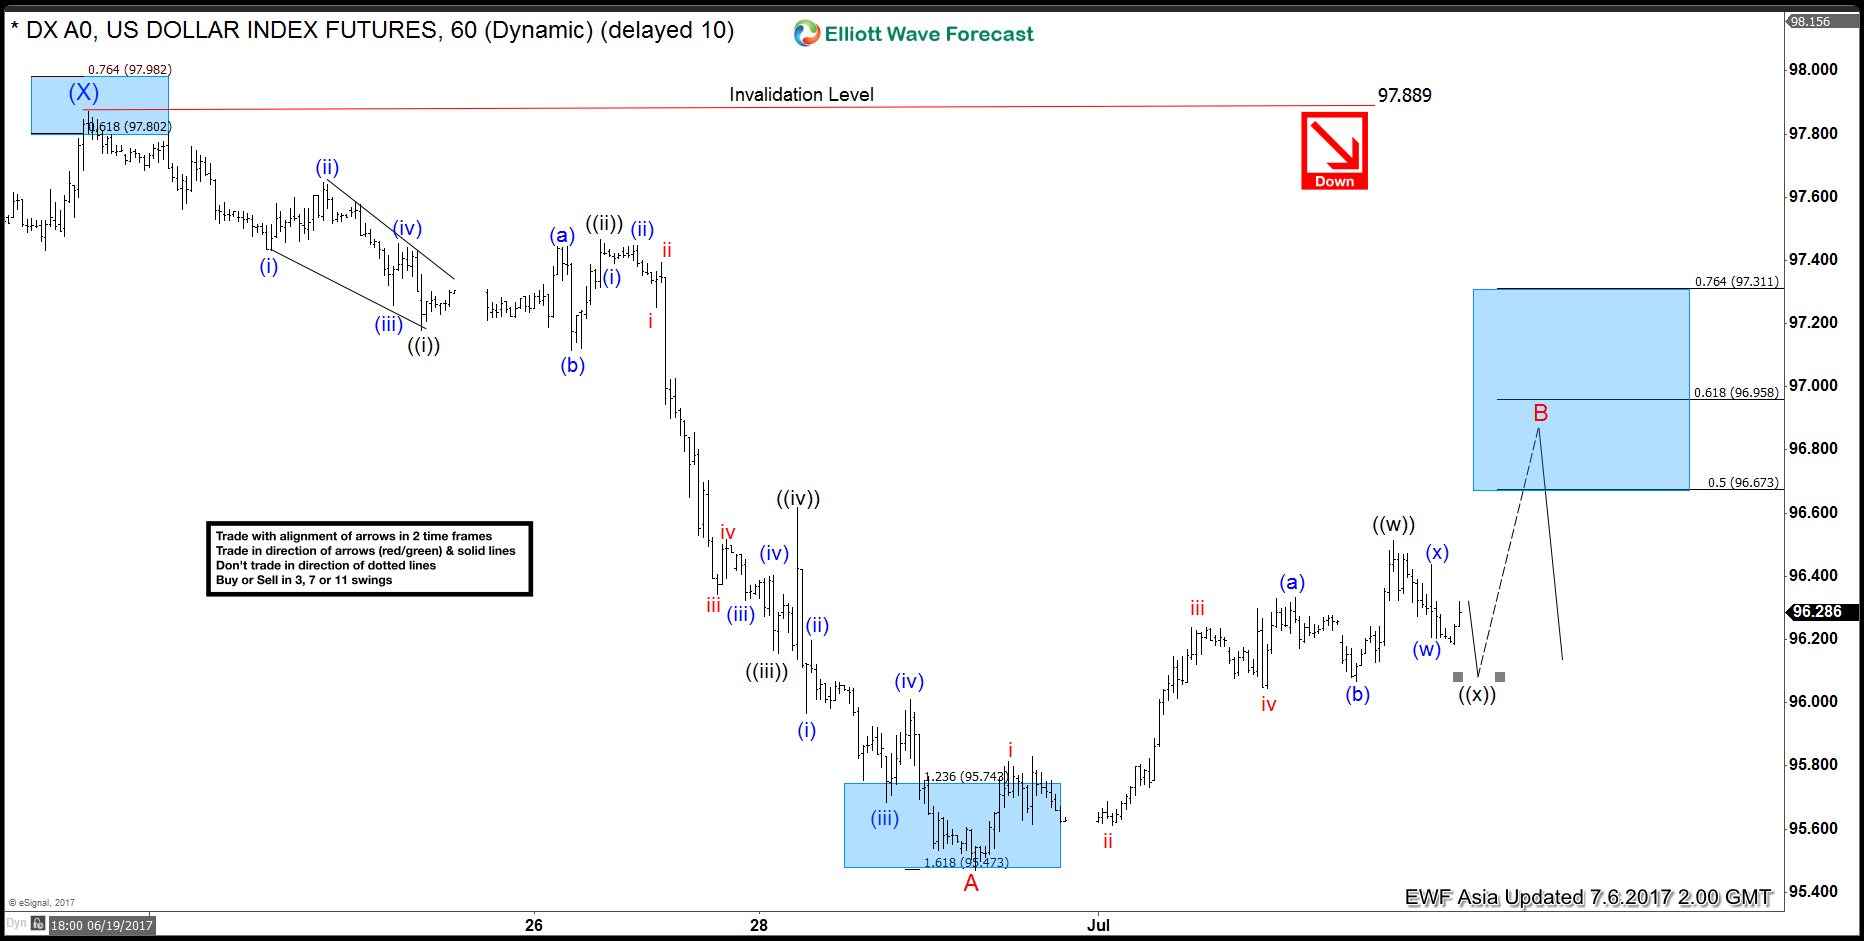
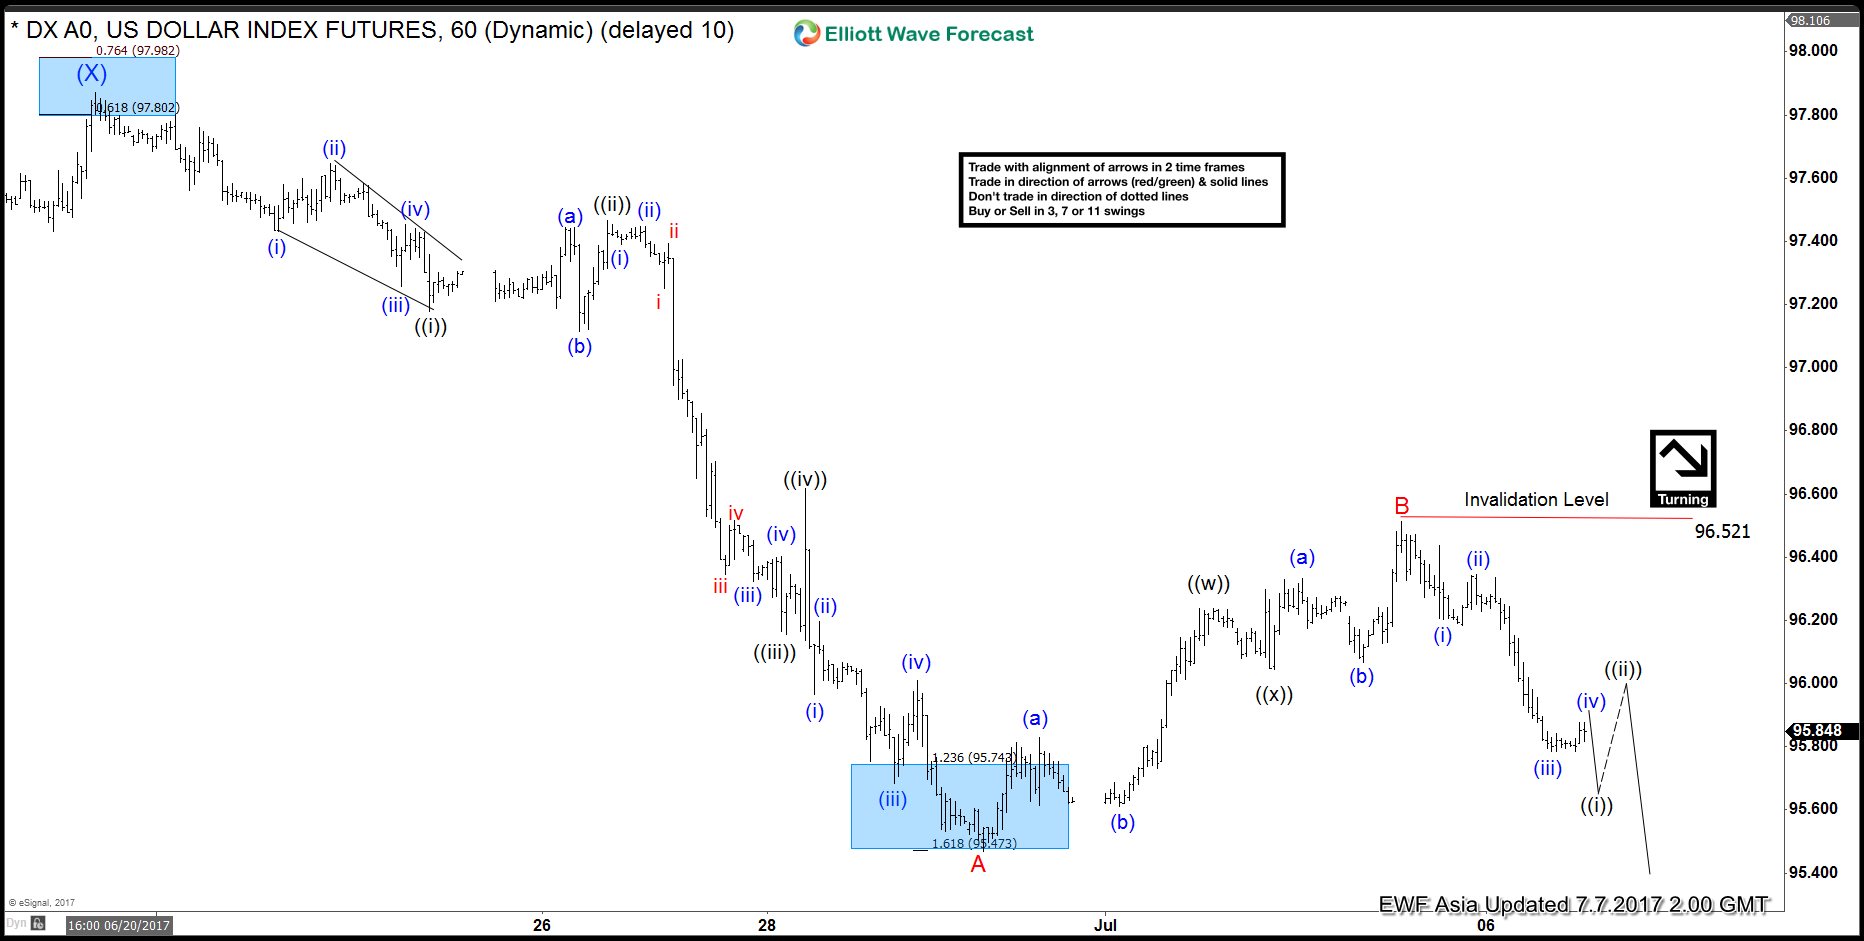
Short term USDX (USD Index) Elliott Wave view suggests the rally to 97.88 high on 6/20 ended Intermediate wave (X). Decline from there is unfolding as an impulse Elliott Wave structure with extension and ended at 95.47 low on 6/29. This 5 wave move could be Minor wave A of an Elliott wave zigzag structure structure, where Minute wave ((i)) ended at 97.17 and Minute wave ((ii)) ended at 97.47. Minute wave ((iii)) ended at 96.15, Minute wave ((iv)) at 96.61 and Minute wave ((v)) of A ended at 95.47.
Minor wave B bounce is currently in progress to correct cycle from 6/20 peak. Revised view suggests the subdivision of Minor wave B is unfolding as an Elliott wave double three structure. Minute wave ((w)) ended at 96.51 and near term, Minute wave ((x)) pullback is in progress to correct cycle from 6/29 low in 3, 7, or 11 swing before turning higher again. While the pullback stays above pivot at 6/29 low (95.47), USDX has scope to extend higher one more leg towards 96.67 – 97.31 area to end Minute wave ((y)) of B. Afterwards, while bounces stay below pivot at 6/20 high (97.88), expect USDX to resume lower again. We don’t like buying the proposed bounce.
Bank of Canada will have a meeting on July 12 to decide the interest rate. USDCAD has declined due to recent comments made by top Bank of Canada officials which seem to suggest that interest rates could be raised soon. The market in fact is pricing in an 82 percent chance of a rate hike next week. In a CNBC interview last week, Bank of Canada Governor Stephen Poloz said that the two interest rate cuts by Bank of Canada in 2015 have done their jobs in shielding Canadian economy from the steep fall in the price of oil. He also added that the central bank needs to consider its options as excess capacity in the economy is used up.
Mr. Poloz reiterated his hawkish stance in a recent interview with German newspaper Handelsblatt. He said that monetary policymakers must “anticipate where the economy will be 18 or 24 months from now”. He also said inflation in Canada should be well into an uptrend by the first half of 2018. Thus normalization must begin before the price growth hits its target.
The Canadian dollar strengthened against the U.S dollar on Tuesday after his comments. The loonie touched its strongest intraday level in nine months at 1.2908. The strength in loonie is not only based on rate hike expectation alone. Recent economic data also shows Canada’s economy grew for sixth consecutive month in April. Meanwhile, business sentiment suggest companies feel more optimistic. Prices of oil, one of Canada’s major exports, also started to recover. This further adds support for the Canadian dollar.
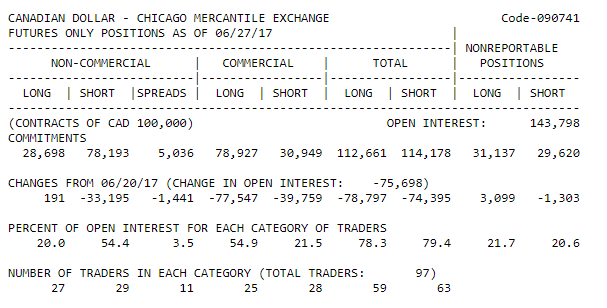
Data from CFTC (U.S Commodity Futures Trading Commission) shows a record pace of short covering in the Canadian dollar for a fifth straight week. The June 27 COT (Commitment of Traders) report below shows non commercial’s net short positions in Canadian dollar dropped to 49,495 contracts from 82,881 a week earlier. With the net short position remains elevated at 50K, CAD remains vulnerable to short squeeze and position adjustment.
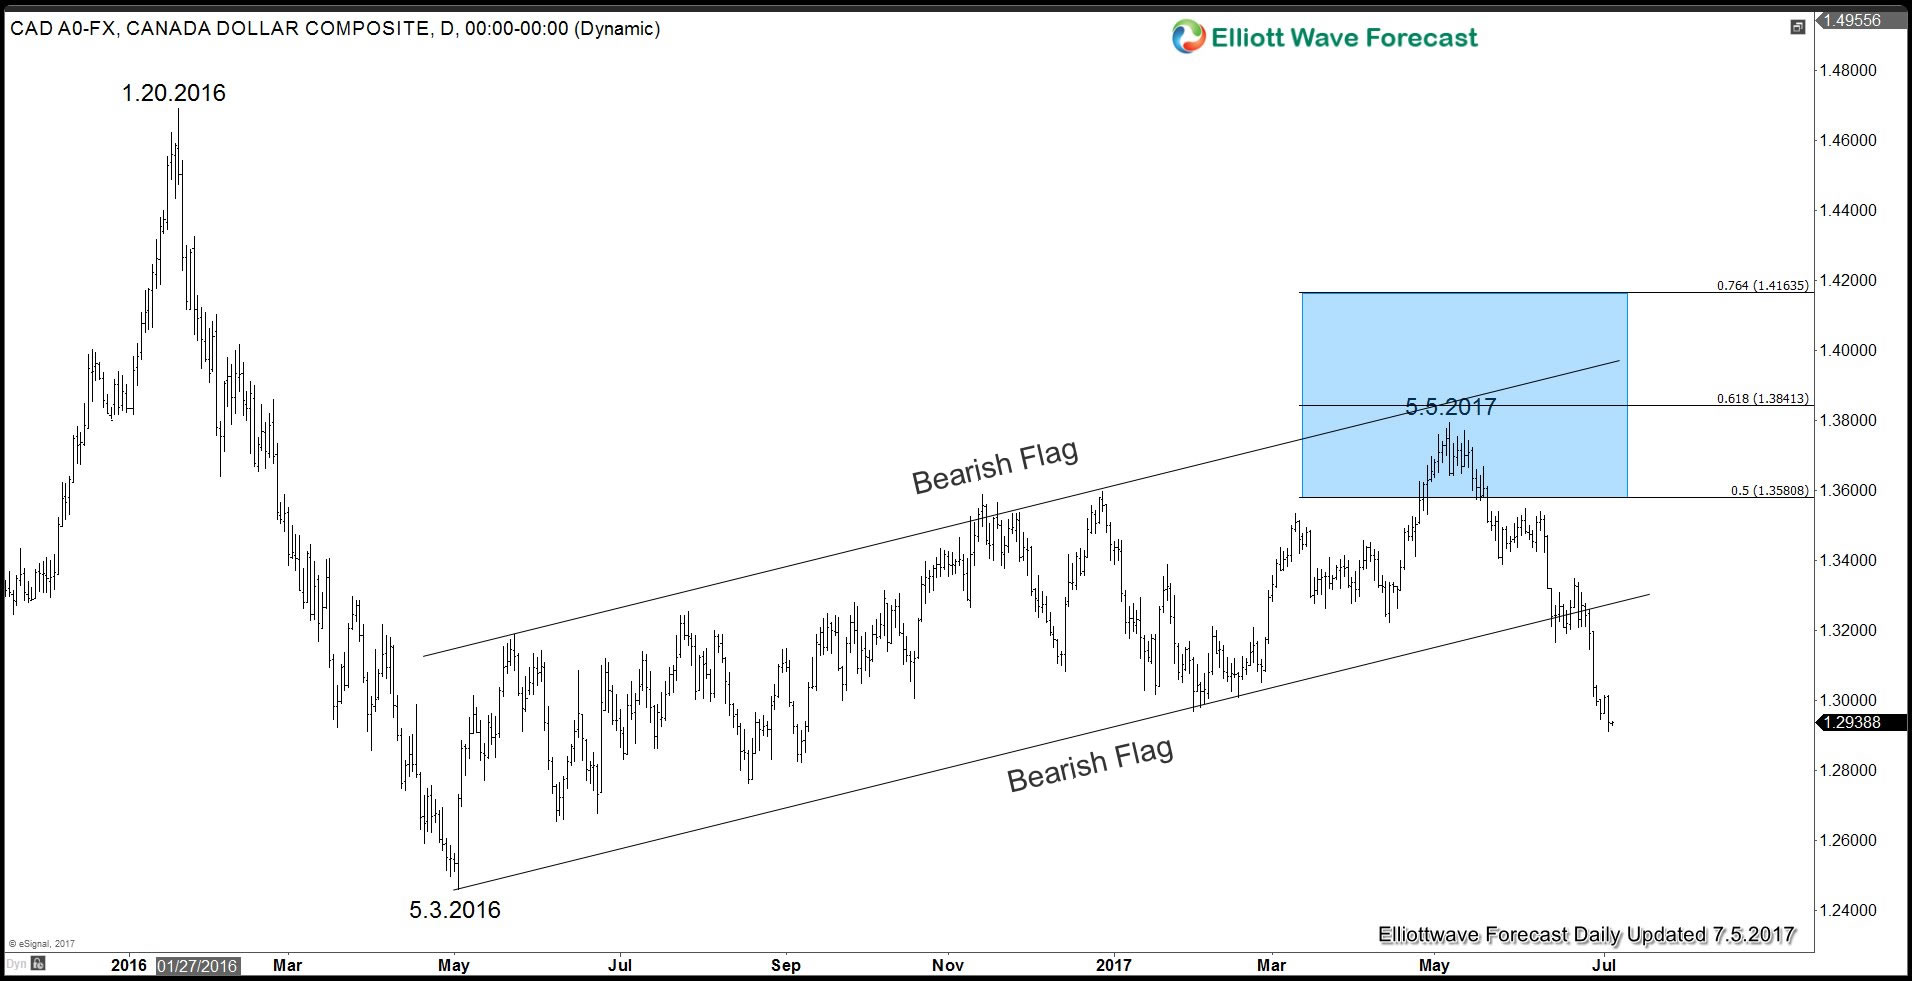
USDCAD Long Term Analysis
Daily USDCAD chart above shows pair declined sharply after reaching the peak on January 20, 2016. Pair declined from 1.4693 to 1.2461 (approximately 2200 pips) within a span of less than 4 months. The decline finally bottomed on May 3, 2016. The pair then took 1 year time from May 3, 2016 to May 5, 2017 to correct the decline in overlapping fashion, characteristic of a correction. This correction looks to be forming a bearish flag and recently pair has broken below the channel which may suggest that the correction is complete on May 5, 2017. A break below May 3, 2016 low (1.2461) will give the final confirmation that pair has started the next leg lower.
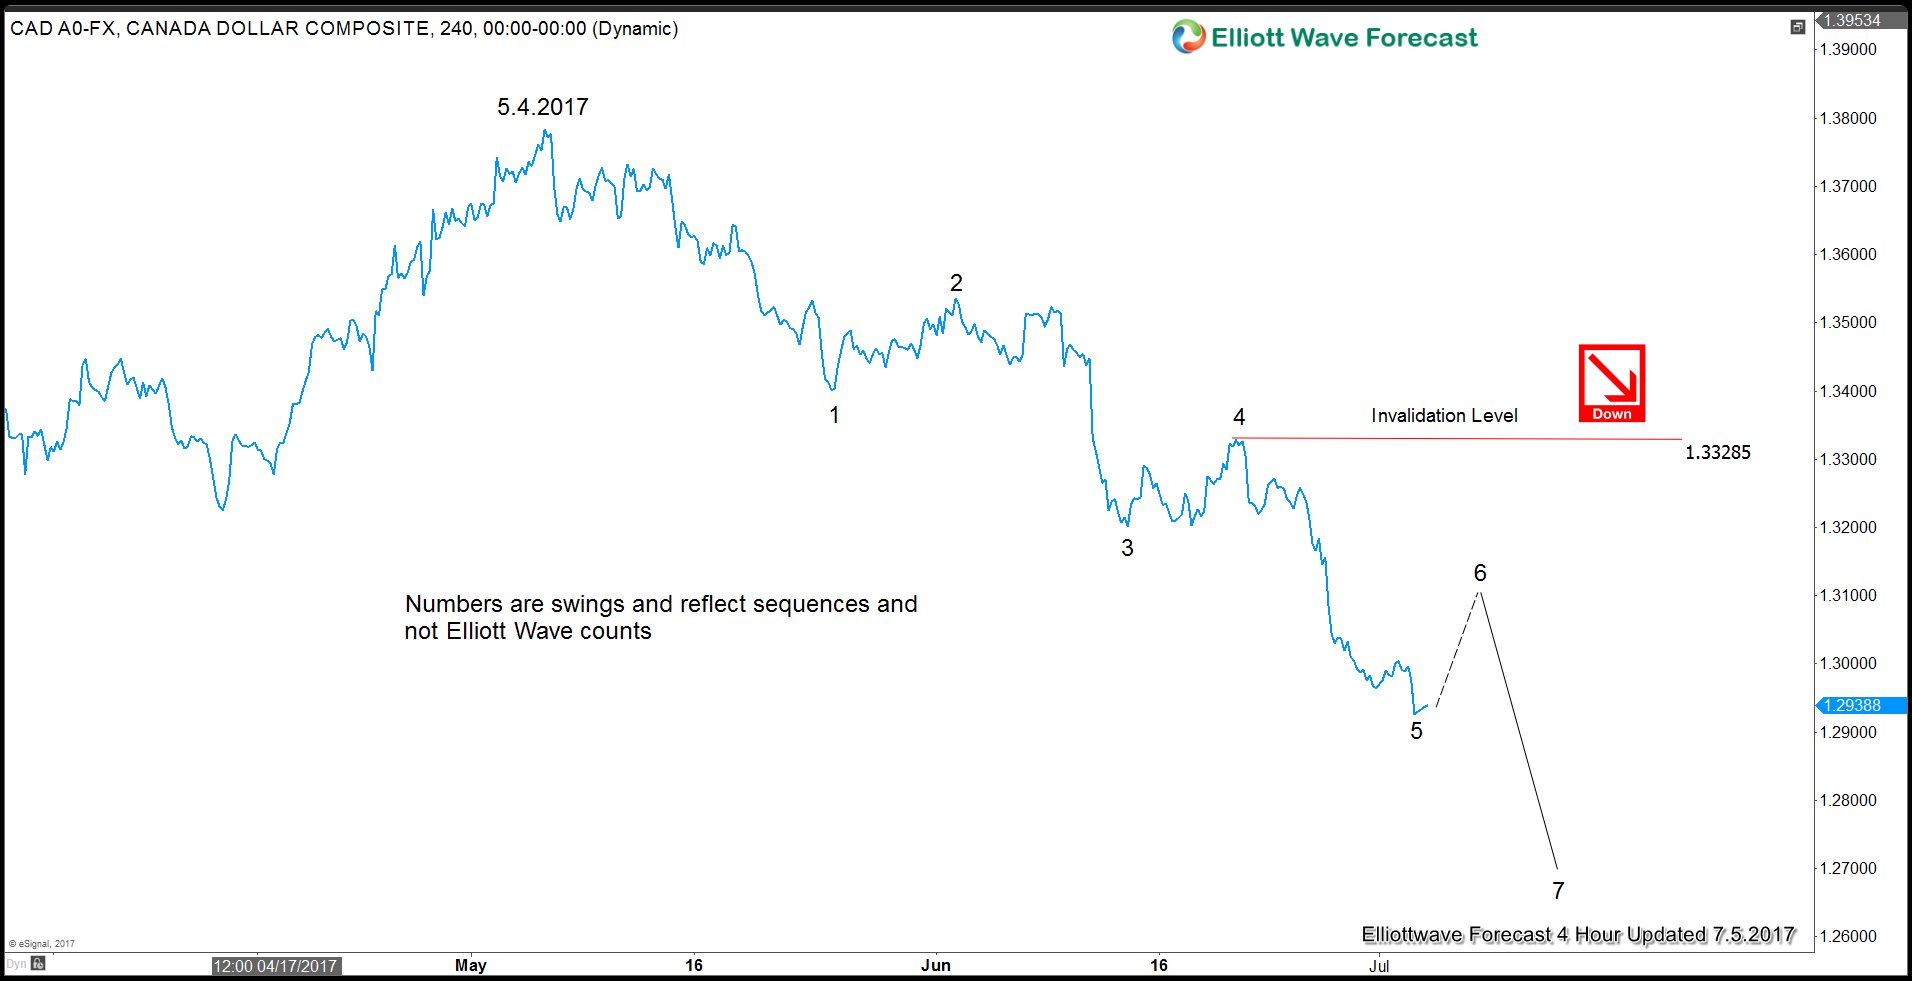
USDCAD 4 hour Elliott Wave Sequence Chart
USDCAD 4 Hour chart above shows a 5 swing bearish sequence from May 4, 2017 high. Please note that this is not the same as 5 waves impulse, but rather the number of swing count. The 5 swing sequence suggests that while the sixth swing bounce fails below swing #4 high at 1.3328, more downside can be seen in the pair.
As the market is dynamic, traders need to keep up with the most up-to-date analysis of their favorite instrument. Successful traders need to have a good trading system and also strict risk management with rules that define entry, stop loss, and take profit levels with high accuracy to allow traders to get into a risk free position in your trade as quickly as possible.
Short term USDX (USD Index) Elliott Wave view suggests the rally to 97.88 high on 6/20 ended Intermediate wave (X). Decline from there is unfolding as an impulse Elliott Wave structure with extension and ended at 95.47 low on 6/29. This 5 wave move could be Minor wave A of an Elliott wave zigzag structure structure, where Minute wave ((i)) ended at 97.17 and Minute wave ((ii)) ended at 97.47. Minute wave ((iii)) ended at 96.15, Minute wave ((iv)) at 96.61 and Minute wave ((v)) of A ended at 95.47.
Revised view calls for Minor wave B bounce completed at 96.52. For this view, a break below Minor wave A at 95.47 will add more validity. Until then, a double correction in Minor wave B can’t be completely ruled out. The subdivision of Minor wave B is unfolding as an Elliott wave double three structure. Minute wave ((w)) ended at 96.24, Minute wave ((x)) ended at 96.04 and Minute wave ((y)) of B ended at 96.52. Near term, while bounces stay below Minor wave B at 96.52, expect the Index to resume lower. We don’t like buying the Index.
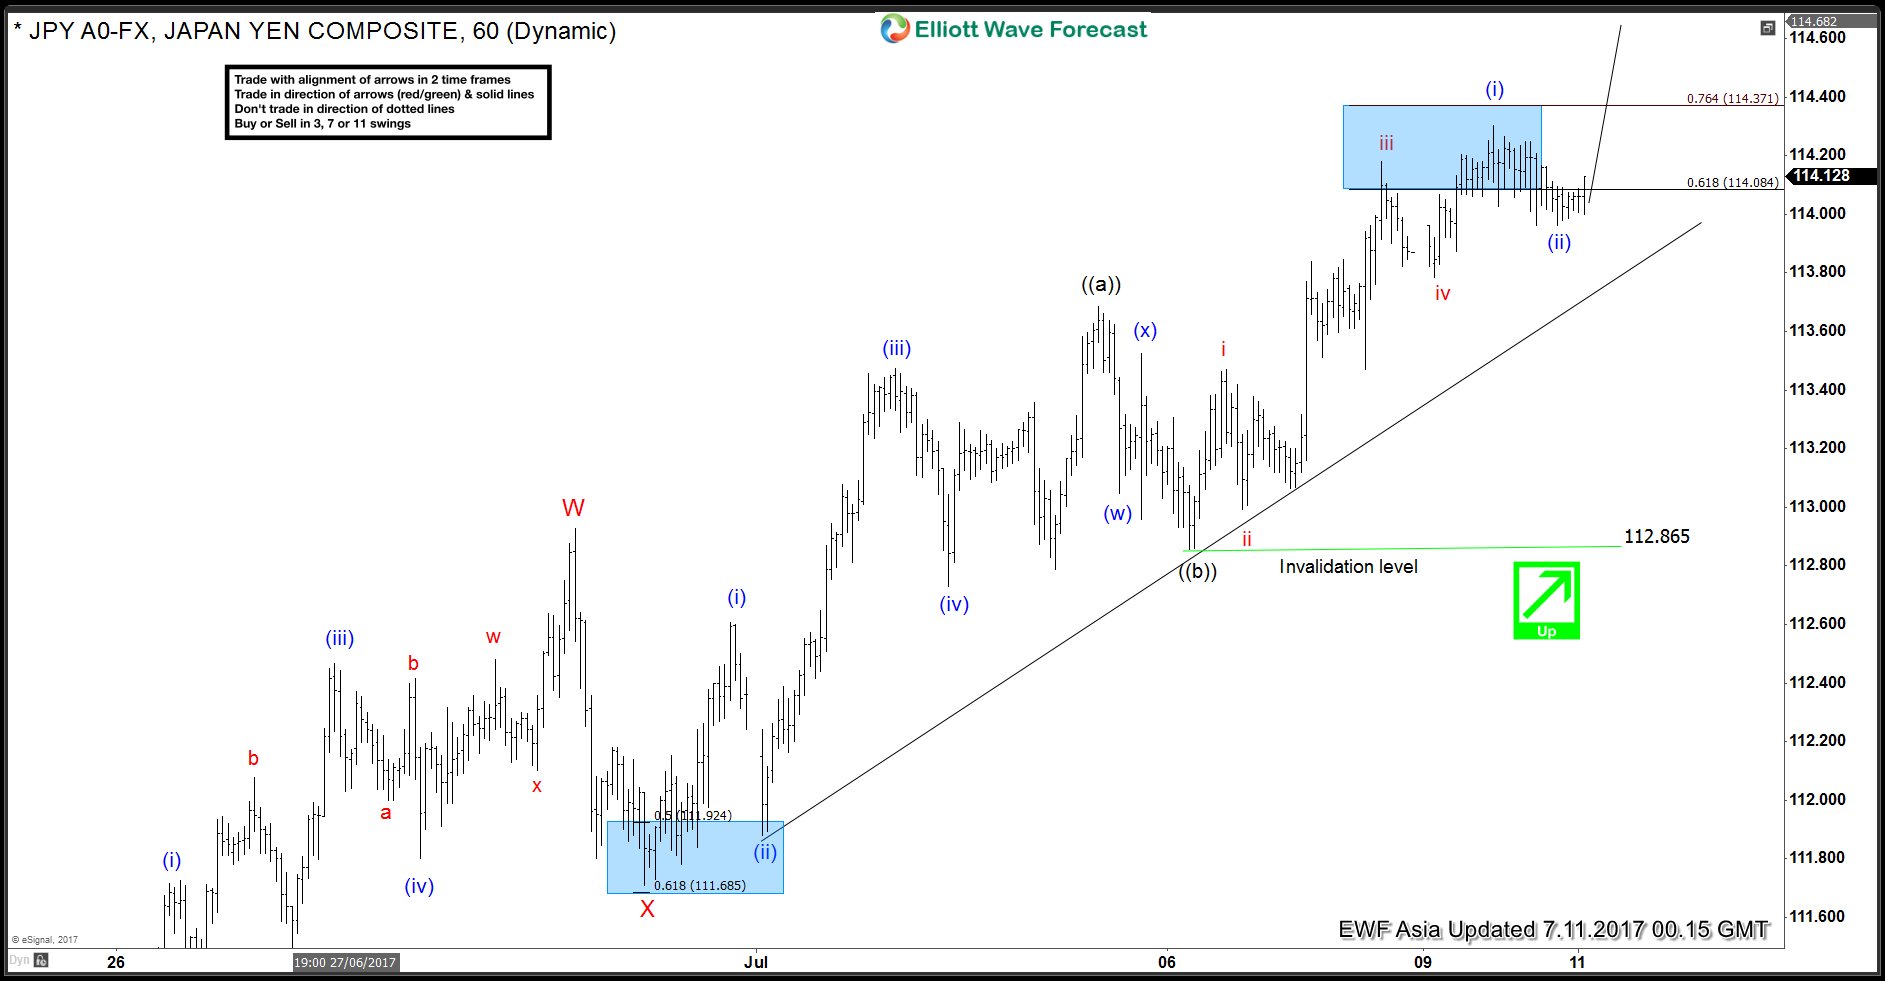
Short term USDJPY Elliott Wave view suggests the pullback to 111.7 low on 6/29 ended Minor wave X. Up from there, wave Y is unfolding as an Elliott wave zigzag structure where Minute wave ((a)) ended at 113.68 and Minute wave ((b)) ended at 112.86. Up from there, Minutte wave (i) of ((c)) ended at 114.3. Minutte wave (ii) of ((c)) ended at 113.96, but a break above 114.3 will add validity to the view that the next leg higher has started. Until then, a double correction in Minutte wave (ii) still can’t be ruled out before pair resumes the rally higher. Near term, while dips stay above 112.86, and more importantly as far as pivot at 111.7 low stays intact, expect pair to extend higher. We don’t like selling the pair.
Nikkei (NKD #F) Forecasting the rally & buying the dips
Hello fellow traders. In this technical blog we’re going to take a quick look at the past Elliott Wave chart of Nikkei (NKD #F) . In further text we’re going to explain our view and the Elliott Wave count.
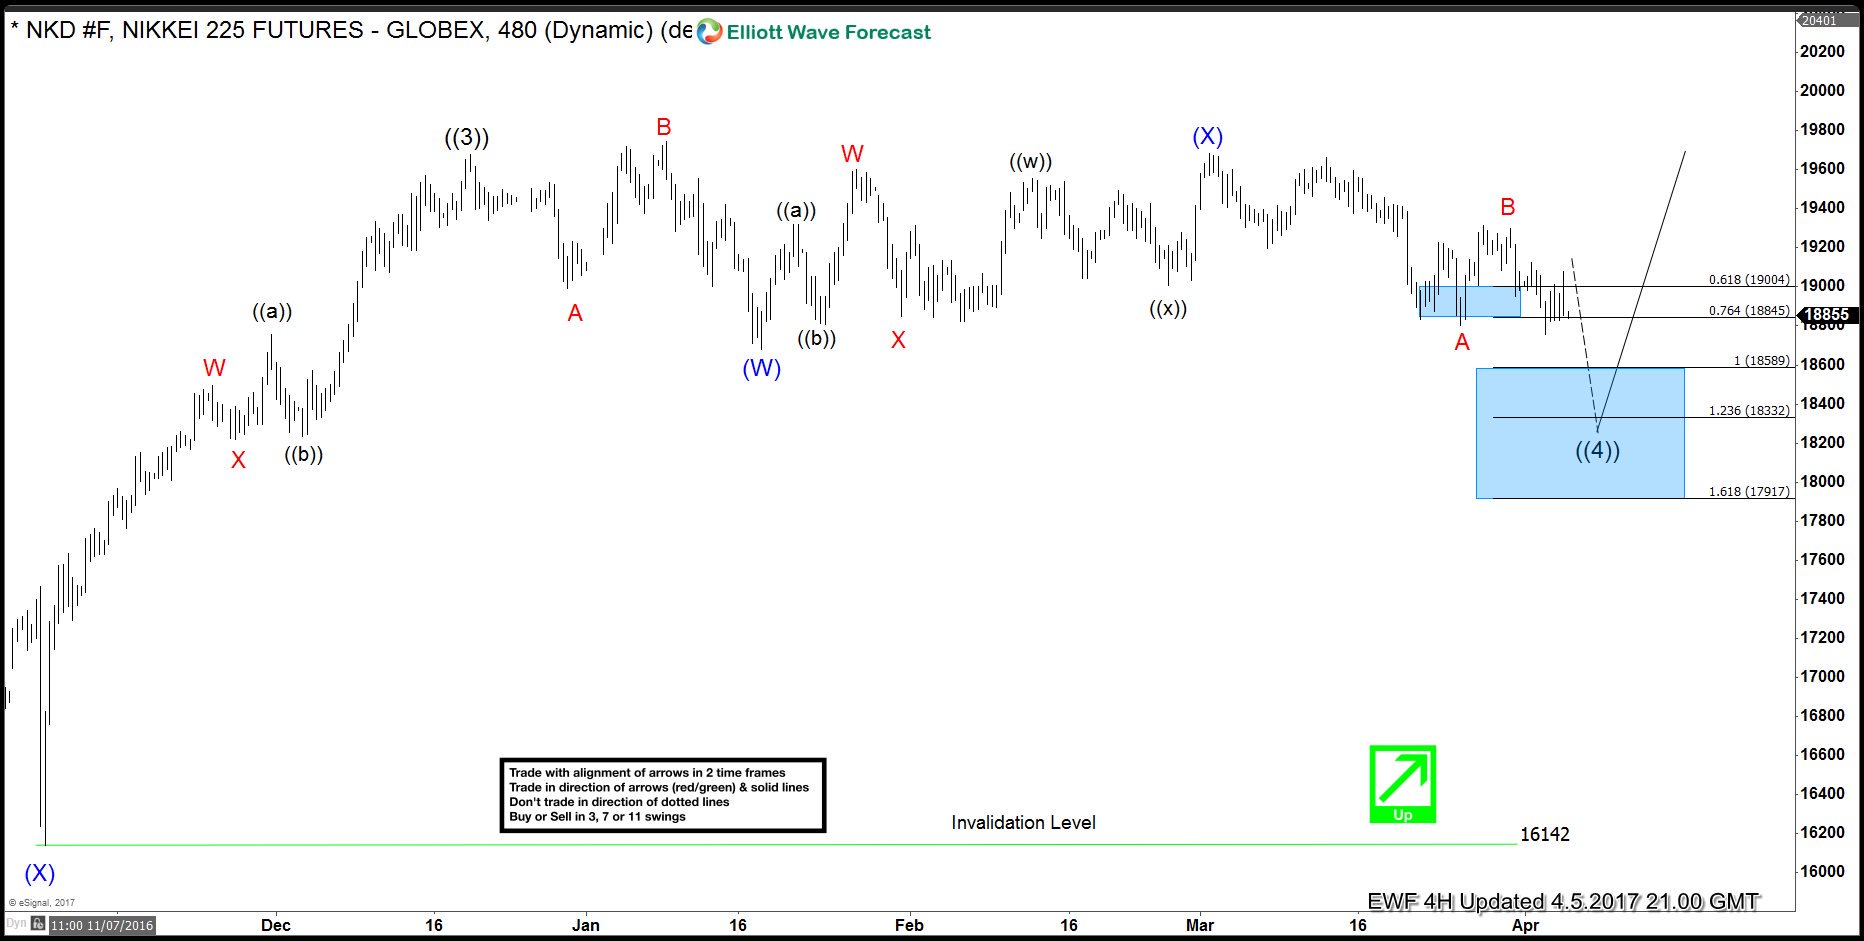
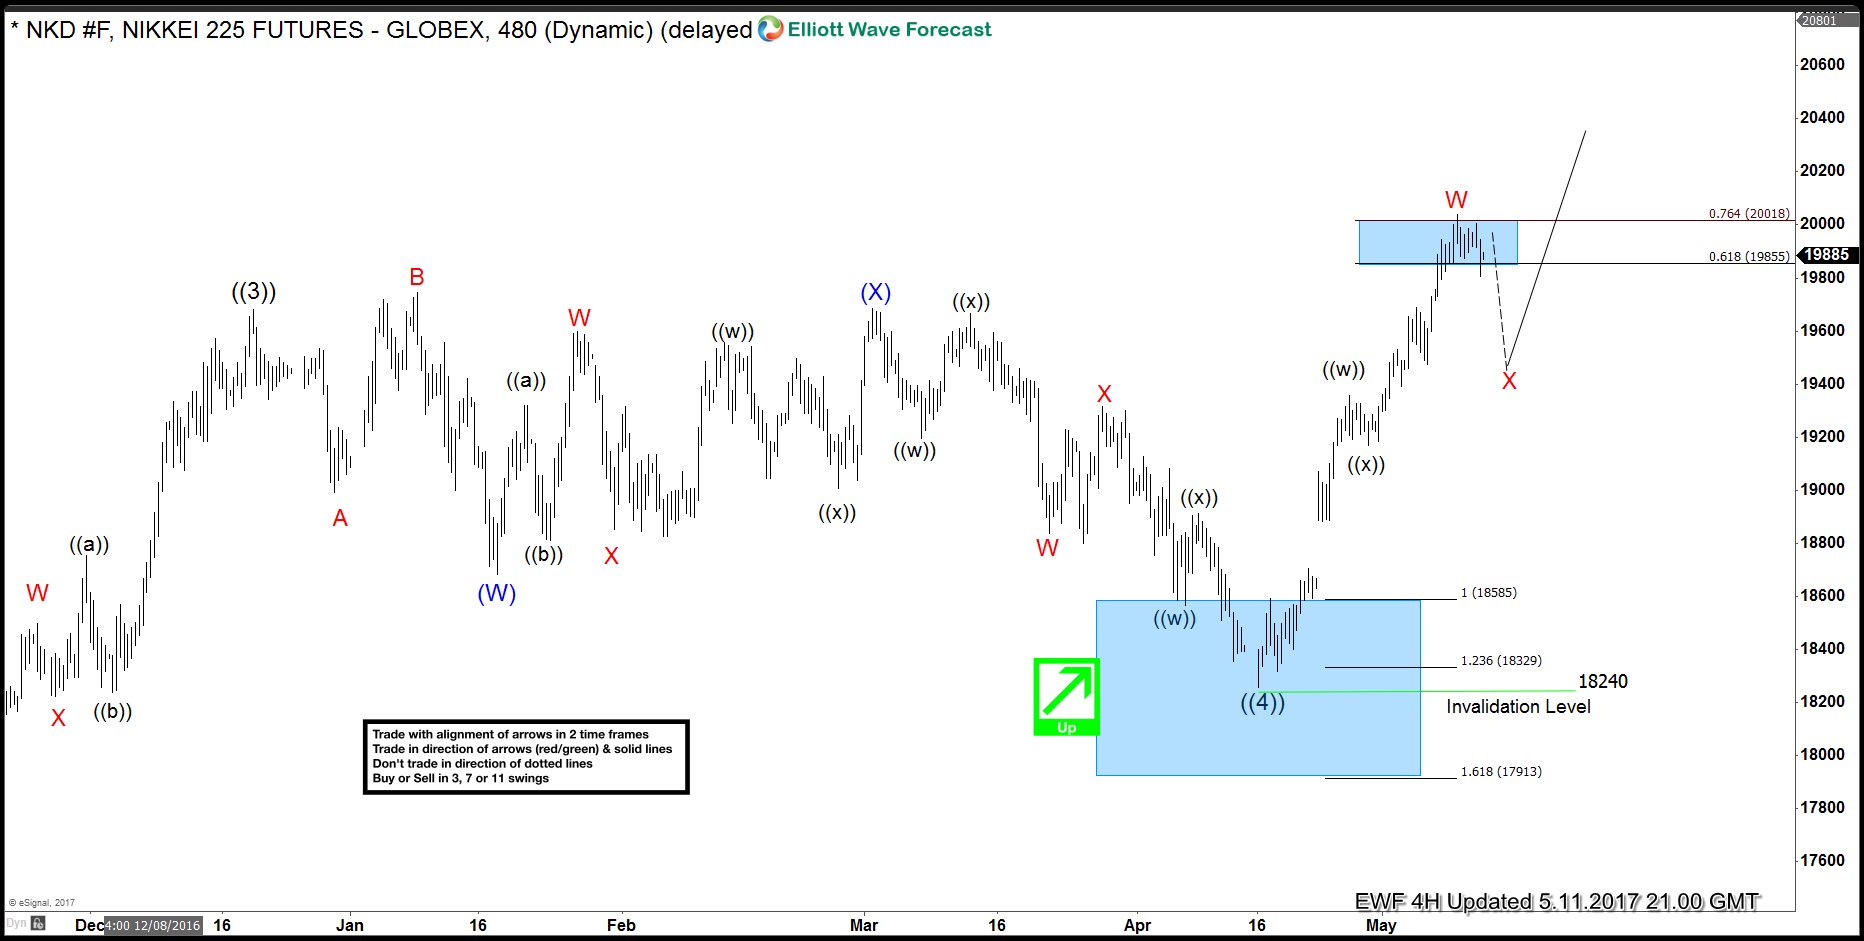
Nikkei (NKD #F) Elliott Wave 4 Hour Chart 04.05.2017
As our members know, we were pointing out that Nikkei is supported due to its bulish sequences in weekly time frame and correlation. We recommended members to wait for the price to reach the extremes at lower levels, before buying it. Structure has been pretty sideways, but calling for more short term weakness in 7th swing toward 18589- 18332 area ( potential buying zone). Index needed another leg lower in wave C red of (Y) blue ,before wave ((4)) pull back becomes ready to complete as Double Three Pattern. As Nikkei was bullish in higher time frames, we recommended our members to avoid selling , and keep buying the dips. Our buying zone was at 18589- 18332 area, when invalidation level was below 17917.
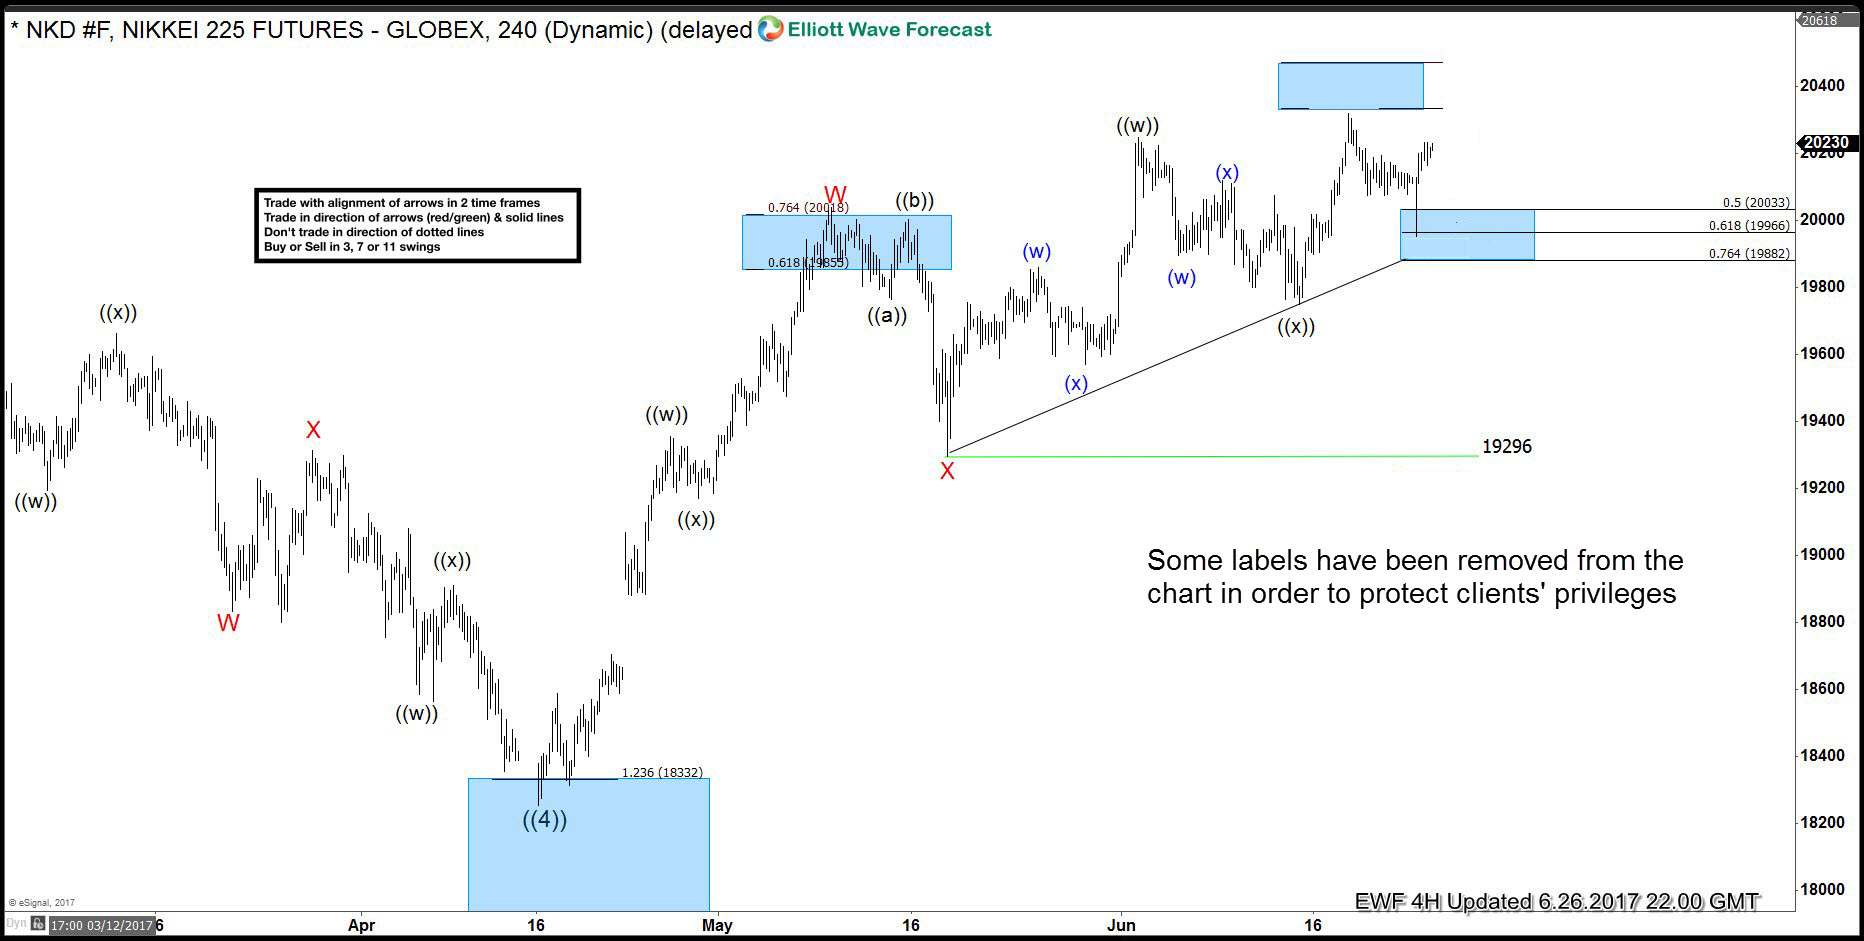
Eventually Nikkei has reached proposed buying zone, found buyers and turned higher as expected. Wave ((4 )) pull back is counted completed at 18240 low, and now index is bearish against that level. Current Elliott Wave forecasts suggests that 19855-20018 area can produce 3 wave pull back. As far as the price holds below current short term high wave X red pull back is in progress. We don’t advise selling the index, and suggests members to remain long within risk free positions.
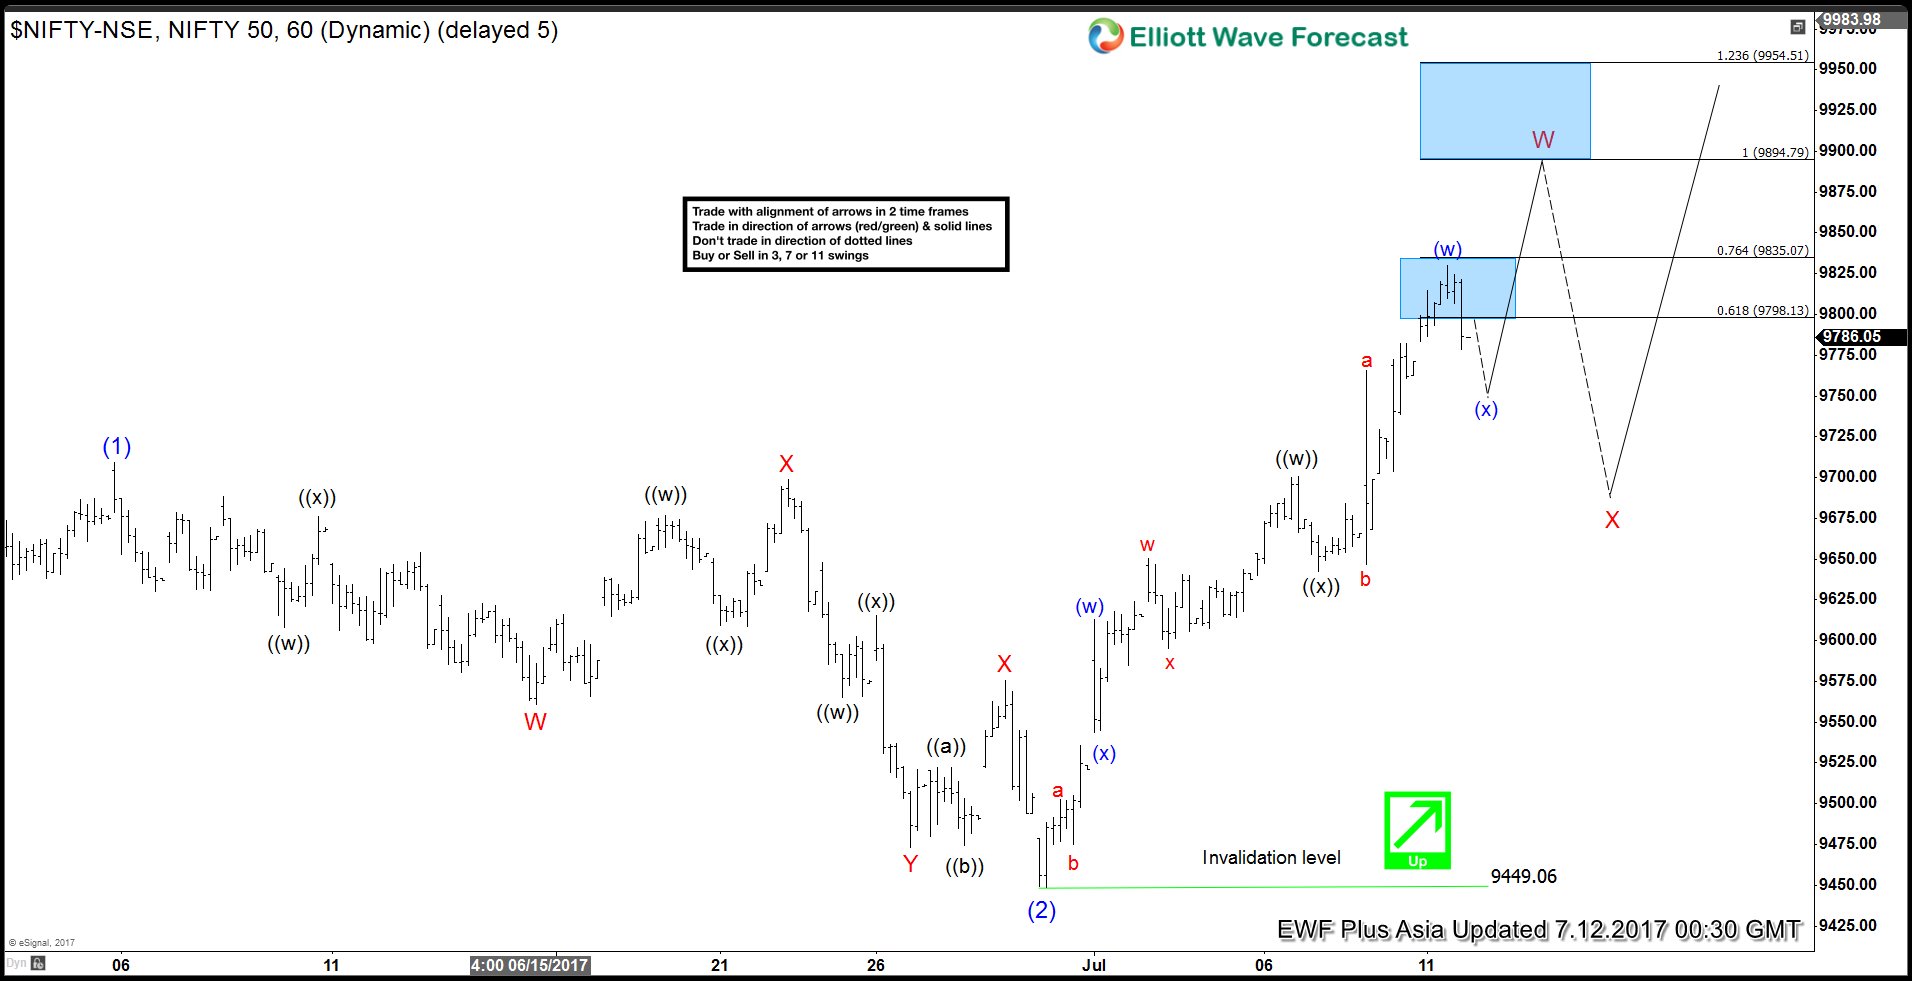
Short term NIFTY Elliott Wave view suggests the pullback to 9449.06 low on 6/30 ended Intermediate wave (2). Up from there, rally is unfolding as an Elliott wave double three structure where Minute wave ((w)) ended at 9700.7 and Minute wave ((x)) ended at 9642.65. Wave ((y)) is in progress also as a double three structure where Minutte wave (w) ended at 9830.05.
Minutte wave (x) pullback ideally stays above 9642.65, but more importantly above 9449.06 for the next leg higher. While pivot at 9449.06 is intact, expect NIFTY to extend higher to 9894.8 – 9954.5 to complete Minor wave W and end cycle from 6/30 low. Afterwards, Index should pullback in Minor wave X in 3, 7, or 11 swing to correct cycle from 6/30 low before the rally resumes. We don’t like selling the Index.
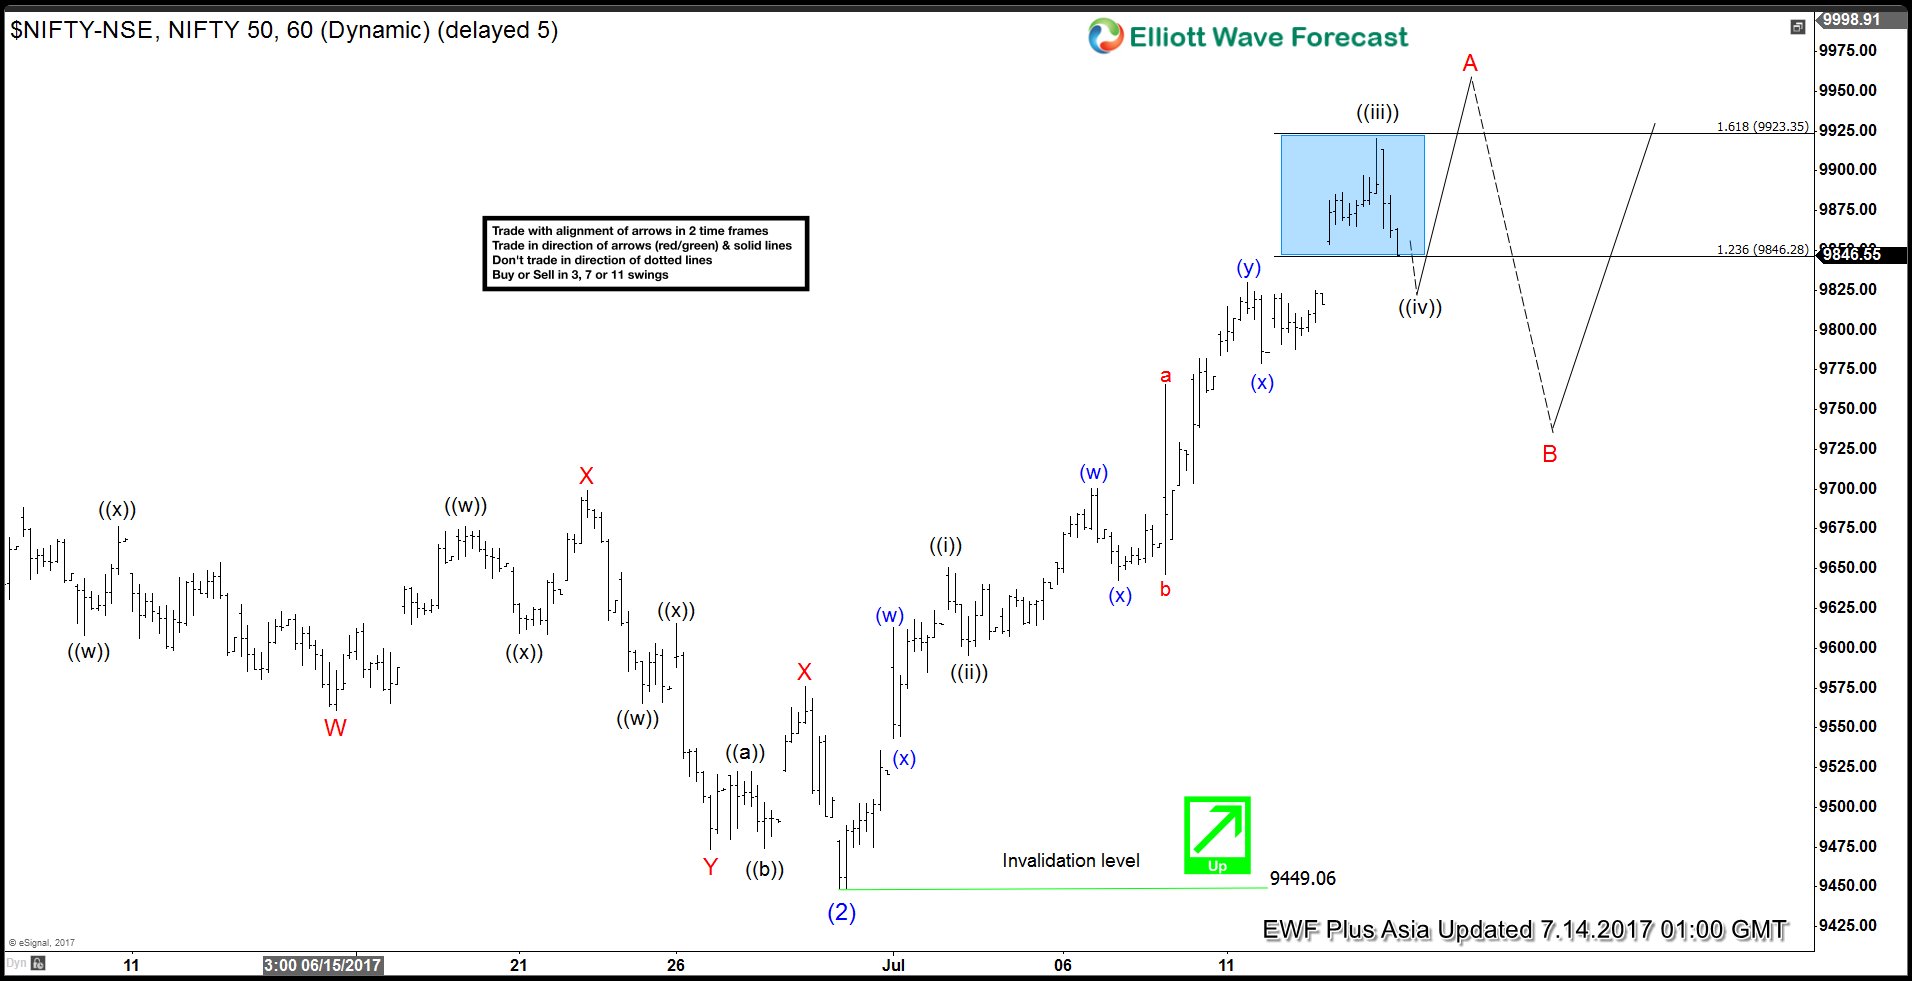
Short term NIFTY Elliott Wave view suggests the rally to 9709.3 ended Intermediate wave (1), and the pullback to 9449.06 low ended Intermediate wave (2). Rally from there could be unfolding as an Elliott wave Zigzag structure where Minor wave A is in progress as a Leading diagonal structure. Minute wave ((i)) ended as a double three Elliottwave structure at 9649.80 and Minute wave ((ii)) ended at 9596.30. Up from there Minute wave ((iii)) is unfolding as Elliott wave Triple three structure where Minutte wave (w) ended at 9700.7, Minutte wave (x) ended at 9642.65, Minutte wave (y) ended at 9830.05, second Minutte wave (x) ended at 9778.85 low, and Minutte (z) of ((iii)) is proposed complete at 9892.6.
Expect Index to pullback in Minute wave ((iv)) in 3, 7, or 11 swing to correct the cycle from 9595.50 low before the rally resumes higher again for 1 more leg in Minute wave ((v)) of A. Afterwards index should pullback in Minor wave B to correct the cycle from 9449.06 low in 3, 7 or 11 swing before another extension higher. We don’t like selling the Index and expect buyers to appear after Minute wave B pullback is complete provided the pivot at 9449.06 low remains intact.
Since June peak at $3000, Bitcoin lost 35% of it’s value driving the rest of the cryptocurrency market into chaos as 1st August is approaching which is scheduled to trigger activation of Segregated Witness (SegWit) and could lead to a split in Bitcoin’s blockchain. There is no need to explain what’s going to happen in the coming weeks as the internet is already full of articles containing the details about it.
What’s really important is the price structure and how we can interpret it to get an idea about the possible coming path. We believe that the world market is ruled by technical analysis as fundamentals is only used to trigger the move. So as we have an important coming event for Bitcoin, then usually the market will send us a message through the charts which we can read it with different methods.
Let’s start by taking a look at previous BTCUSD chart and understand what the price has done in the past :
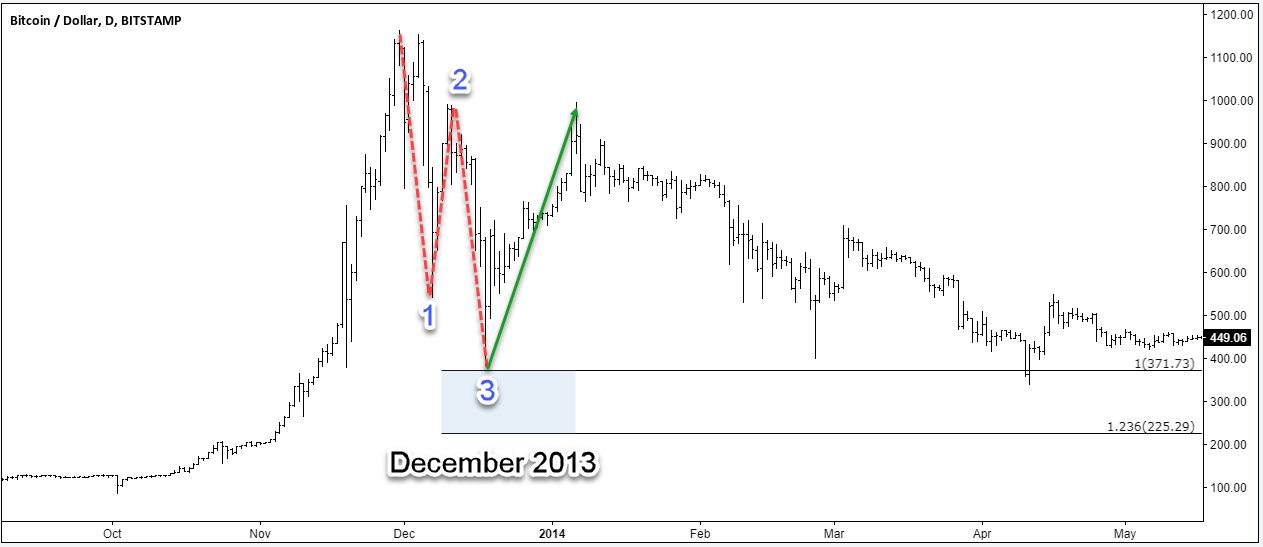
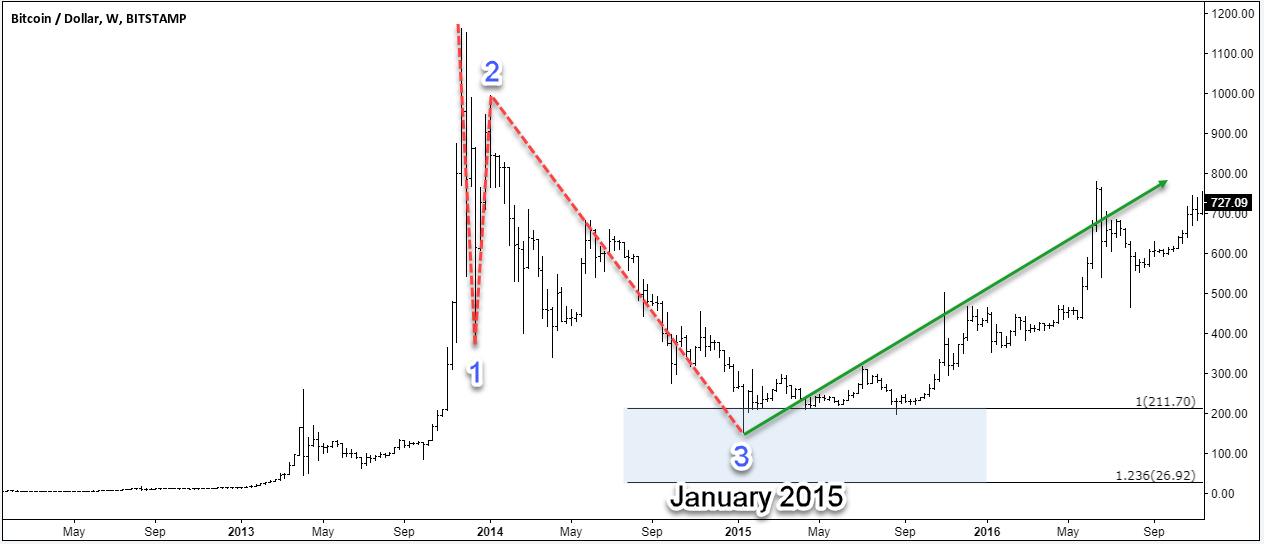
Bitcoin December 2013 Bitcoin January 2015 Bitcoin July 2016 Bitcoin seems to be doing a simple 3 waves correction then bouncing higher again, so if you actually bought last year dip or even better the 2015 dip then you should be still enjoying the show from a lower price despite the recent drop. Every instrument around the world is doing the same thing over and over again : after a strong move in a bullish / bearish trend, the price starts a boring correction full of misleading movement to consume time until the next leg starts.
Bitcoin is no different from the others and it’s been following the same path in bigger & lower time frames. So why it didn’t rally to new highs after the first 3 waves pullback in June ?
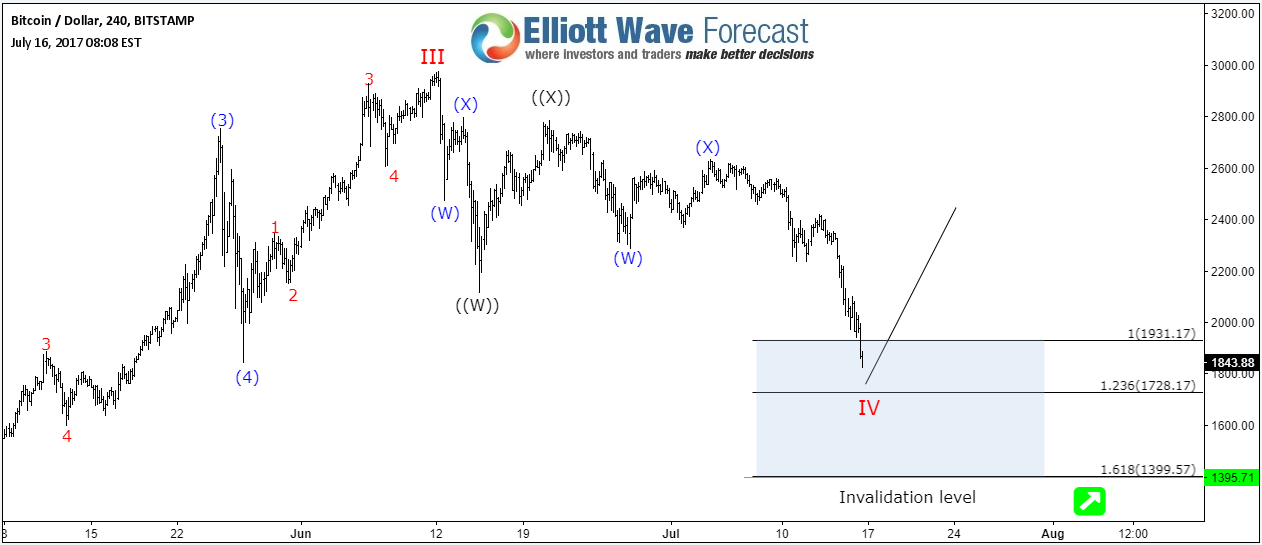
We mentioned in our previous article how bitcoin can rally to new highs after ending a 3 swings pullback but if the pivot at June lows fails then it will end up extending the correction in 7 swings to the downside. The tricky part is to identify what type of correction is taking place because no one can predict how big the correction will be and how much time will it take.
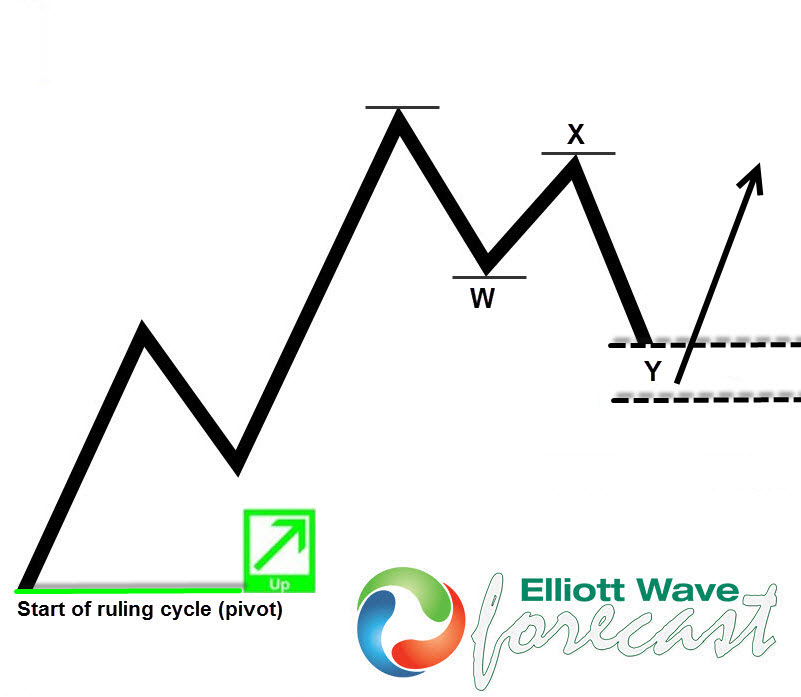
Bitcoin WXY 8H Chart 07/16/2017 WXY is one of the most common patterns in the new adaption of Elliott Wave Theory. This structure is commonly called double three Elliott Wave pattern. Market shows this structure very frequently nowadays in many instruments in almost all time frames. It is a very reliable structure by which we can make a good analysis. What is more important is that it can give us good trading inputs with clearly defined levels of invalidation and destination areas.
Consequently, BTCUSD has already reached the 100% – 161.8% Fibonacci extension area ($1900 – $1400) where we expect buyers to show up looking for a new move to the upside or at least a 3 waves bounce. But as long as the price fails to make new highs then it could be part of a larger corrective structure and it’s only ending the first leg of it.
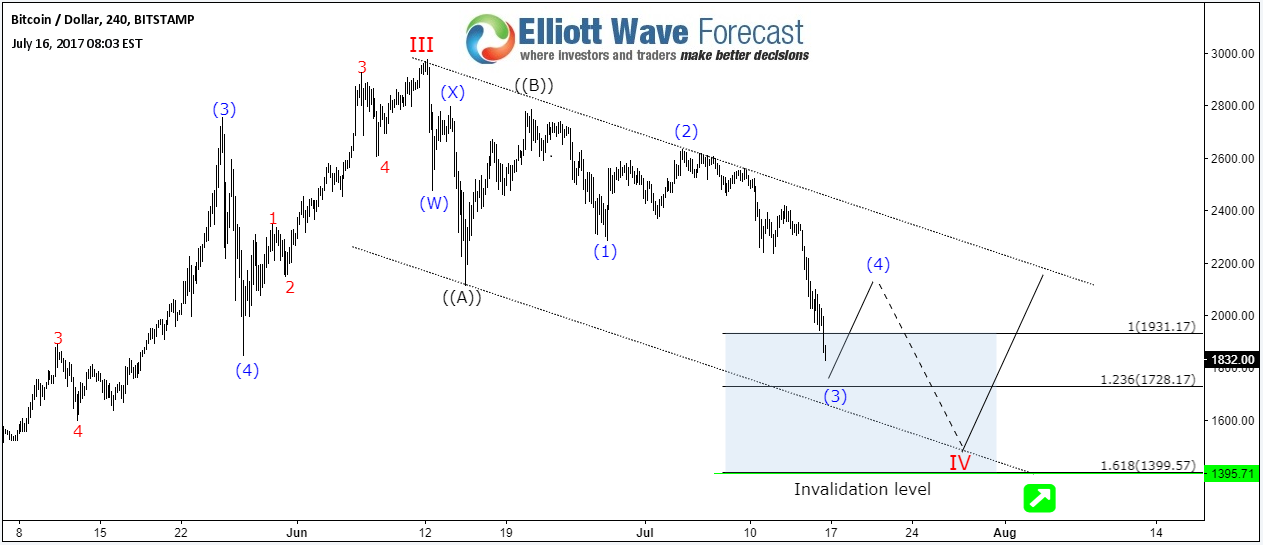
Bitcoin ABC 8H Chart 07/16/2017
The structure can be counted in a different way if Bitcoin is doing an ABC Flat structure, which is another common type of correction that can be sometimes hard to trade because it tends to extends beyond the 1.618 fib ext level. There is many other scenarios that can play out but i’m only presenting the two most aggressive ones to explain the current “deja vue” situation for BTCUSD.
Recap
Market condition has changed over the time, instruments can be trending higher or lower in series of 3 wave sequences rather than impulsive sequence and this can be frequently seen in the forex market. Bitcoin is no exception as it’s just another financial instrument leading the correction of the cryptocurrency market and still has the potential to rally to new all time highs. It won’t matter if it will do it from current levels or a lower area, what really matter is how you are willing to manage your position during such movement to protect your investment.
No one is perfect and we don’t claim to have 100% accuracy, but a system with high accuracy acts as a great trading tool because forecasting is a process of continuous adjustments. A waver (trader) needs to accept when an idea doesn’t work out and adjust to new data.
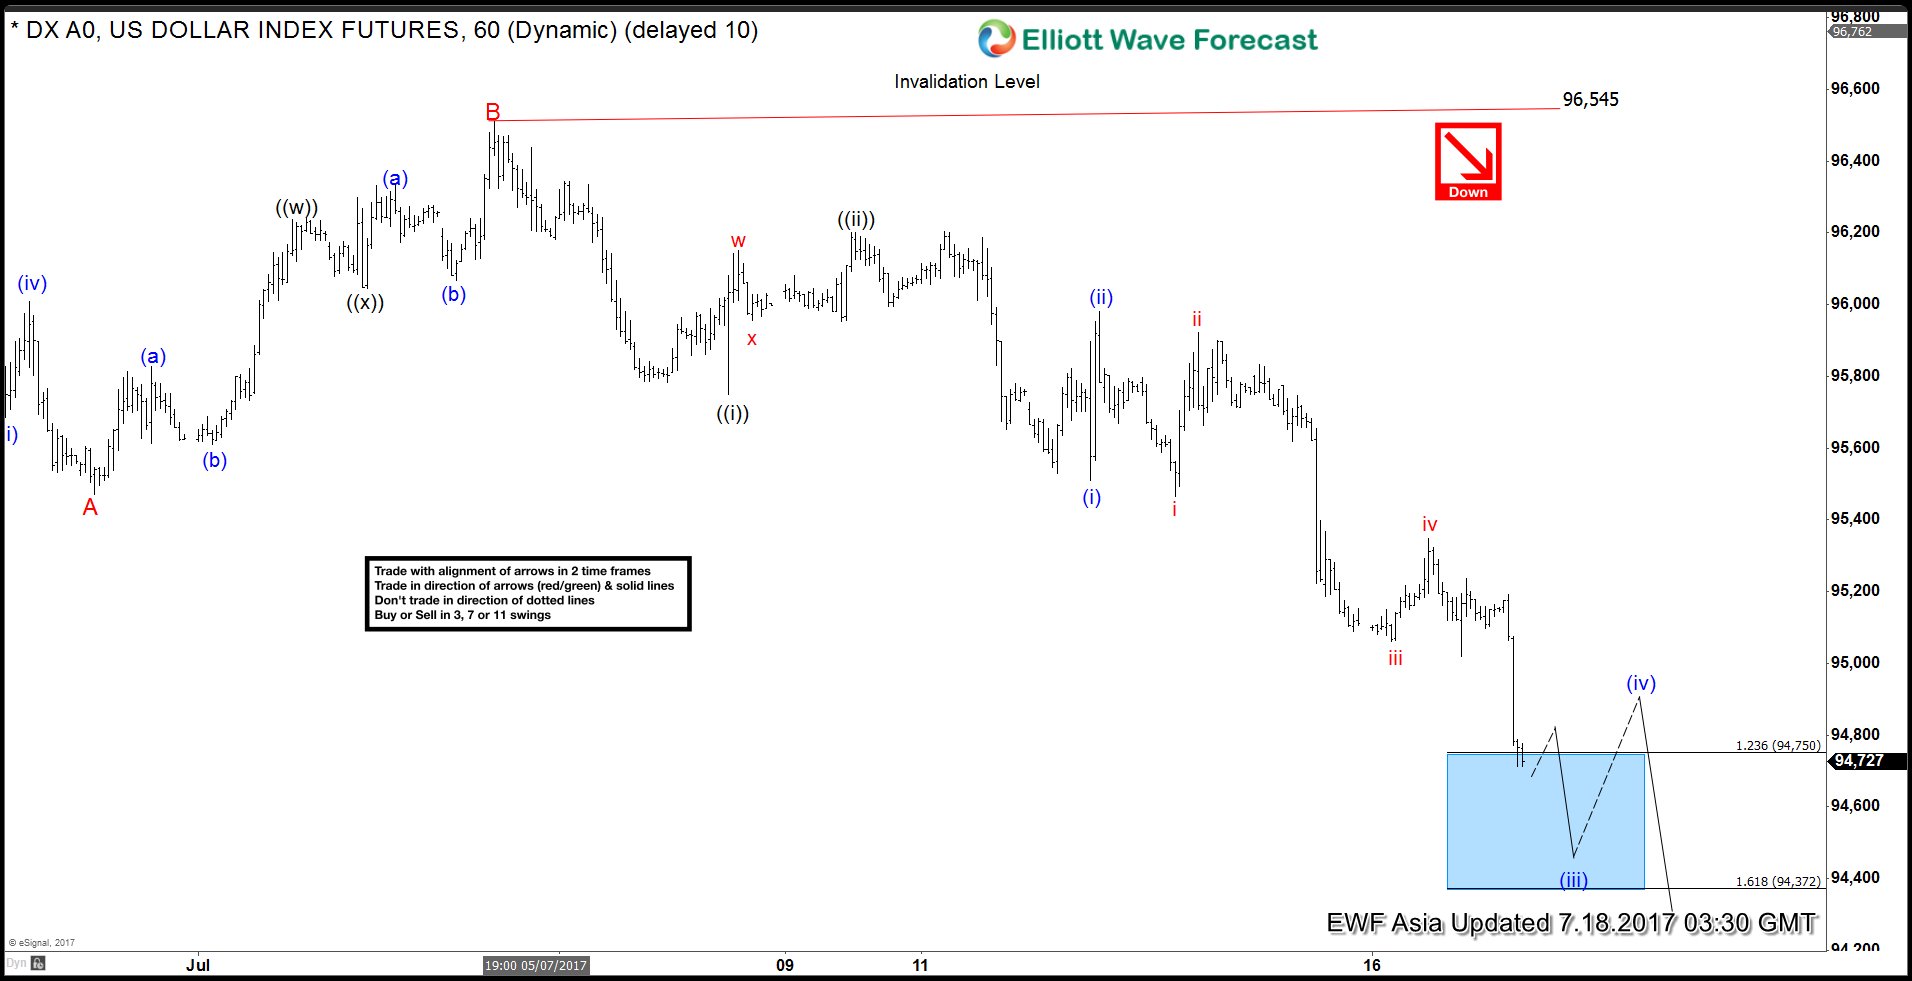
Short term DXY (USD Index) Elliott Wave view suggests the decline from 6/20 peak (97.87) is unfolding as a Zigzag Elliott Wave structure. Down from 97.87 high, decline to 95.47 ended Minor wave A, and bounce to 96.51 high ended Minor wave B. Wave C is unfolding as an Elliott wave Impulse structure with extension where Minute wave ((i)) ended at 95.75 and Minute wave ((ii)) ended at 96.2. Minute wave ((iii)) is subdivided into another impulsive wave of a smaller degree. Minutte wave (i) ended at 95.51, Minutte wave (ii) ended at 95.98 and Minutte wave (iii) is currently in progress. Expect Minutte wave (iii) to end at 94.3 – 94.7 area, then the Index should bounce in Minutte wave (iv) before turning lower again. We don’t like buying the Index and expect bounces to find offer in 3, 7, or 11 swing for more downside.
DXY 1 Hour Elliott Wave Chart A-B-C Structure
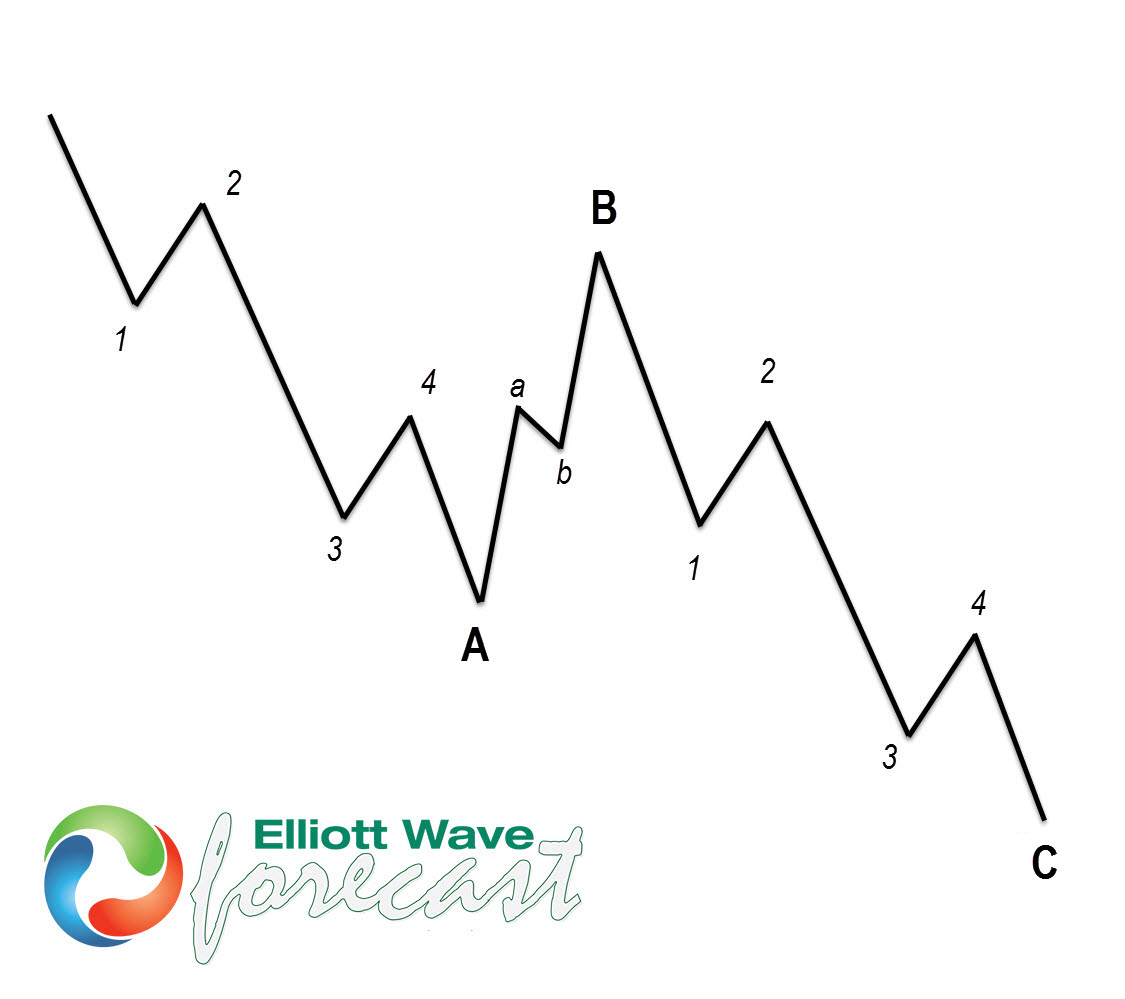
According to Elliott wave theory, Zigzag is a 3 wave structure having internal subdivision of (5-3-5) swing sequence. The internal oscillations are labeled as A, B, C where A = 5 waves, B = 3 waves and C = 5 waves. This means that A and C can be impulsive or diagonal waves (Leading Diagonal in the case of wave A or Ending Diagonal in the case of wave C). The A and C waves must meet all the conditions of 5 waves structure, such as: having an RSI divergence at the fifth wave, ideal Fibonacci extensions, ideal retracements etc.
As the graphic below shows, we can see what Elliott Wave Zig Zag structure looks like. 5 waves down in A, 3 wave bounce in B and another 5 waves down in C.
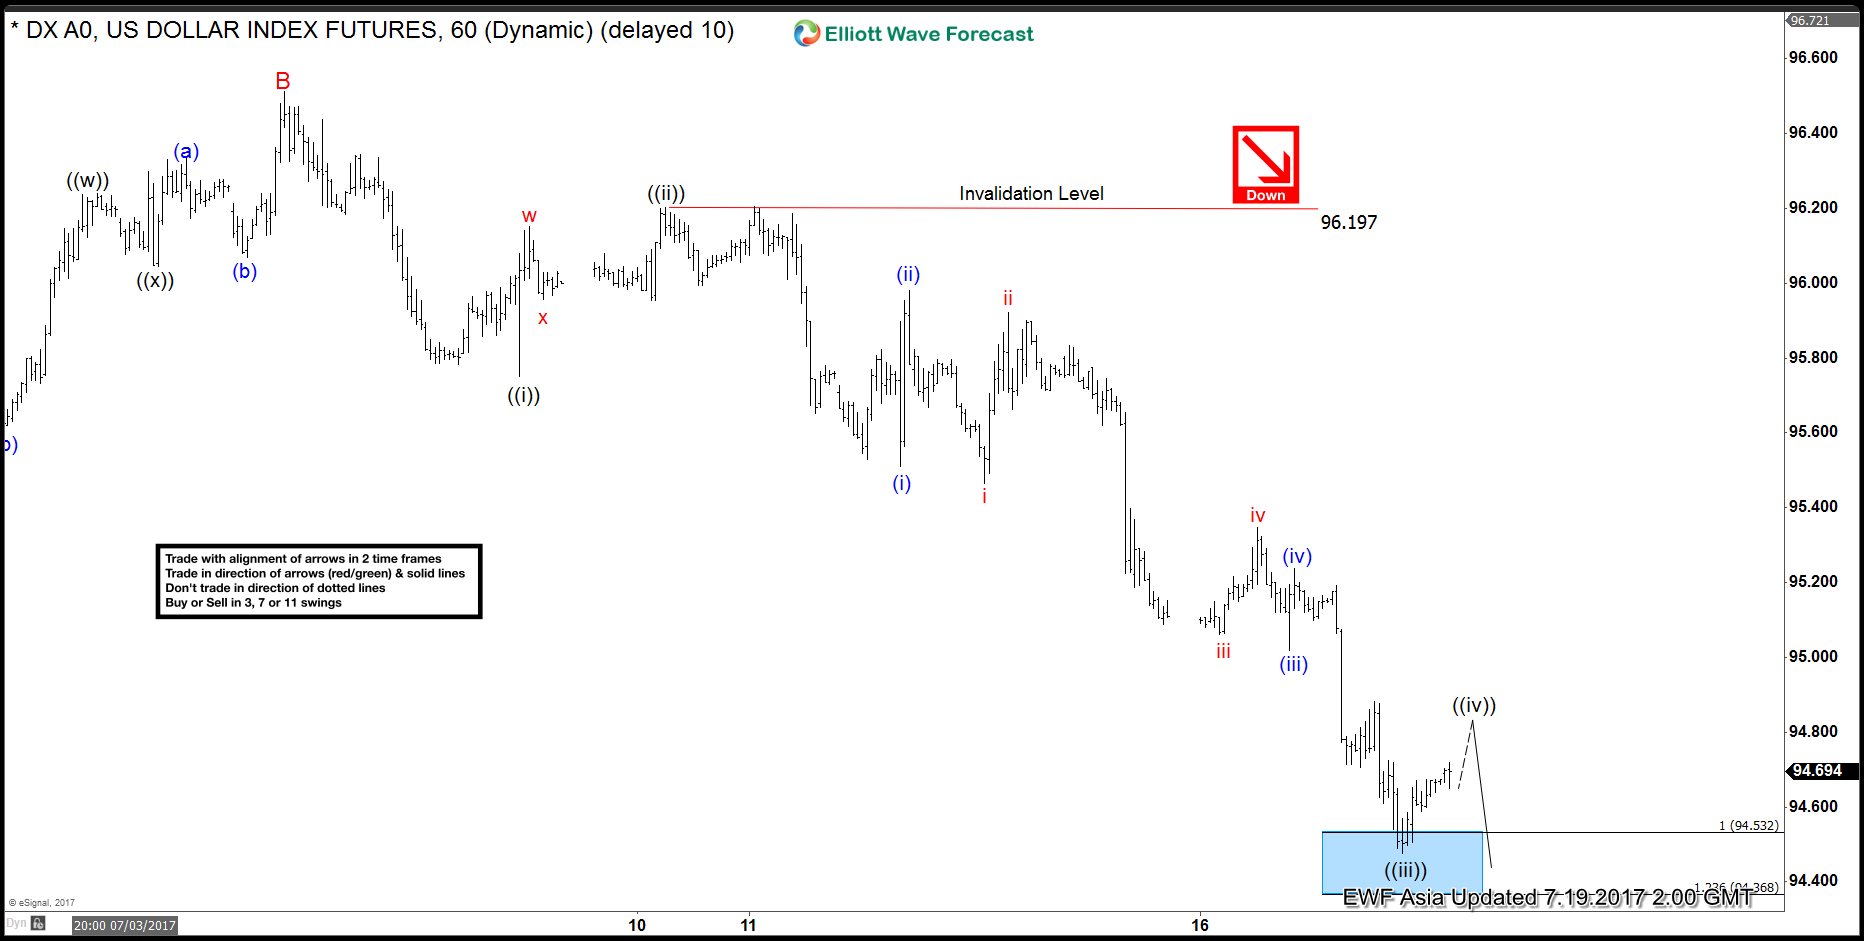
Short term DXY (USD Index) Elliott Wave view suggests the decline from 6/20 peak (97.87) is unfolding as a Zigzag Elliott Wave structure. Down from 97.87 high, decline to 95.47 ended Minor wave A, and bounce to 96.51 high ended Minor wave B. Wave C is unfolding as an Elliott wave Impulse structure with extension where Minute wave ((i)) ended at 95.75, Minute wave ((ii)) ended at 96.2, and Minute wave ((iii)) ended at 94.47. Minute wave ((iii)) is subdivided into another impulsive wave of a smaller degree. Minutte wave (i) ended at 95.51, Minutte wave (ii) ended at 95.98, Minutte wave (iii) ended at 95.01, Minutte wave (iv) ended at 95.24, and Minutte wave (v) of ((iii)) ended at 94.47.
Currently Minutte wave ((iv)) is in progress to correct cycle from 7/10 high, and while pivot at 7/10 high holds, expect Index to turn lower again. We don’t like buying the Index and expect bounces to find offer in 3, 7, or 11 swing for more downside.
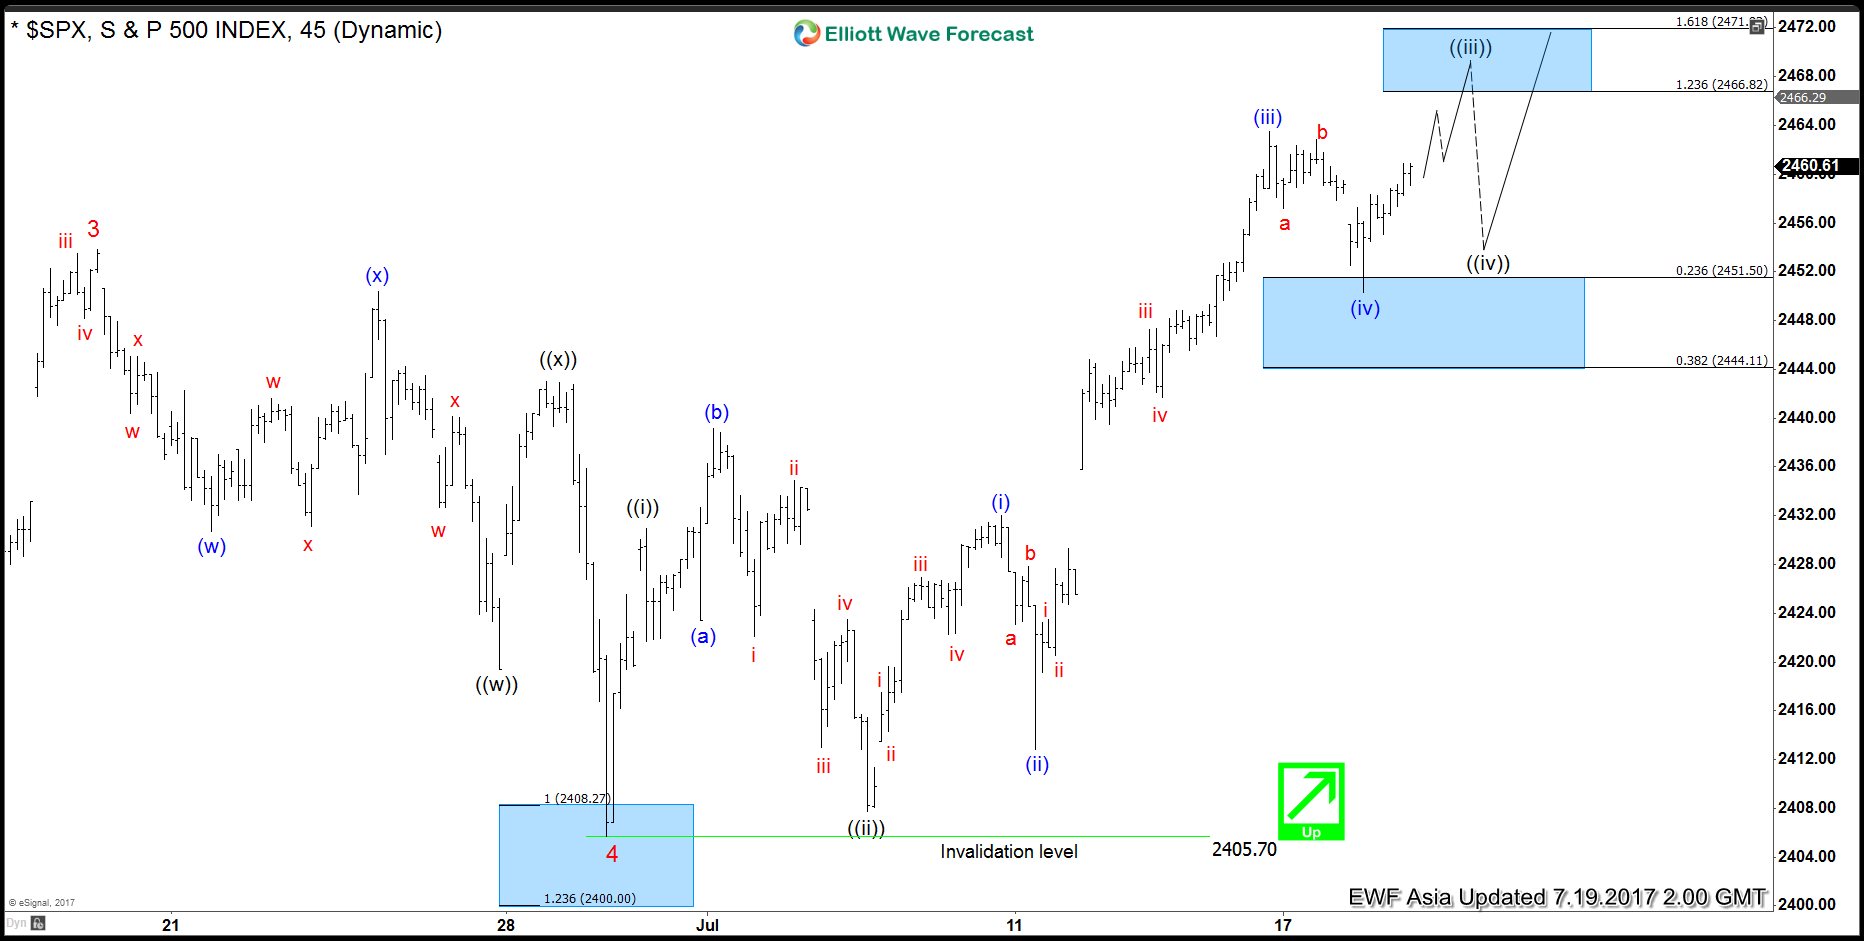
Short term SPX Elliott Wave view suggests the rally from 5/18 low (2352.7) to 6/19 peak (2453.8) ended Minor wave 3. The pullback from 2453.8 to 2405.70 on 6/29 low ended Minor wave 4. Up from there, the rally is unfolding as an impulse Elliott Wave structure with extension. This 5 waves move could be Minute wave ((a)) of an Elliott wave zigzag structure where Minute wave ((i)) ended at 2431 and Minute wave ((ii)) ended at 2407.7.
Minute wave ((iii)) is subdivided into another impulsive waves of a smaller degree. Minutte wave (i) ended at 2432, Minutte wave (ii) ended at 2412.8 and Minutte wave (iii) ended at 2463.5. Below from there Minutte wave (iv) ended at 2450.34 and above from there Minutte wave v of ((iii) is in progress towards 2466.82-2471.8 area. Afterwards, the Index should pullback in Minute wave ((iv)) before further upside, provided that pivot at 2405.70 low remains intact.
In case of further extension in Minutte wave (v) of ((iii)), the index could extend to (v)=(i) target area at 2474.7-2480.4 before a turn in Minute wave ((iv)) happens. If the pullback turns out to be rather strong then the Index could already end the cycle from 6/29 low (2405.7) as an Elliottwave Flat structure, and it should then correct the cycle from 6/29 low before the rally resumes. We don’t like selling the Index and favors more upside as far as pivot at 2405.70 low remains intact.
Short term DXY (USD Index) Elliott Wave view suggests the decline from 6/20 peak (97.87) is unfolding as a Zigzag Elliott Wave structure. Down from 97.87 high, decline to 95.47 ended Minor wave A, and bounce to 96.51 high ended Minor wave B. Wave C is unfolding as an Elliott wave Impulse structure with extension where Minute wave ((i)) ended at 95.75, Minute wave ((ii)) ended at 96.2, and Minute wave ((iii)) ended at 94.47. Minute wave ((iii)) is subdivided into another impulsive wave of a smaller degree. Minutte wave (i) ended at 95.51, Minutte wave (ii) ended at 95.98, Minutte wave (iii) ended at 95.01, Minutte wave (iv) ended at 95.24, and Minutte wave (v) of ((iii)) ended at 94.47.
Currently Minutte wave ((iv)) is in progress to correct cycle from 7/10 high as a double three Elliott wave structure towards 95.05 – 95.15. While pivot at 7/10 high holds, expect Index to turn lower again. We don’t like buying the Index and expect bounces to find offer in the above area for more downside or 3 waves pullback at least.
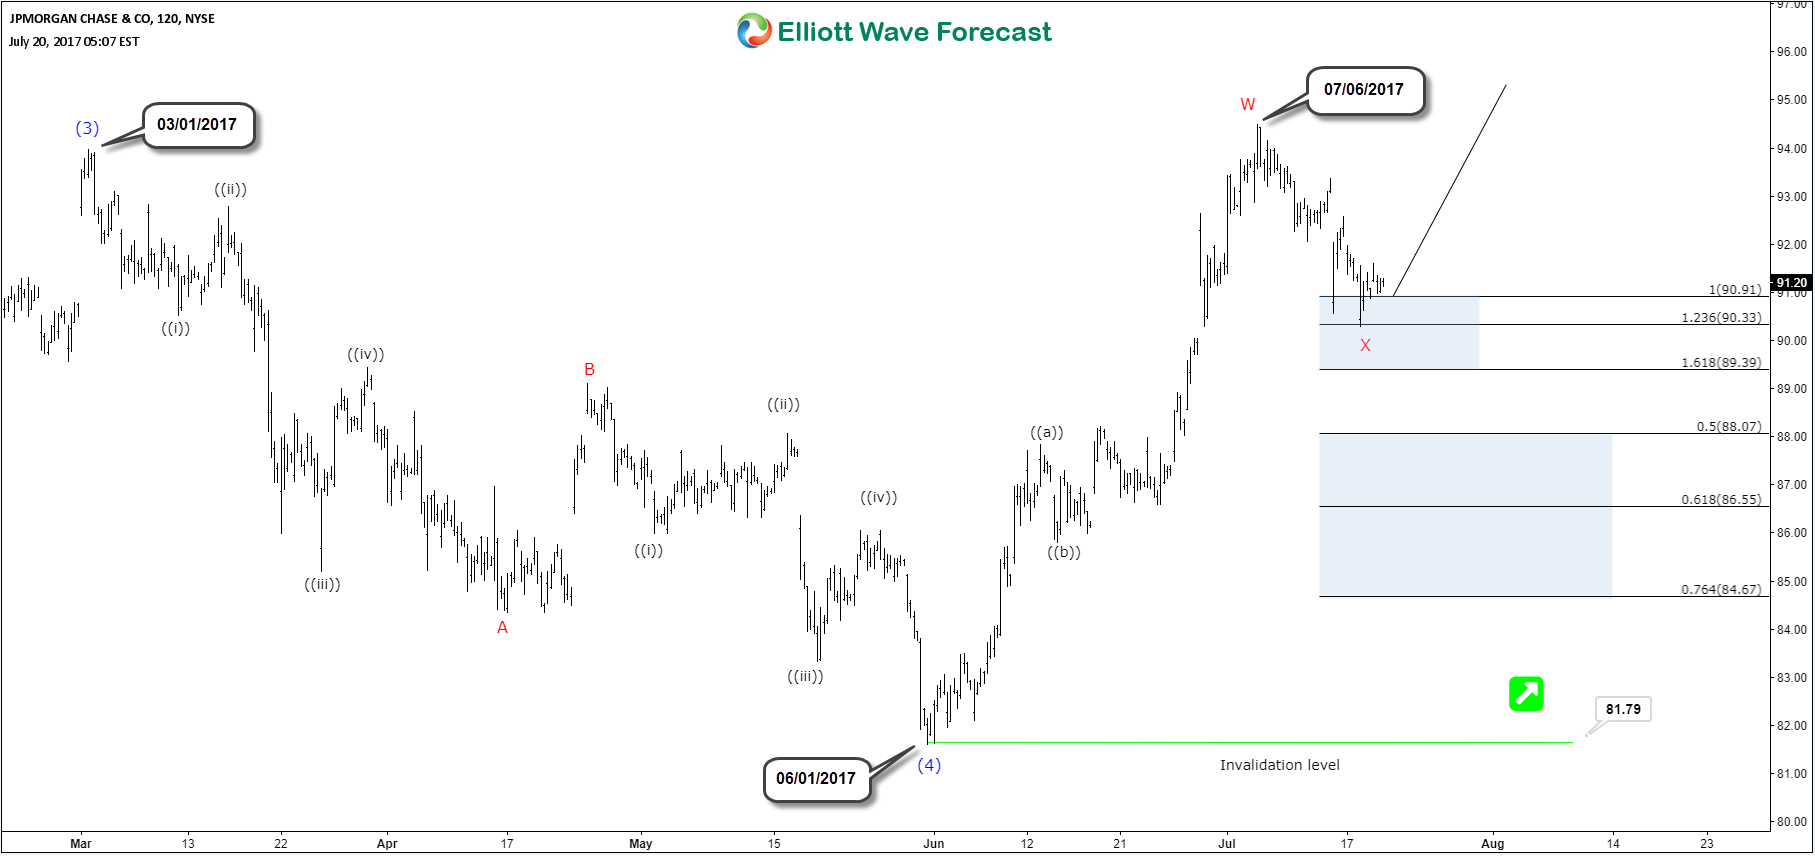
The Elliott Wave view for JPMorgan Chase (NYSE: JPM) suggests the rally from February 2016 low (52.5) to 03/01/2017 peak (93.98) have ended wave (3). The pullback from there unfolded as zigzag ABC structure which ended wave (4) at 06/01/2017 low (81.79). Up from there, the stock rallied in another zigzag structure before ending that short term cycle after reaching extreme on 07/06/2017 peak (94.51).
Therefore, JPM made new all time highs and it’s now showing 5 waves from 2016 low and still looking to reach the minimum target at $100.5. The stock can either rally from current levels as it already did 3 waves pullback and reached short term equal legs area 90.9 – 89.39, or the correction can still extend further toward the 50 – 76.4 Fibonacci retracement before finding buyers again to rally to new highs or bounce in 3 waves at least.
However if JPM fails to make new highs and the pivot at June low gives up, then the stock could be still in wave (4) doing an Irregular Flat correction which can take it toward 82-97 area before being able to resume the rally.
JPM 4H Chart 07/20/2017
The market conditions have changed over time, so instruments can now be trending higher or lower in series of 3 wave sequences rather than impulsive sequence and this can be frequently seen in the forex market. No one is perfect and we don’t claim to have 100% accuracy, but a system with high accuracy acts as a great trading tool because forecasting is a process of continuous adjustments. A waver (trader) needs to accept when an idea doesn’t work out and adjust to new data.
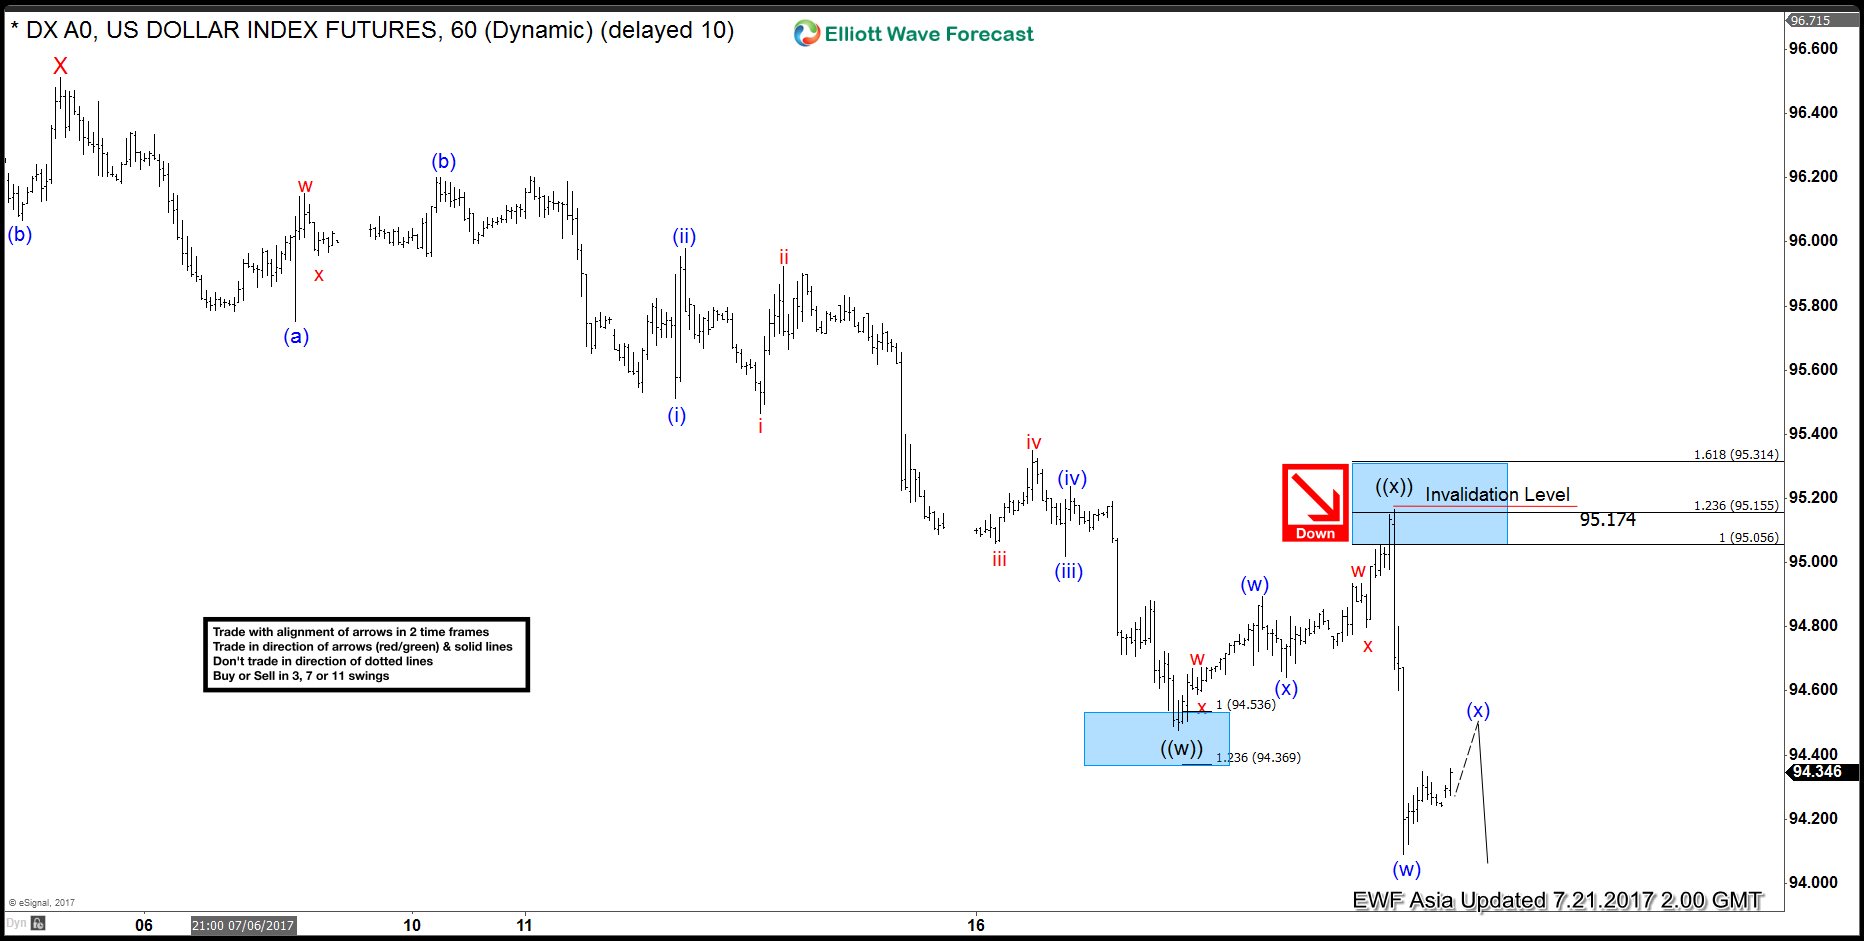
Revised short term DXY (USD Index) Elliott Wave view suggests the decline from 6/20 peak (97.87) is unfolding as a double three Elliott wave structure. Down from 97.87 high, decline to 95.47 ended Minor wave W, and bounce to 96.51 high ended Minor wave X. Wave Y is unfolding as another double three Elliott wave structure of a smaller degree where Minute wave ((w)) ended at 94.47 and Minute wave ((x)) ended at 95.17. The Index has broken below 94.47 suggesting Minute wave ((y)) lower has started. Down from 94.47, Minutte wave (w) ended at 94.09, and Minutte wave (x) is in progress to correct cycle from 7/20 peak before Index resumes lower. We don’t like buying the proposed bounce and expect sellers to appear after Minutte wave (x) bounce is complete in 3, 7, or 11 swing as far as pivot at 95.17 stays intact.
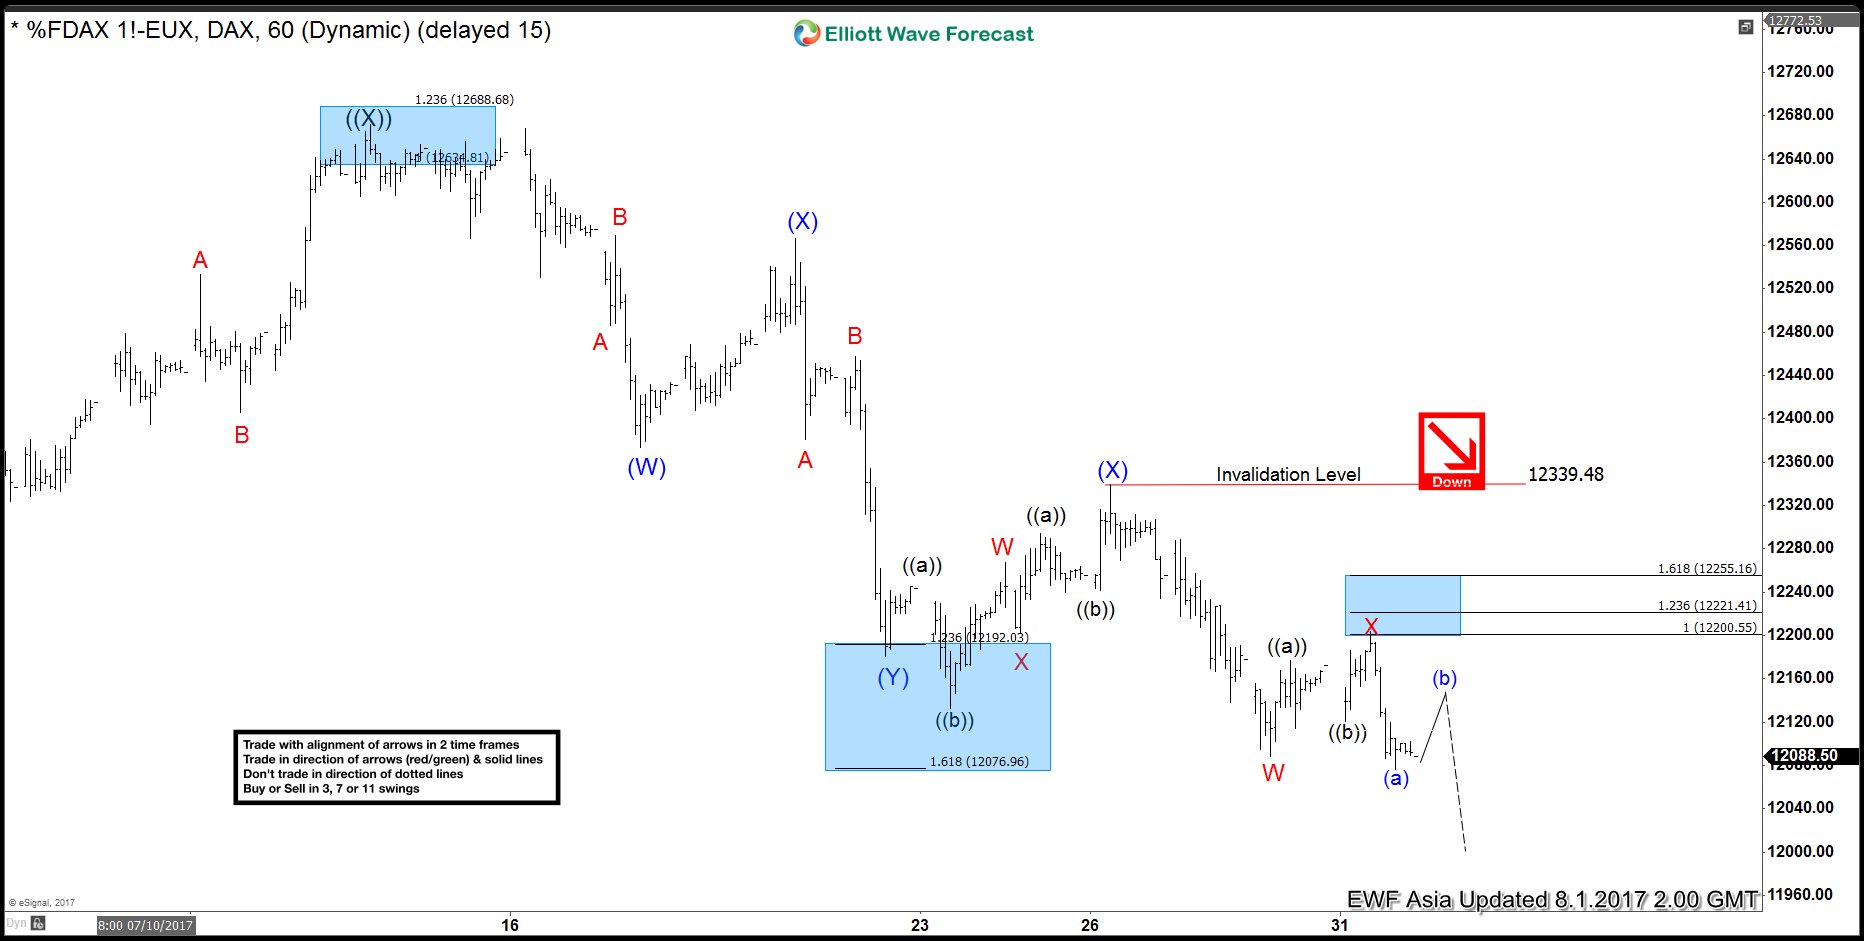
Short term DAX Elliott Wave view suggests the decline from 5/15 high is unfolding as a double three Elliott wave structure. Down from 5/15 peak, Primary wave ((W)) ended at 12303 as a Flat and Primary wave ((X)) bounce ended at 12672. Primary wave ((Y)) is currently in progress and unfolding as a triple three Elliott wave structure. Down from 12672 peak, Intermediate wave (W) ended at 12373.5, Intermediate wave (X) ended at 12567, Intermediate wave (Y) ended at 12180.5 and Intermediate second wave (X) ended at 12339.48. Near term, while bounces stay below 12339.48, expect the Index to resume lower towards 11878.65 – 12030.11 area to end cycle from 5/15 high. Afterwards, from that area, expect the Index to at least bounce in 3 waves to correct cycle from 5/15 high.
The following chart shows NASDAQ composite index. The index has a tremendous rally since the lows around 1975 which is pretty close to the zero level. The index has reached the bottom of the blue box at 6219 area. The question then is whether the index will extend higher or start correcting lower as the minimal target has been reached. As we often say, Elliott wave theory by itself is not enough. In this case, we can see that from the zero line, we can count the index as a completed ABC. However, we can also count it as an incomplete ABC with a black((4)) still to happen. In the Elliott wave theory, any five waves structure always at one moment is a three wave move. It is therefore too early at this stage to determine if the rally will develop into a five waves move.
In Elliottwave-forecast, we have implemented new ideas and tools to make the theory a more reliable tool. We use cycles, sequences, distributions and momentum indicators to increase the accuracy of Elliott wave theory. As we show in the chart, the RSI (Relative Strength Index) indicator is still showing a divergence compared to the peak in 1999. One of the rules that we introduced in the new Eliott wave theory is that a three waves move can not have divergence in any single time frame. Looking at Nasdaq quarterly chart, we can observe the divergence between momentum and price action. Thus, the index still has scope to extend into the areas of 7431 minimal or even reach the 9391 area before the 2009 rally is complete.
The five waves move in blue degree is now about to end. But we feel very comfortable to say that the pullback will be another buying opportunity. It is very easy to trade following our forecast. We always prioritize the trend and we use a distribution system and a series of pivots and cycles to prioritize the trend. In conclusion, even though the index has reached the minimal target, a multi market correlation and simple indicator like the RSI are calling for a pullback soon into a wave four but more upside to follow afterwards.
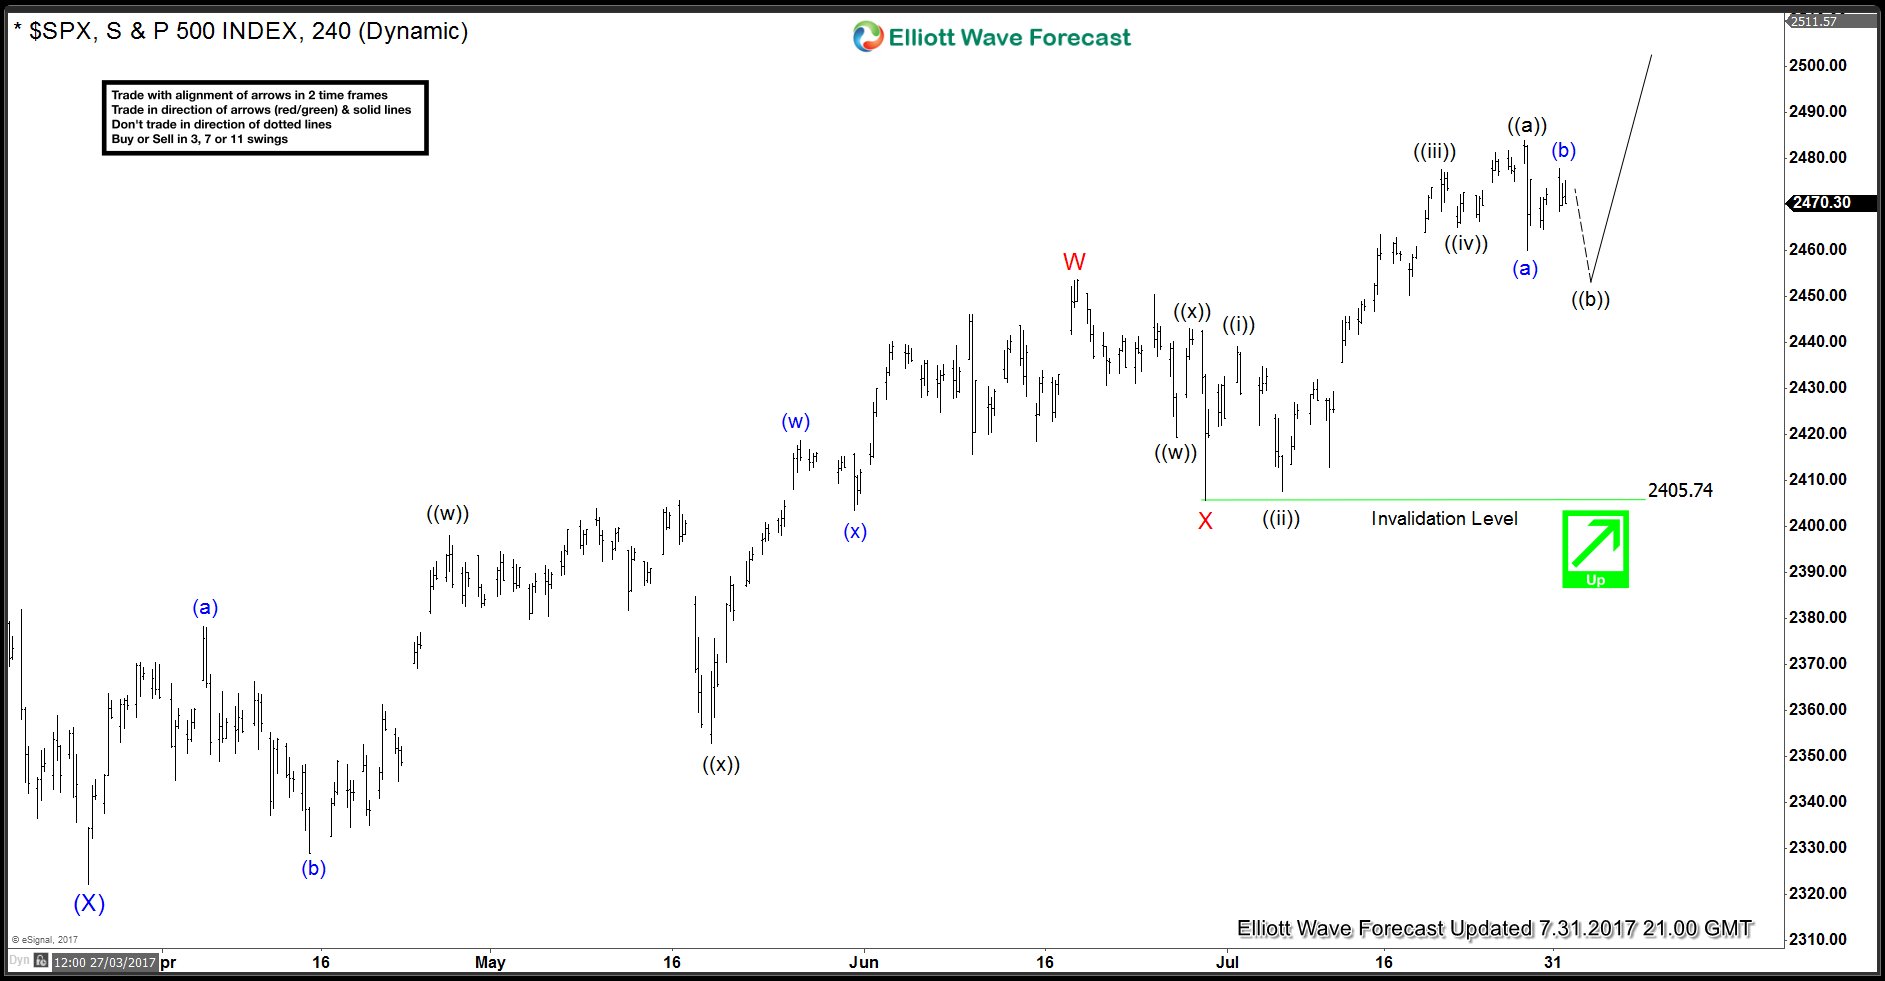
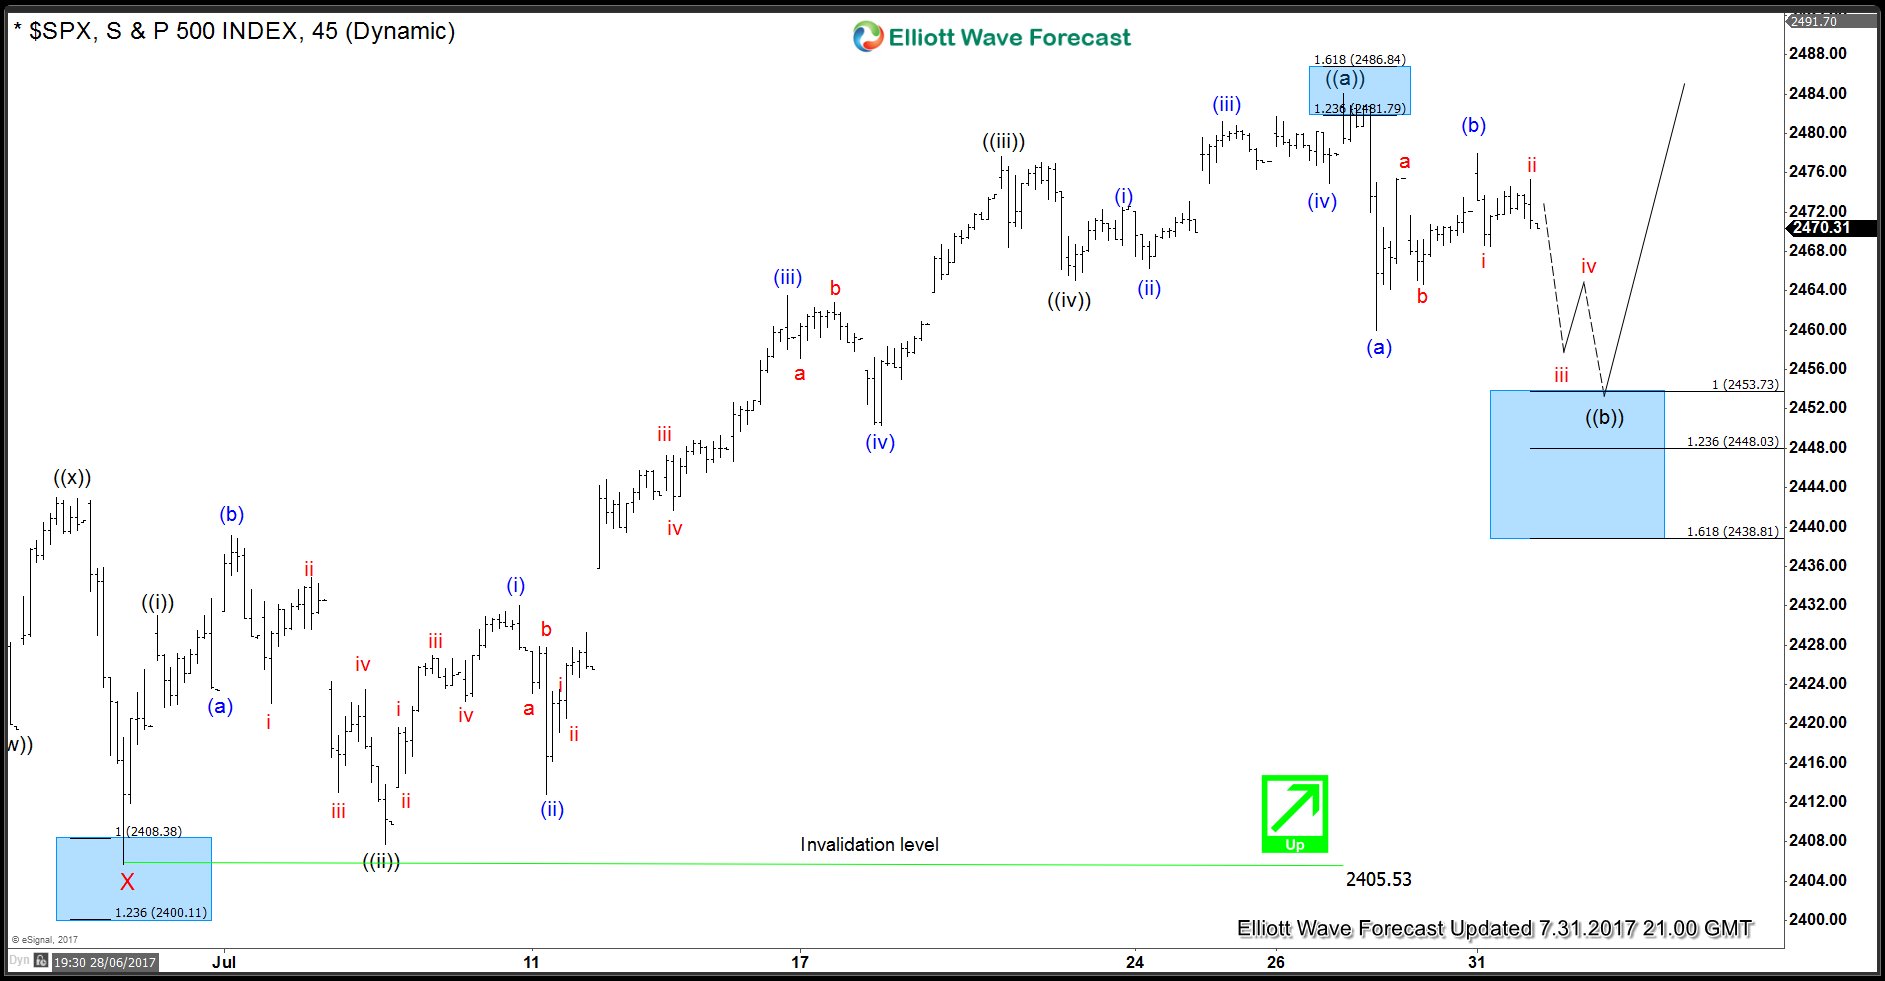
SPX500 move up from 3/27 (2322) low is proposed to be unfolding as a double three Elliott wave structure when rally to 6/19 (2453) completed wave W and dip to 6/29 (2405.74) completed wave X. Up from there, Index rallied in 5 waves to 7/27 (2484) which completed wave ((a)) of Y and now the Index is showing 5 swings up from 3/27 low. 5 swings is an incomplete sequence and calls for more upside to complete 7 swings sequence. Index is currently in wave ((b)) correcting the cycle from 2405.74 low. This pull back is expected to unfold as a zig-zag Elliott wave pattern and while below 7/31 (2477), SPX500 has scope to trade lower towards 2453.73 – 2438.81 area to complete wave ((b)). From this area, SPX500 should turn higher to resume the rally in wave ((c)) of Y towards 2537 – 2568 area or bounce in three waves at least. In case the bounce from the above mentioned area fails to make a new high, then Index could turn lower and do a 7 swings pull back in wave ((b)) before starting wave ((c)) higher. We don’t like selling the Index and favor buying the dip towards 2453.73 – 2438.81 area looking for a target of 2537 area or a 3 waves bounce at least to get into a risk free position.
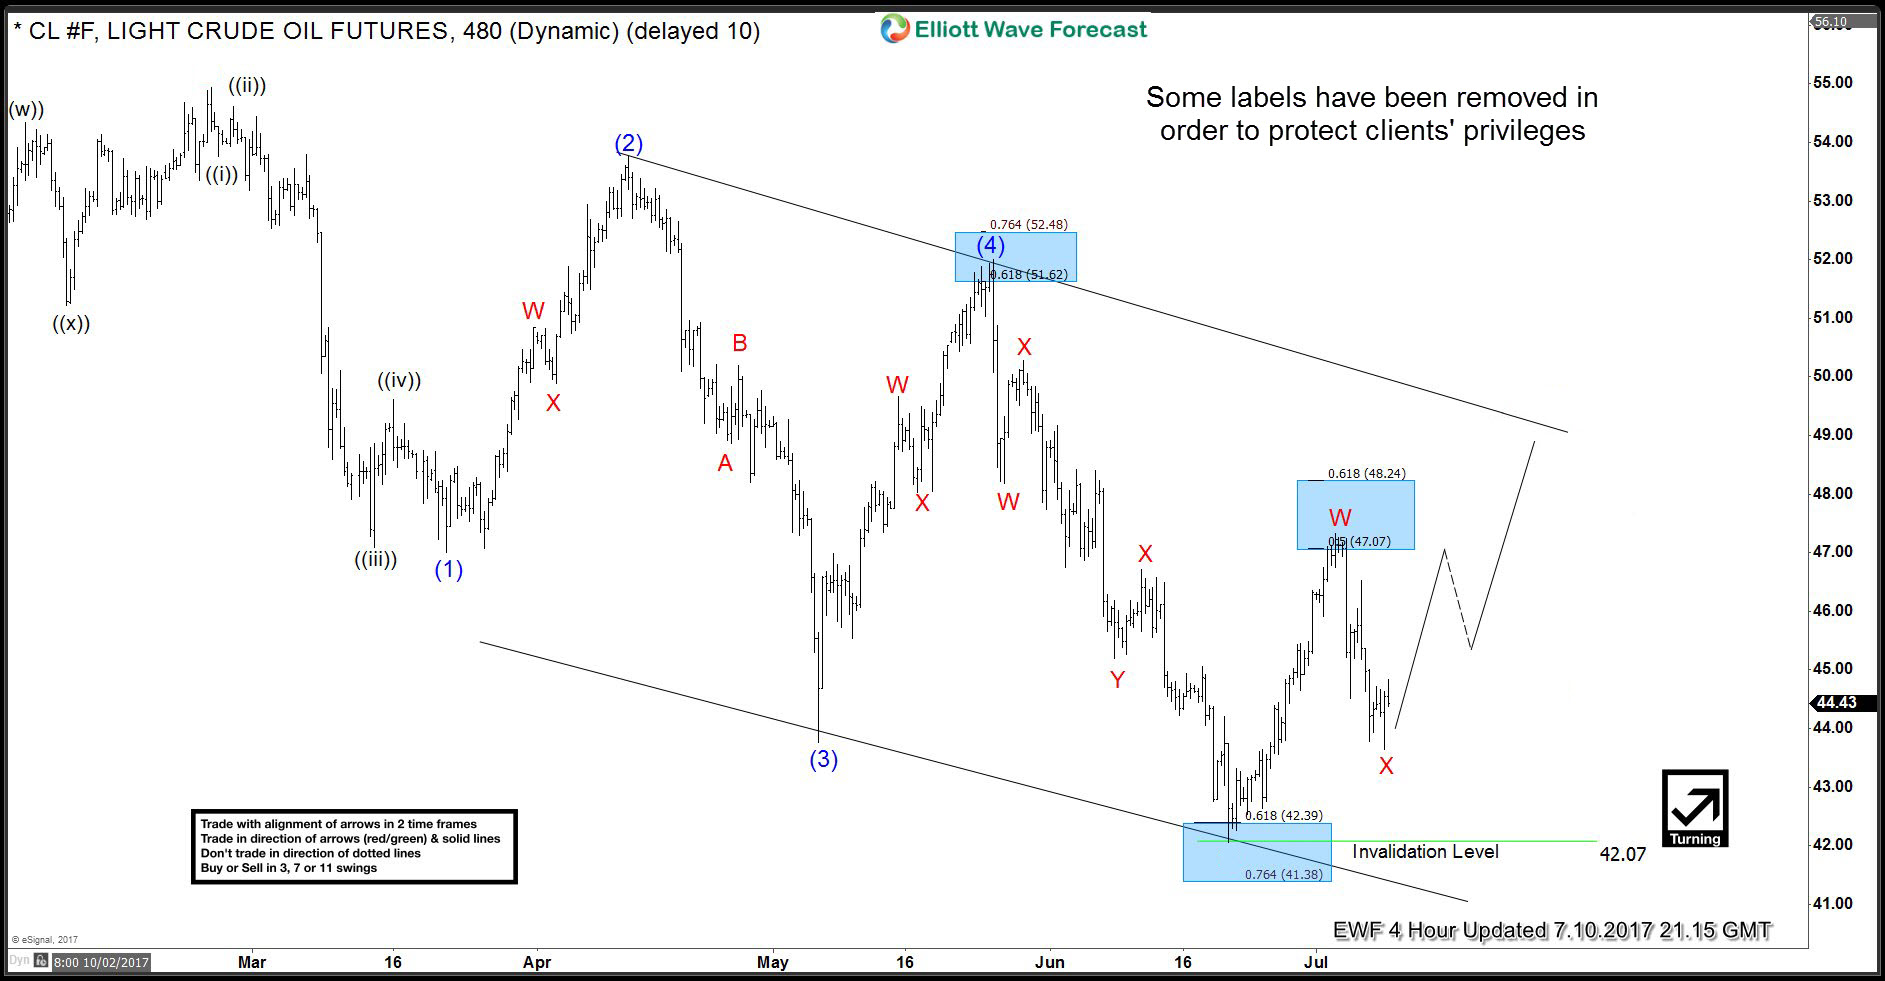
Hello fellow traders. In this technical blog we’re going to take a quick look at the past Elliott Wave chart of OIL ( CL_F ) published in members area. In further text we’re going to explain the structure and to see how we forecasted the path. Let’s start with 4 hour chart.
OIL ( CL_F ) Elliott Wave 4 Hour Chart 07.10. 2017
Our Elliott Wave forecast suggests that cycle from the December 2016’s peak has ended at 42.07 low. Consequently we’re expecting further strength in larger 3 wave bounce at least. The chart is calling X red pull back completed at 43.60 low, suggesting we’re already in Y red higher. We’re targeting upper line of down trending channel and more importantly W-X equal legs at 48.99-50.25 area
Now let’s go back 2 days and take a look at the smaller time frame to see how we forecasted potential reversal area.
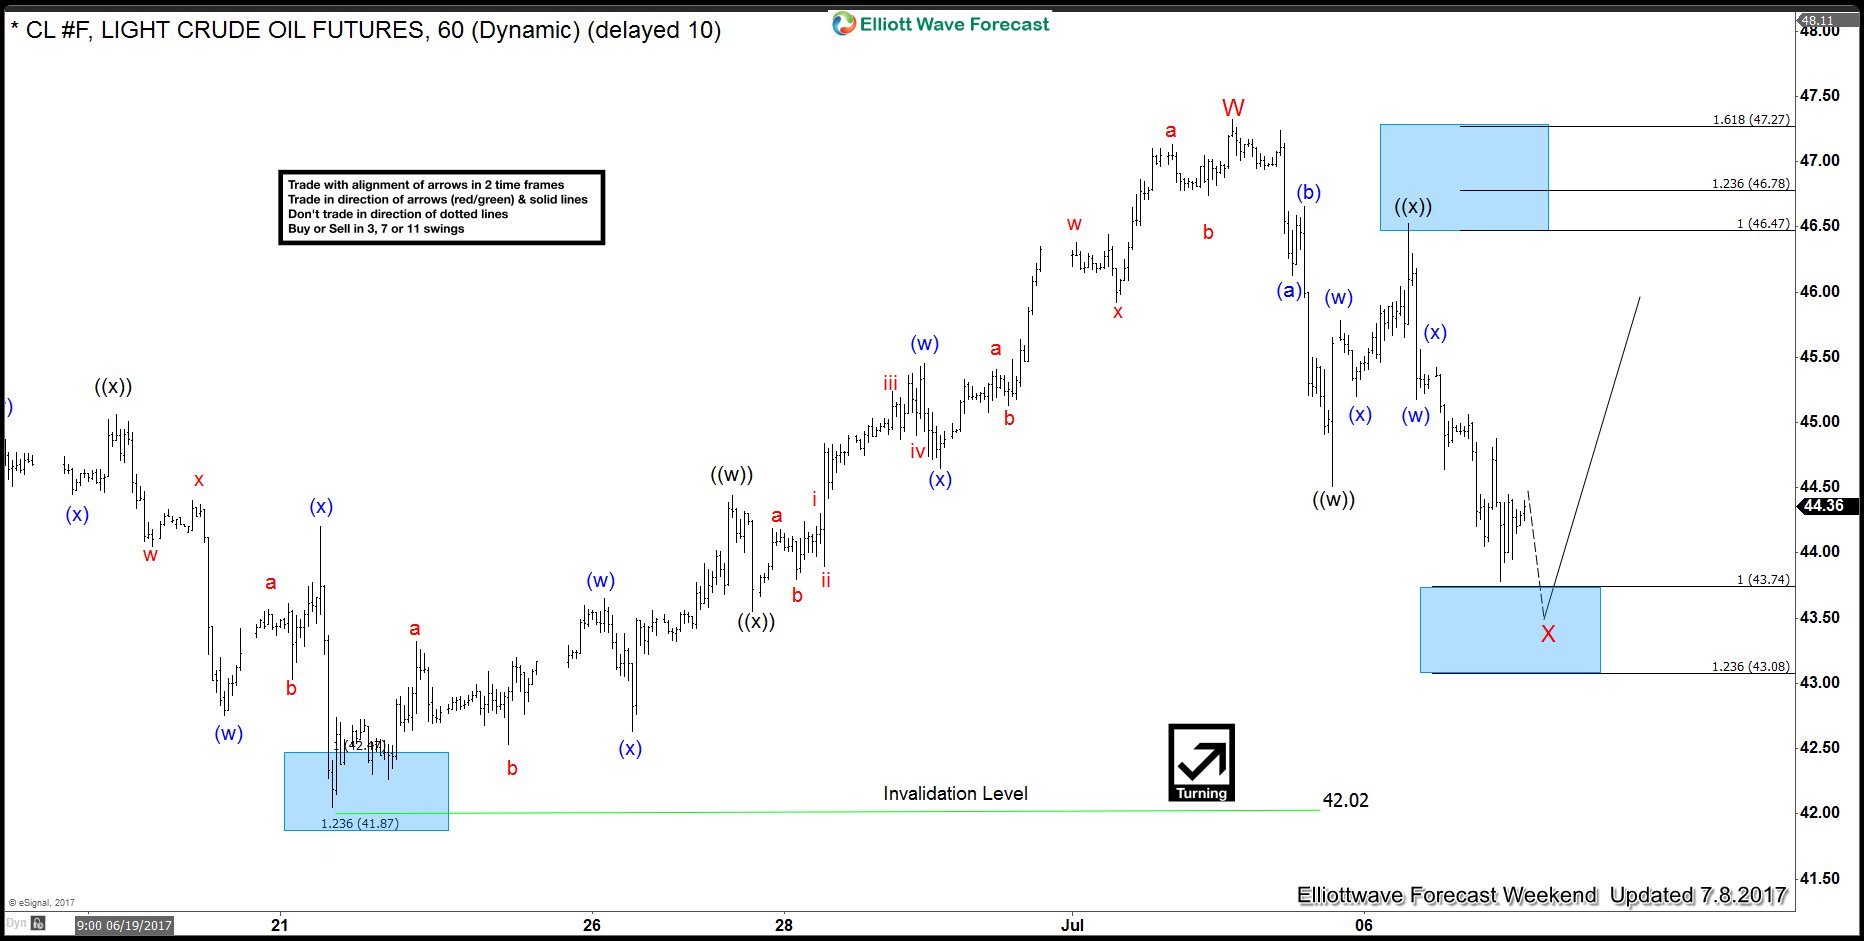
OIL ( CL_F ) Elliott Wave 1 Hour Chart 07.08. 2017
Oil is doing wave X red correction against the 42.02 low. We expect it to complete at short term technical area: 43.74-43.08 and find buyers for further rally. As far as 42.02 pivot holds we expect OIL to trade higher.
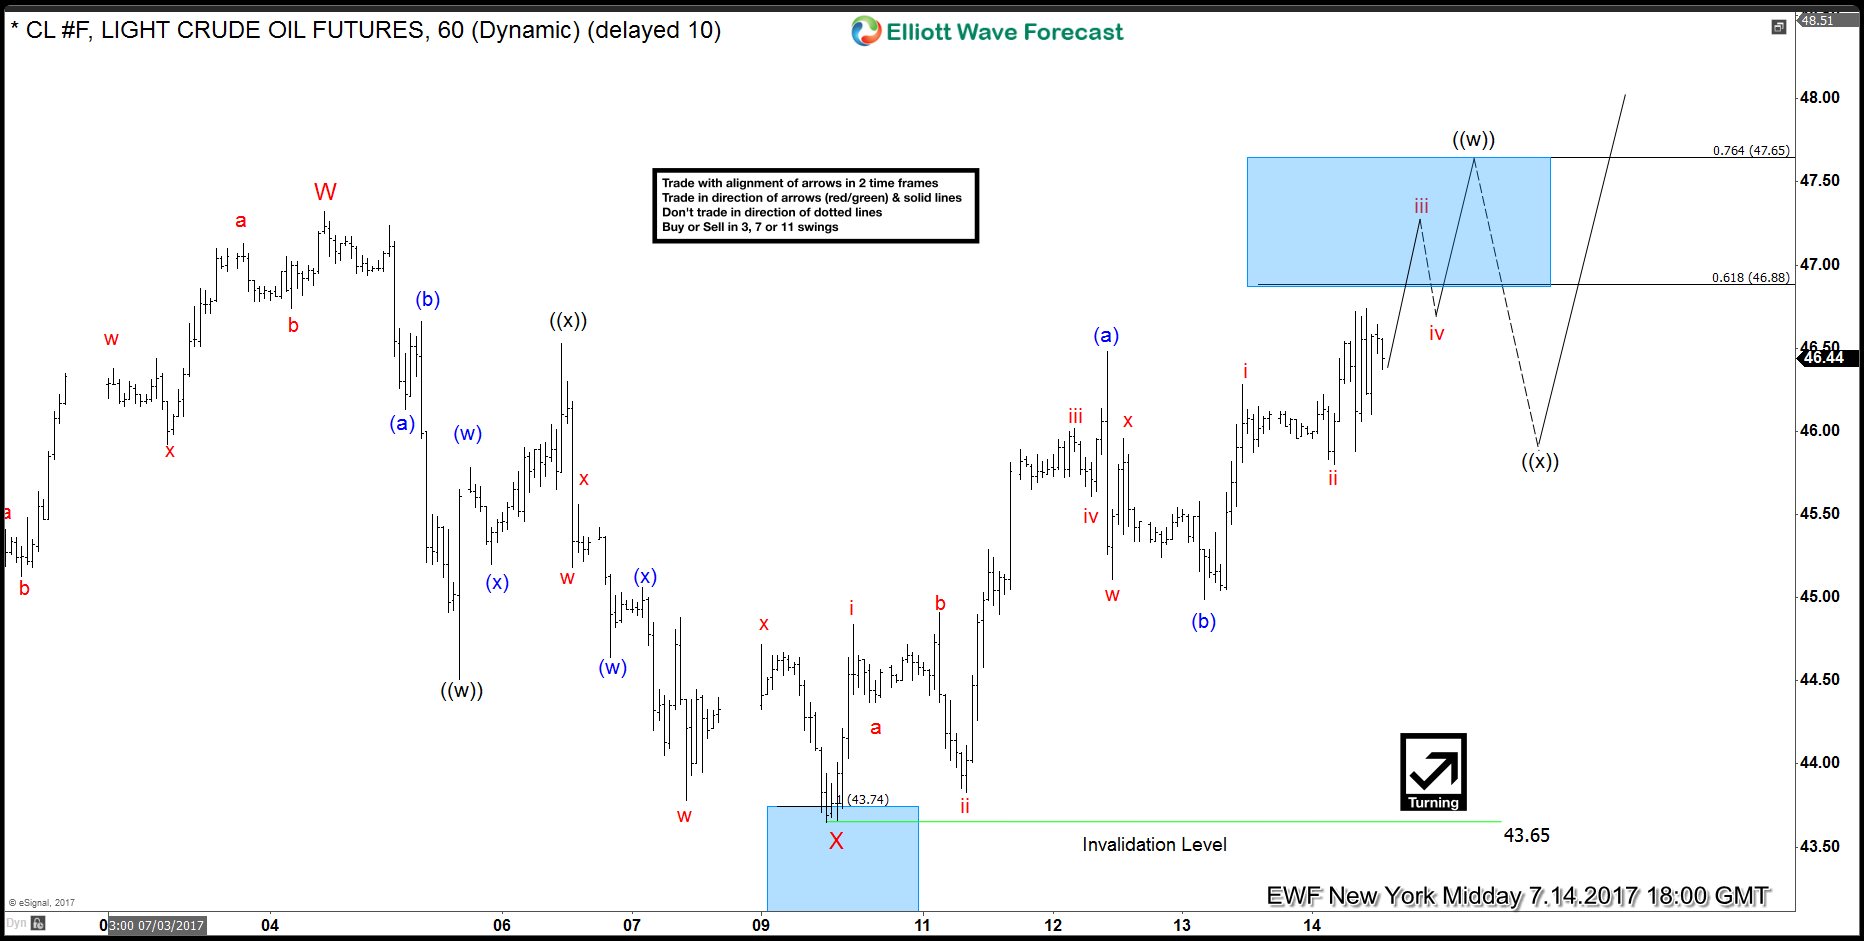
OIL ( CL_F ) Elliott Wave 1 Hour Chart 07.14. 2017
Commodity found buyers right at the blue box, completed X red pull back at 43.65 low and gave us nice rally. It’s heading toward 0.618-0.764 Fibonacci extension at 46.88-47.65, that can produce 3 wave pull back ((x)) before rally resumes. We would like to see break above W red peak 07/04 to confirm proposed bullish view.
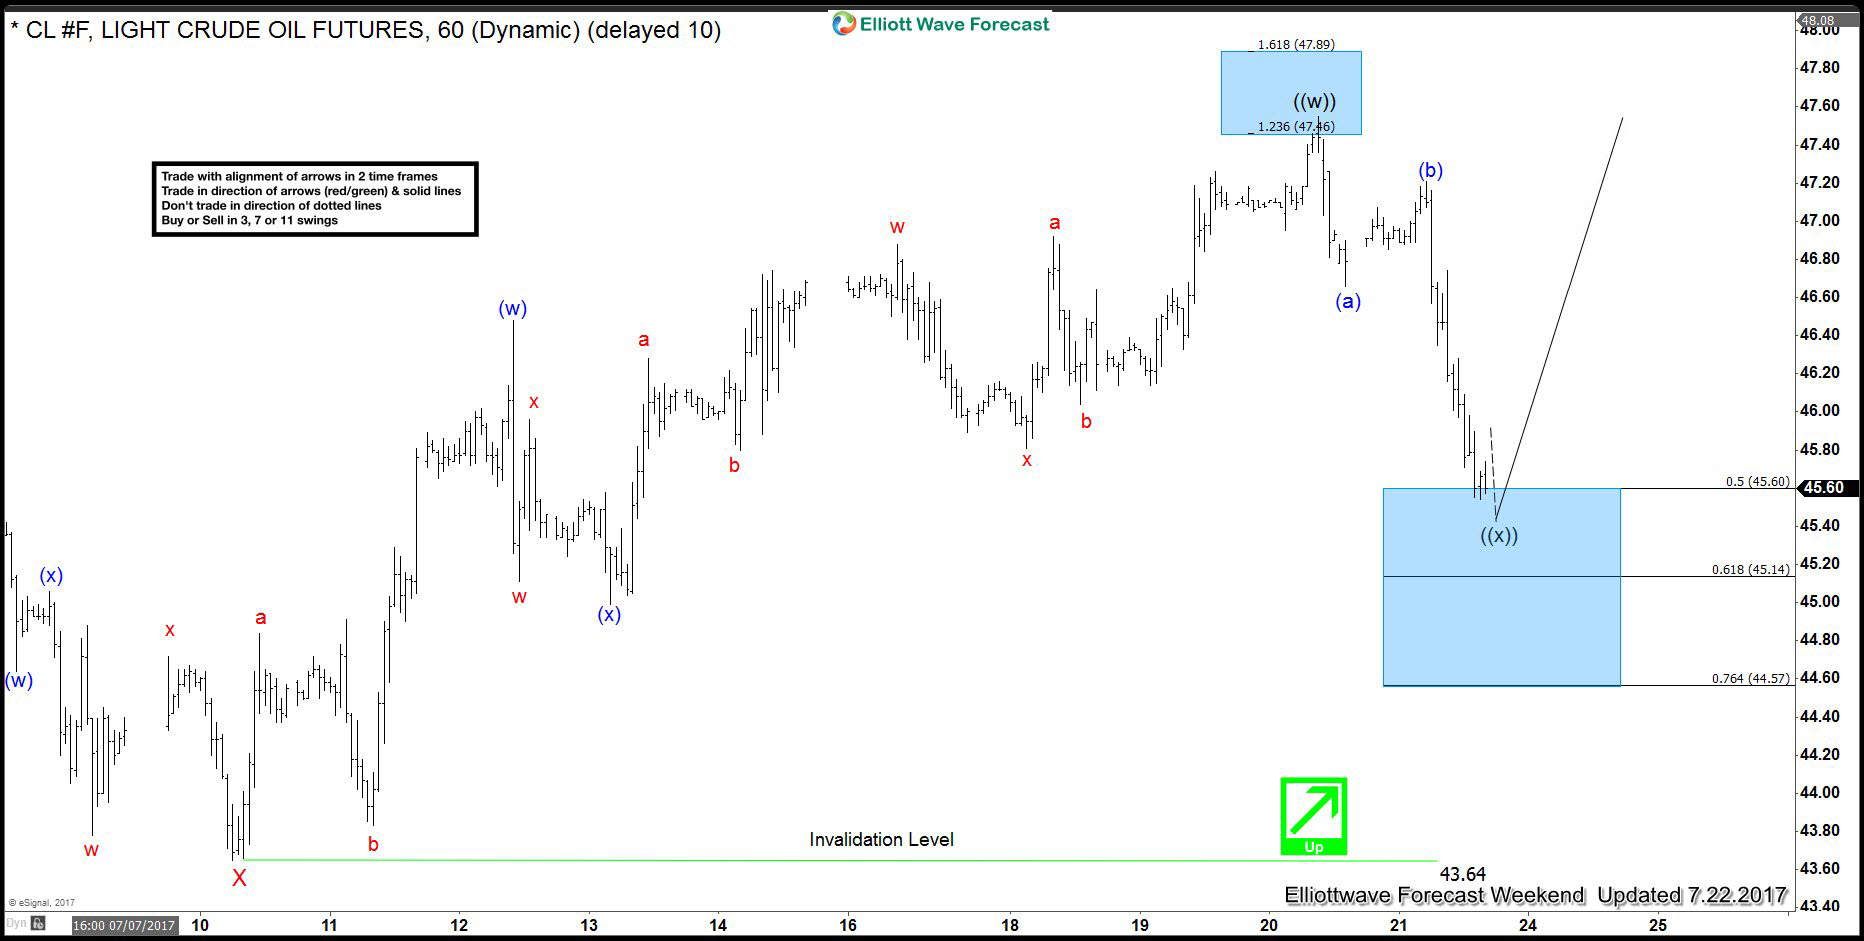
OIL ( CL_F ) Elliott Wave 1 Hour Chart 07.22. 2017
In the mean time Oil has made the new high as expected. Currently it’s giving us ((x)) pull back from mentioned area , correcting the cycle from the 43.64 low. Currently at 50-61.8 fibs : 45.60-45.14 where it should find buyers again.
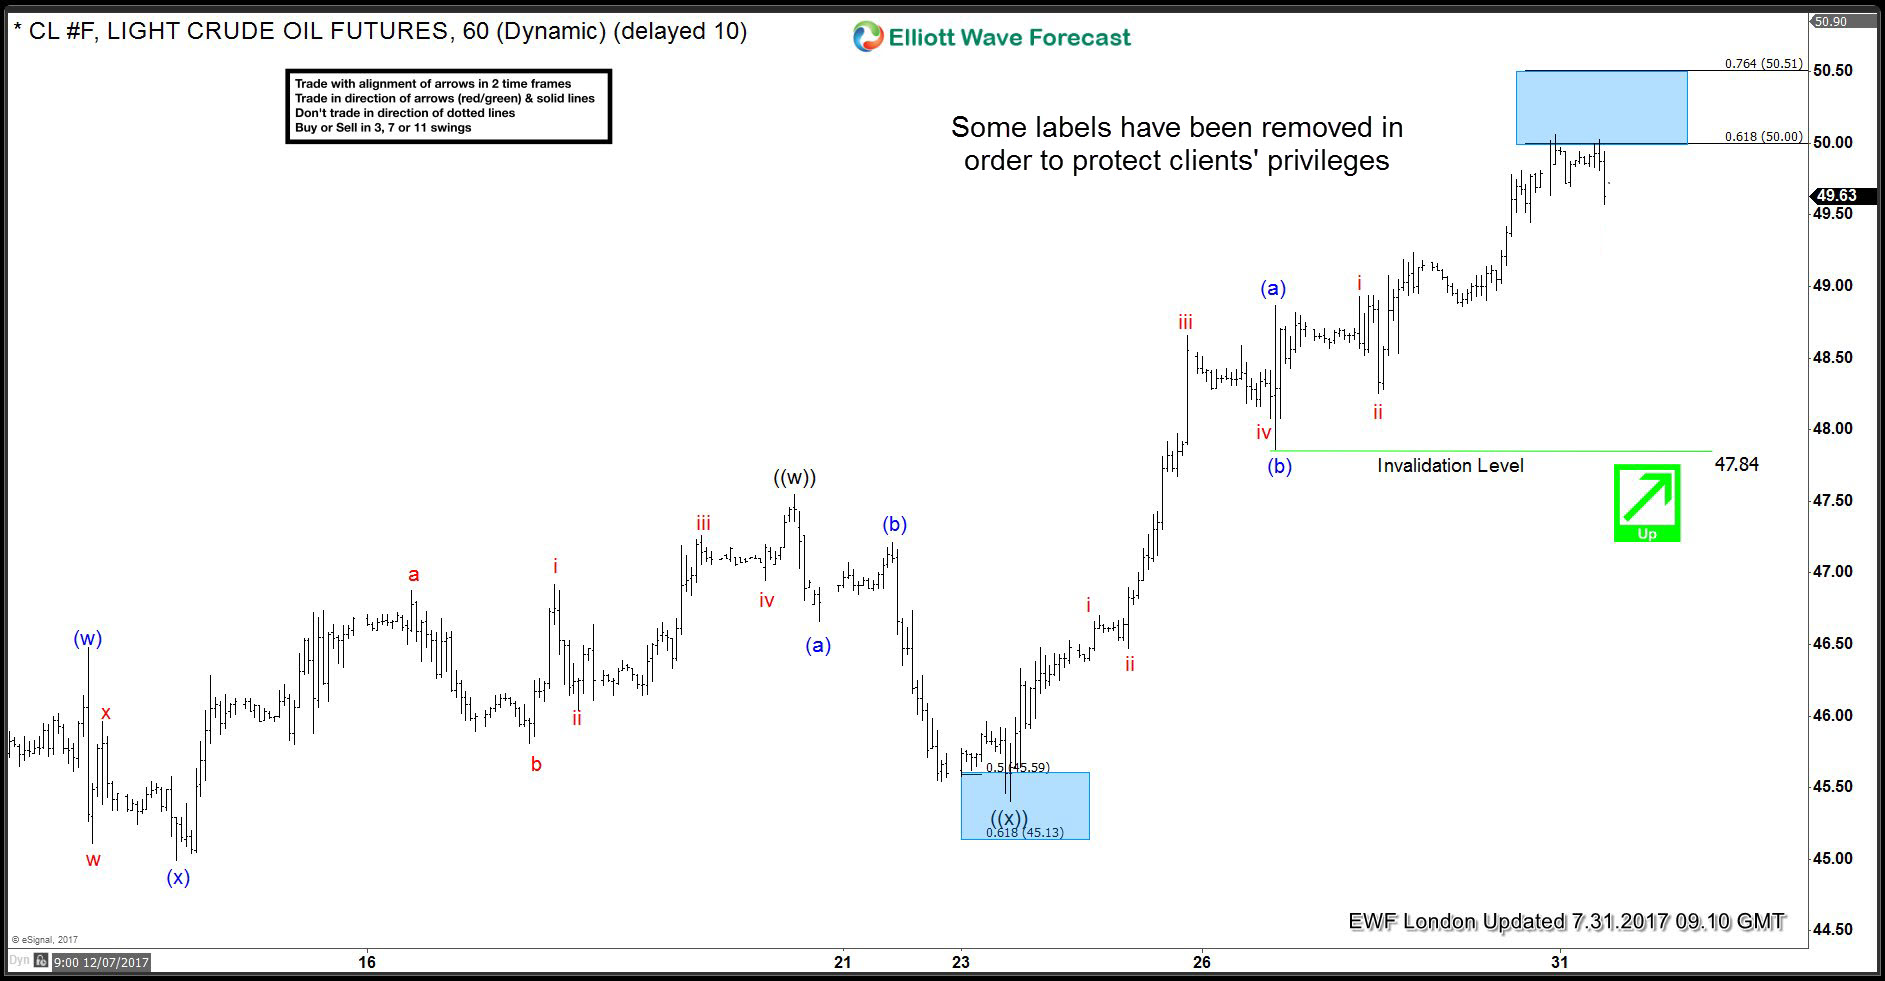
OIL ( CL_F ) Elliott Wave 1 Hour Chart 07.31. 2017
Oil completed pull back at proposed 50-61.8 fibs, and gave us further rally. Keep in mind market is dynamic.
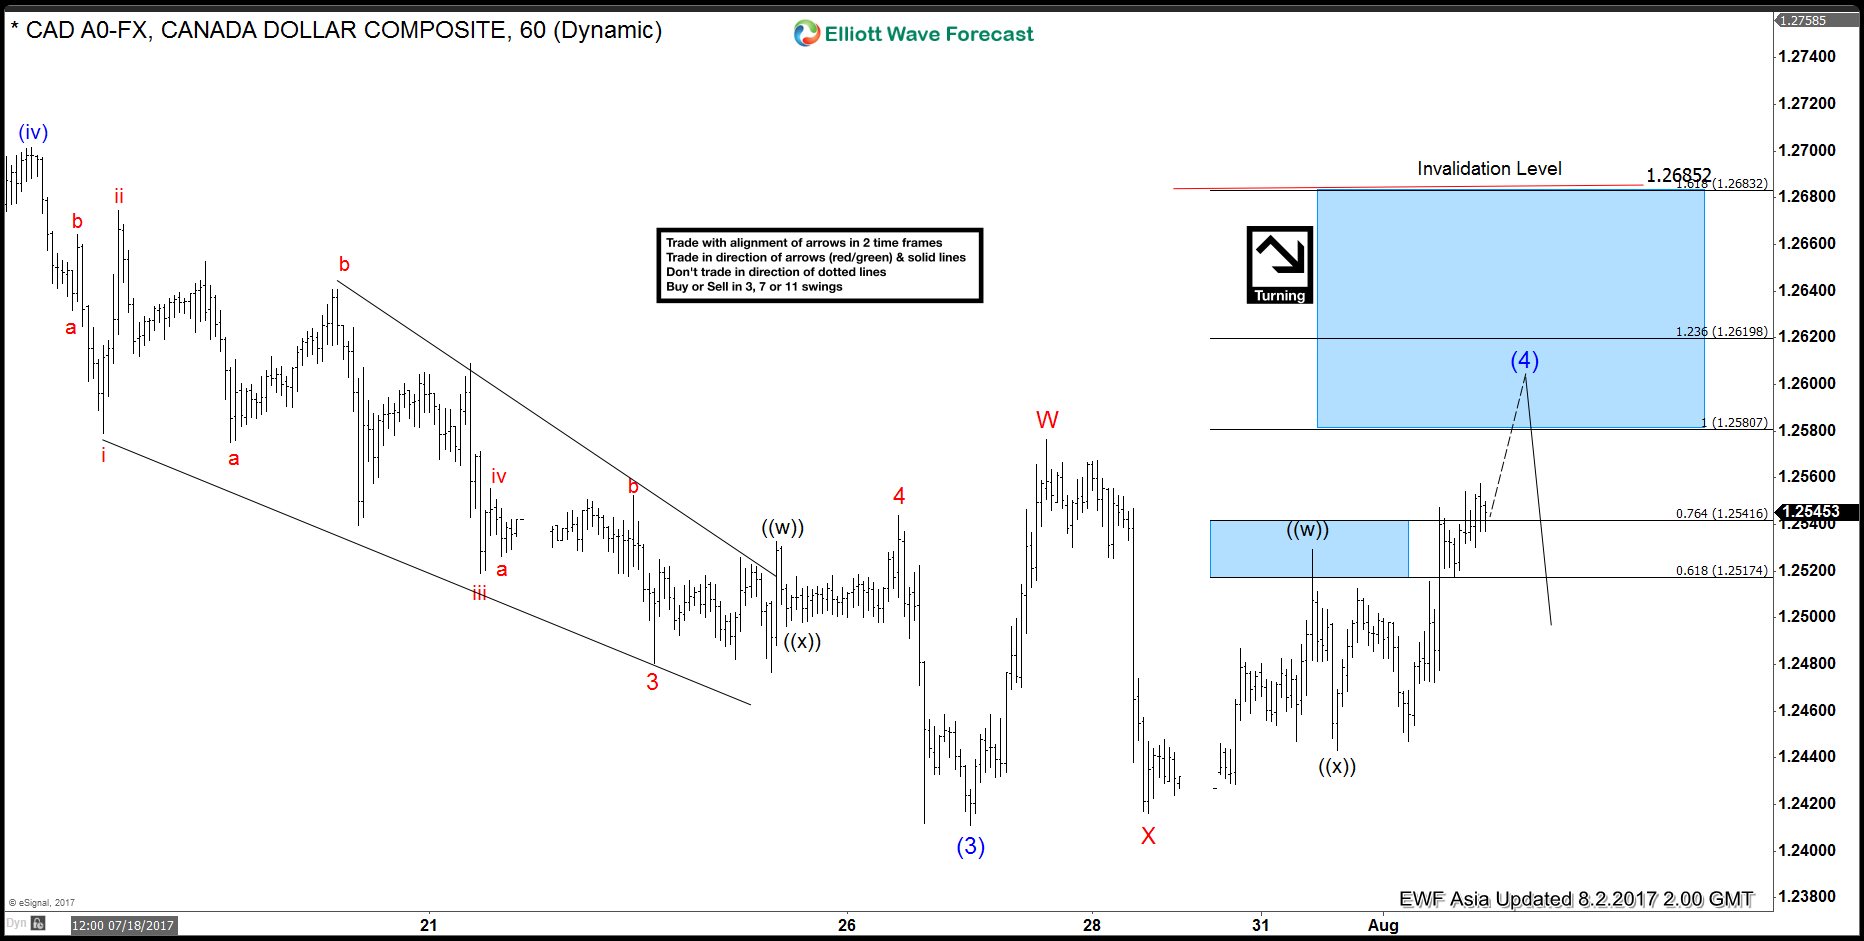
Short term USDCAD Elliott Wave view suggests the decline to 1.2411 ended Intermediate wave (3) of an Elliott Wave impulse structure from 6/2 peak. Intermediate wave (4) bounce is in progress as a double three Elliott wave structure where Minor wave W ended at 1.2576 and Minor wave X ended at 1.2416. Minor wave Y is subdivided also as a double three Elliott Wave structure. Up from 1.2416 low, Minute wave ((w)) ended at 1.253 and Minute wave ((x)) ended at 1.2443. Near term focus is on 1.258 – 1.262 area to complete Intermediate wave (4). Afterwards, pair should either resume to new low or at least pullback in 3 waves. We don’t like buying the proposed bounce.
USDCAD 1 Hour Elliott Wave Chart
Elliott Wave Theory is one of the most powerful forms of Technical Analysis to forecast the cycles and trends of financial markets. The Theory works by identifying the extremes in investor psychology. Elliott Wave Theory is flexible enough to incorporate any possible pricing structure. There is always an Elliott wave pattern suitable for the wave structures. Today, the market moves mostly in corrective manners so the first step would be to learn to recognize 3 wave structures in the charts. The 3 waves could be labeled as ABC but also as WXY as shown in the graph below. The way to label the 3 waves depends on the internal price structure of the wave subdivisions.