If you need a way to spot changes in trends quickly and reliably, one indicator that could help you out is the Chaikin Oscillator.
In this guide, we will explain what this indicator is, how it is calculated and how you can use it in your Forex trading.
What is the Chaikin Oscillator indicator?
The Chaikin Oscillator indicator applies the MACD formula to assessing the momentum of another indicator called the Accumulation-Distribution Line (ADL).
The indicator takes its name from Marc Chaikin, its creator.
By helping you identify where momentum may be shifting, the Chaikin Oscillator lets you know when a reversal may be on its way.
Key point: The Chaikin Oscillator indicator measures the momentum of another indicator called the Accumulation-Distribution Line.
How is the Chaikin Oscillator indicator calculated?
Calculating the Chaikin Oscillator can get to be a bit complicated, because first, you need to calculate the Accumulation-Distribution Line (ADL).
Here are the steps for calculating the ADL.
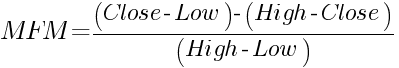
The first step is to calculate the Money Flow Multiplier (MFM):
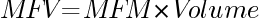
Then the Money Flow Volume (MFV) can be calculated using the Money Flow Multiplier (MFM) obtained above:
The ADL at the current period (i) is calculated based on the ADL at the previous period (i + 1) and the Money Flow Volume (MFV):

Now you can calculate the Chaikin Oscillator using the following formula:

where EMA is the exponential moving average.
There you go! Thankfully, you do not need to worry about doing these complicated calculations yourself, though it can be useful to see the formula to have a better understanding of the Chaikin Oscillator. Your trading platform will do the math for you so you can plot the indicator with just a few clicks.
Key point: Calculating the Chaikin Oscillator involves first calculating the ADL, and then subtracting the 10-day EMA of the ADL from the 3-day EMA of the ADL.
What does the Chaikin Oscillator indicator show you?
When you plot the Chaikin Oscillator, you will see it below your chart. The line oscillates above and below 0 (zero).
If you wished, you could also plot the 3-day and 10-day EMAs of the ADL yourself directly on the chart. If you did, you would notice that every time the 3-day EMA crosses under the 10-day EMA, the oscillator goes below 0. Each time the 3-day EMA rises above the 10-day EMA, the oscillator moves above 0.
It is important to note that the Chaikin Oscillator is not a direct comment on price. Instead, it is informing you about the ADL.
If the oscillator is negative, it means that the ADL is dropping, and selling pressure is prominent. If the oscillator is positive, it means that ADL is rising, and buying pressure is prominent.
Key point: The Chaikin Oscillator helps you identify whether buying or selling pressure is stronger.
How to plot the Chaikin Oscillator indicator on your charts
Here is how to add the Chaikin Oscillator to your MetaTrader 4 charts in a few simple steps:
- In the menu, go to Insert, Indicators, Oscillators, Chaikin Oscillator.
- In the Parameters tab, you can pick a color for the line, the MA method (exponential by default), and values for the fast and slow moving averages (3 and 10 by default). When you finish selecting your options, you can plot the indicator.
- You will now see the oscillator on the bottom of your chart. You can look for setups and start trading.
Key point: It takes only a few clicks to put the Chaikin Oscillator on your Forex charts.
How to use the Chaikin Oscillator indicator while you trade
The Chaikin Oscillator may generate bullish or bearish signals. You can detect them by looking for divergence between the oscillator and price.
- Bullish divergence is happening when you see higher lows in the oscillator, but lower lows in price. When the oscillator crosses the 0 line into positive territory, you can buy.
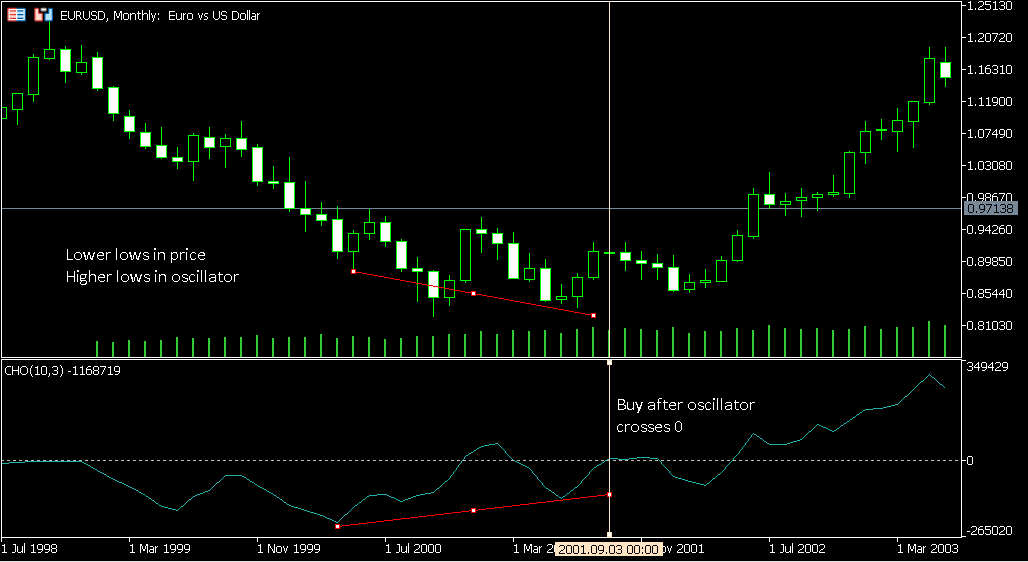
Notice in this example that price didn't immediately go up after crossing zero (and in fact, earlier, it crossed zero and dropped again). But if you waited for the third crossover, you'd have bought right into the new bullish trend.
There can be issues with false starts and delays when trading with this indicator, thus why waiting for confirmation is helpful.
- Bearish divergence is occurring when you see lower highs in the oscillator, but higher highs in price. When the oscillator crosses below the 0 line into negative territory, you can sell.
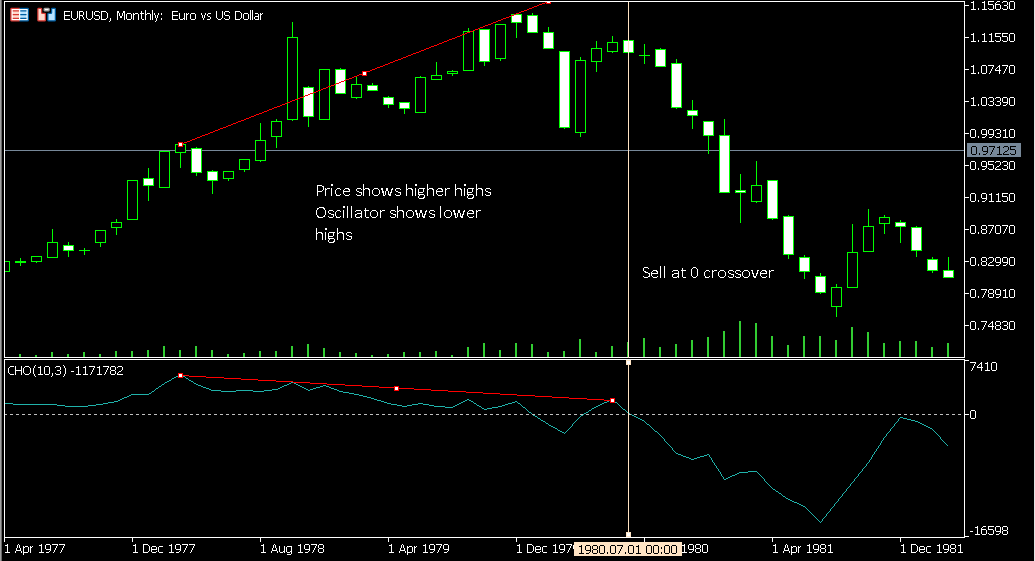
You can see this is an example of a cleaner trade. The price plunges instantly at the crossover.
Key point: By looking for divergence between the oscillator and price, you can identify bullish and bearish trade setups.
General tips for using the Chaikin Oscillator indicator
Now you have a pretty good idea how to use the Chaikin Oscillator. But there are a few important caveats of which you should be aware.
- Do not forget how indirectly the Chaikin Oscillator is connected with price. Keep in mind how the oscillator is calculated. You can think of it as a sandwich with price on the bottom and the oscillator on top, with layers of the ADL and moving averages in the middle. That means that you are not getting a direct interpretation of price from the oscillator. It really is commenting mostly on buying and selling power.
- Await confirmation. As we mentioned before, sometimes it is a good idea to wait for confirmation before you jump in on a trade. That way, you can avoid being faked out.
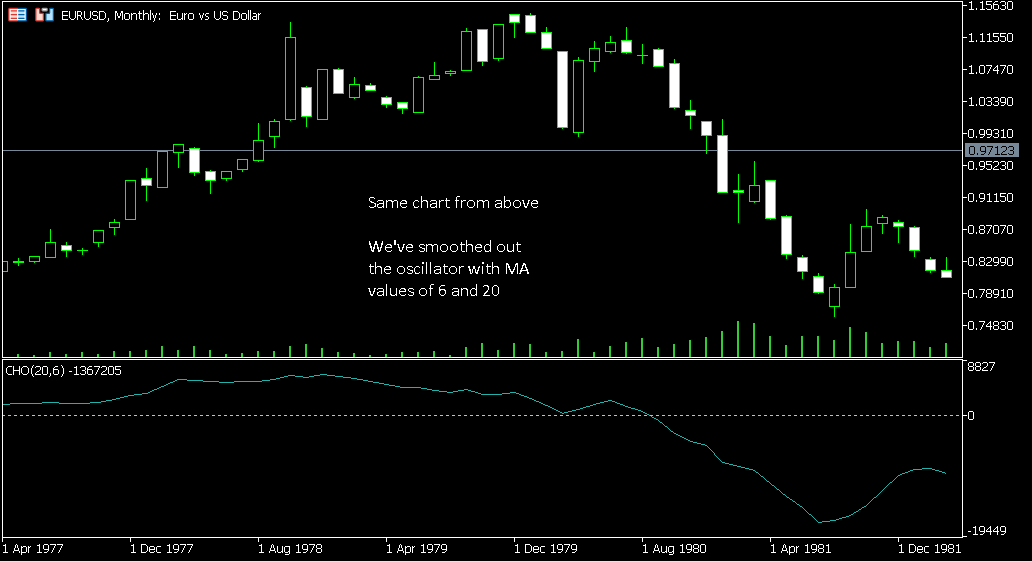
- Consider smoothing out the oscillator. You can do this by increasing the values of the moving averages, like you see in the image below. We have increased them from 3 and 10 to 6 and 20. The effect of doing this is that the oscillator does not cross 0 as frequently, eliminating some of the noise that may make trading with this indicator confusing.
- Use the oscillator in conjunction with other indicators. Another way to confirm a setup is to get confluence from another indicator or price action. If you have more than one signal telling you that a trend is reversing, you have a stronger setup.
- Test, test, test. You have a lot to figure out about how you are going to apply this indicator in your trading strategies in terms of timing your entries, choosing moving averages, etc. Backtests and demo tests will help you figure out what works.
Key point: When you are using the Chaikin Oscillator, it is important to keep its limitations in mind. But used correctly, it can be a great tool in your trading toolbox.
Conclusion
The Chaikin indicator can help you spot trend changes. Now you are familiar with the Chaikin Oscillator and how it can help you spot reversals via divergence with price. Smooth out the indicator by changing the moving averages or await confirmation before your entries to get the most effective use out of the Chaikin Oscillator.