What a clear and concise analysis! I am really impressed and a big thanks for sharing the analysis.

Elliott Wave Analysis by EWF
- Thread starter Elliottwave-Forecast
- Start date
- Watchers 30
You are using an out of date browser. It may not display this or other websites correctly.
You should upgrade or use an alternative browser.
You should upgrade or use an alternative browser.
🙂 you're welcome
Camber Energy has been making the rounds in the meme stock crowd the past few weeks, and for good reason. It has enjoyed a rally from 0.33 to recent peak 1.96. So what is behind the move? Lets take a look at the company:
"Camber Energy is leveraging our expertise and relationships to build a diversified organization with profitable business segments to increase stakeholder value. This balanced approach can expedite growth while reducing dependence on any particular division. Our aim is to acquire a majority interest in assets or entities with current revenue streams and realistic upside potential.
Within our Energy Division we intend to pursue opportunities recognizing the immediate dependence on current energy sources as well as the need to explore sustainable and profitable alternatives. Outside the Energy sector we intend to target opportunities with compelling metrics and scalability."
Most recently, they have replaced the CEO with new blood. Also, they have recently signed an exclusive agreement to provide proprietary and patented carbon capture technology for all of Canada. Now lets take a look at the charts:

Medium term term view from the August 2021 low. The stock has been on a steady rally since that low. Initially, it rallied into ((1)), with a pullback in ((2)) which bottomed on Sep 1. After that, a wave ((3)) rally has taken place. ((3)) found a peak on September 16 at 1.87. After that, the stock pulled back in consolidation and bottomed in ((4)) on September 20. From there, another some nesting has taken place in the blue (1) (2) and Red 1 and 2. and has broken higher today.
The RSI is presently diverging against the wave ((3)) peak. This means that the instrument is likely within the final 5th wave of the advance. As long as the divergence holds, the 5th wave view remains intact. After ((5)) peaks, a larger pullback to correct the cycle from August 20/20201 should take place. If the RSI erases the divergence, then the instrument can still be within a wave ((3)) advance, which would be more bullish and offer more extension higher.
With these meme stocks, it is important to expect extreme volatility, and to use correct position sizing.
Source: https://elliottwave-forecast.com/stock-market/camber-energy-inc-cei-extension-higher-likely/
Post automatically merged:
Camber Energy has been making the rounds in the meme stock crowd the past few weeks, and for good reason. It has enjoyed a rally from 0.33 to recent peak 1.96. So what is behind the move? Lets take a look at the company:
"Camber Energy is leveraging our expertise and relationships to build a diversified organization with profitable business segments to increase stakeholder value. This balanced approach can expedite growth while reducing dependence on any particular division. Our aim is to acquire a majority interest in assets or entities with current revenue streams and realistic upside potential.
Within our Energy Division we intend to pursue opportunities recognizing the immediate dependence on current energy sources as well as the need to explore sustainable and profitable alternatives. Outside the Energy sector we intend to target opportunities with compelling metrics and scalability."
Most recently, they have replaced the CEO with new blood. Also, they have recently signed an exclusive agreement to provide proprietary and patented carbon capture technology for all of Canada. Now lets take a look at the charts:
Camber Energy Elliottwave View:

Medium term term view from the August 2021 low. The stock has been on a steady rally since that low. Initially, it rallied into ((1)), with a pullback in ((2)) which bottomed on Sep 1. After that, a wave ((3)) rally has taken place. ((3)) found a peak on September 16 at 1.87. After that, the stock pulled back in consolidation and bottomed in ((4)) on September 20. From there, another some nesting has taken place in the blue (1) (2) and Red 1 and 2. and has broken higher today.
The RSI is presently diverging against the wave ((3)) peak. This means that the instrument is likely within the final 5th wave of the advance. As long as the divergence holds, the 5th wave view remains intact. After ((5)) peaks, a larger pullback to correct the cycle from August 20/20201 should take place. If the RSI erases the divergence, then the instrument can still be within a wave ((3)) advance, which would be more bullish and offer more extension higher.
With these meme stocks, it is important to expect extreme volatility, and to use correct position sizing.
Source: https://elliottwave-forecast.com/stock-market/camber-energy-inc-cei-extension-higher-likely/
Since the crash of March 2020, all stocks have tried to recover what they lost and JNJ was no exception. Johnson & Johnson did not only recover the lost, but it also reached historic highs. In those days, we were looking for an entry in 155.33 – 156.93 area to reach a target above $176.00 dollars.
 In this old chart, JNJ had a strong recovery in 3 swings. The wave ((3)) had its highest point at 173.69 rejected by the market in a double correction structure and overlapped the wave ((1)) zone to end the wave ((4)). We were expecting one swing higher to complete wave ((5)) as an Ending Diagonal. (If you want to learn more about Elliott Wave Theory, please follow this link: Elliott Wave Theory).

The share price continued to rise until reach 172.79 which we called wave (1) doing a Leading Diagonal (LD) structure. Before that in April, wave 2 in red drop to our minimum entry at 156.93 and bounce to complete the LD. From there, we have a clear correction as a zig zag wave (2) missing our ideal second entry for a few cents and the possible target to complete wave ((5)) came in 178.97 – 187.48 area.

We were calling wave (3) of ((5)) at 179.92. That meant we achieved our 178.97 minimun target from 156.93 gave us a 14.04% return and we were expecting one more swing high to complete 5 waves up and the daily ending diagonal with wave ((5)).

JNJ missed a new high and the ending diagonal with lesser degree structure as 5-3-5-3-5 have to be changed to 3-3-3-3-3 as you can see in the update. The rejection has been strong enough to give us the conviction that wave II is in progress and wave I finished at 179.92.
In first instance, we will consider an ((A)), ((B)), ((C)) zigzag correction to complete wave II. The wave ((A)) is taking the form of an impulse. We need one more wave that breaks 162.17 to reaffirm the idea of the impulse. Then we should see a corrective bounce as wave ((B)) and then continue falling to complete ((C)). At the moment, wave II should find support in the 144.72 - 136.37 ideal area where it would give us new buying opportunities again.
Source: https://elliottwave-forecast.com/stock-market/jnj-ending-diagonal-completed/
JNJ Old Daily Chart
 In this old chart, JNJ had a strong recovery in 3 swings. The wave ((3)) had its highest point at 173.69 rejected by the market in a double correction structure and overlapped the wave ((1)) zone to end the wave ((4)). We were expecting one swing higher to complete wave ((5)) as an Ending Diagonal. (If you want to learn more about Elliott Wave Theory, please follow this link: Elliott Wave Theory).
JNJ Old Daily Chart

The share price continued to rise until reach 172.79 which we called wave (1) doing a Leading Diagonal (LD) structure. Before that in April, wave 2 in red drop to our minimum entry at 156.93 and bounce to complete the LD. From there, we have a clear correction as a zig zag wave (2) missing our ideal second entry for a few cents and the possible target to complete wave ((5)) came in 178.97 – 187.48 area.
JNJ Old Daily Chart

We were calling wave (3) of ((5)) at 179.92. That meant we achieved our 178.97 minimun target from 156.93 gave us a 14.04% return and we were expecting one more swing high to complete 5 waves up and the daily ending diagonal with wave ((5)).
JNJ Daily Chart

JNJ missed a new high and the ending diagonal with lesser degree structure as 5-3-5-3-5 have to be changed to 3-3-3-3-3 as you can see in the update. The rejection has been strong enough to give us the conviction that wave II is in progress and wave I finished at 179.92.
In first instance, we will consider an ((A)), ((B)), ((C)) zigzag correction to complete wave II. The wave ((A)) is taking the form of an impulse. We need one more wave that breaks 162.17 to reaffirm the idea of the impulse. Then we should see a corrective bounce as wave ((B)) and then continue falling to complete ((C)). At the moment, wave II should find support in the 144.72 - 136.37 ideal area where it would give us new buying opportunities again.
Source: https://elliottwave-forecast.com/stock-market/jnj-ending-diagonal-completed/
Hello fellow traders. In this technical blog we’re going to take a quick look at the Elliott Wave charts of Bitcoin ($BTCUSD ) published in members area of the Elliottwave-Forecast . As our members know, we have had a lot of good buying opportunities BTCUSD while it was trading within the cycle from the 2018 low ( 3127.5). Recently Bitcoin has given us correction of the cycle from the 28707.5 low. We were calling the decline in the Cryptocurrency. In further text we’re going to explain the forecast and Elliott Wave Pattern and Forecast.
Reminder: You can learn more about Elliott Wave Patterns at our Free Elliott Wave Educational Web Page.


Keep in mind that market is dynamic and presented view could have changed in the mean time. You can check most recent charts in the membership area of the site. Best instruments to trade are those having incomplete bullish or bearish swings sequences. We put them in Sequence Report and best among them are shown in the Live Trading Room.

Elliott Wave Forecast
Source: https://elliottwave-forecast.com/elliottwave/bitcoin-btcusd-calling-decline/
Bitcoin ( $BTCUSD ) 4 Hour Elliott Wave Analysis 9.15.2021
As we can see on the chart below , Bitcoin ended 5 waves up in the cycle from the 28707.5 low. BTUCSD giving us now correction against that low. Current pull back looks incomplete at the moment and we believe cryptocurrency should give us another leg down- (Y) blue as soon as (X) blue connector completes.Reminder: You can learn more about Elliott Wave Patterns at our Free Elliott Wave Educational Web Page.

Bitcoin ( $BTCUSD ) 1 Hour Elliott Wave Analysis 9.15.2021
Cryptocurrency is giving us short term recovery against the 52963.5 peak. (X) connector still looks incomplete. We expect to see more short term strength within cycle from the September 13th low. We expect the price to reach approximately 48094-49188 before turn lower takes place. Although decline was expected, overall view is bullish in BTCUSD, consequently we recommended members to avoid selling it and rather wait for extremes to be reached before buying it again.
Bitcoin ( $BTCUSD ) 1 Hour Elliott Wave Analysis 9.15.2021
We got more upside within the cycle from the Sep 13.low which eventually completed as 5 waves rally as we expected. Now we are calling (X) blue connector completed at the 48846 high. We would like to see further separation lower against that level. The price should make break below (W) blue low -42903 to confirm (Y) leg is in progress. We would like to be buyers again once the price reaches the extreme zone from the 52891.19 peak.
Bitcoin ( $BTCUSD ) 1 Hour Elliott Wave Analysis 9.15.2021
The price held below 48846 high and made further separation down as we expected. Eventually the price broke the 42903 low and confirmed next leg down is in progress. Crypto is now bearish against the 48864 in near term. We would like to see at least another push down to complete cycle from the peak.Keep in mind that market is dynamic and presented view could have changed in the mean time. You can check most recent charts in the membership area of the site. Best instruments to trade are those having incomplete bullish or bearish swings sequences. We put them in Sequence Report and best among them are shown in the Live Trading Room.

Elliott Wave Forecast
Source: https://elliottwave-forecast.com/elliottwave/bitcoin-btcusd-calling-decline/
Royal Gold is an ETF with a higher degree correlation with Gold and might show a path for an expected move higher in Gold into the $2700.00 area. The Symbol shows five swings or waves since the all-time lows, which is a bullish structure. In the Elliott wave Theory, every time five waves or swings appear in the market, the right side is clear. The right side is the one in alignment with the direction of the five swings. Royal Gold can be labeled as five waves off the lows or a nest, which is a bullish sequence. A nest is a series of wave 1-2 and will always anticipate a huge move in the direction of the five swings.
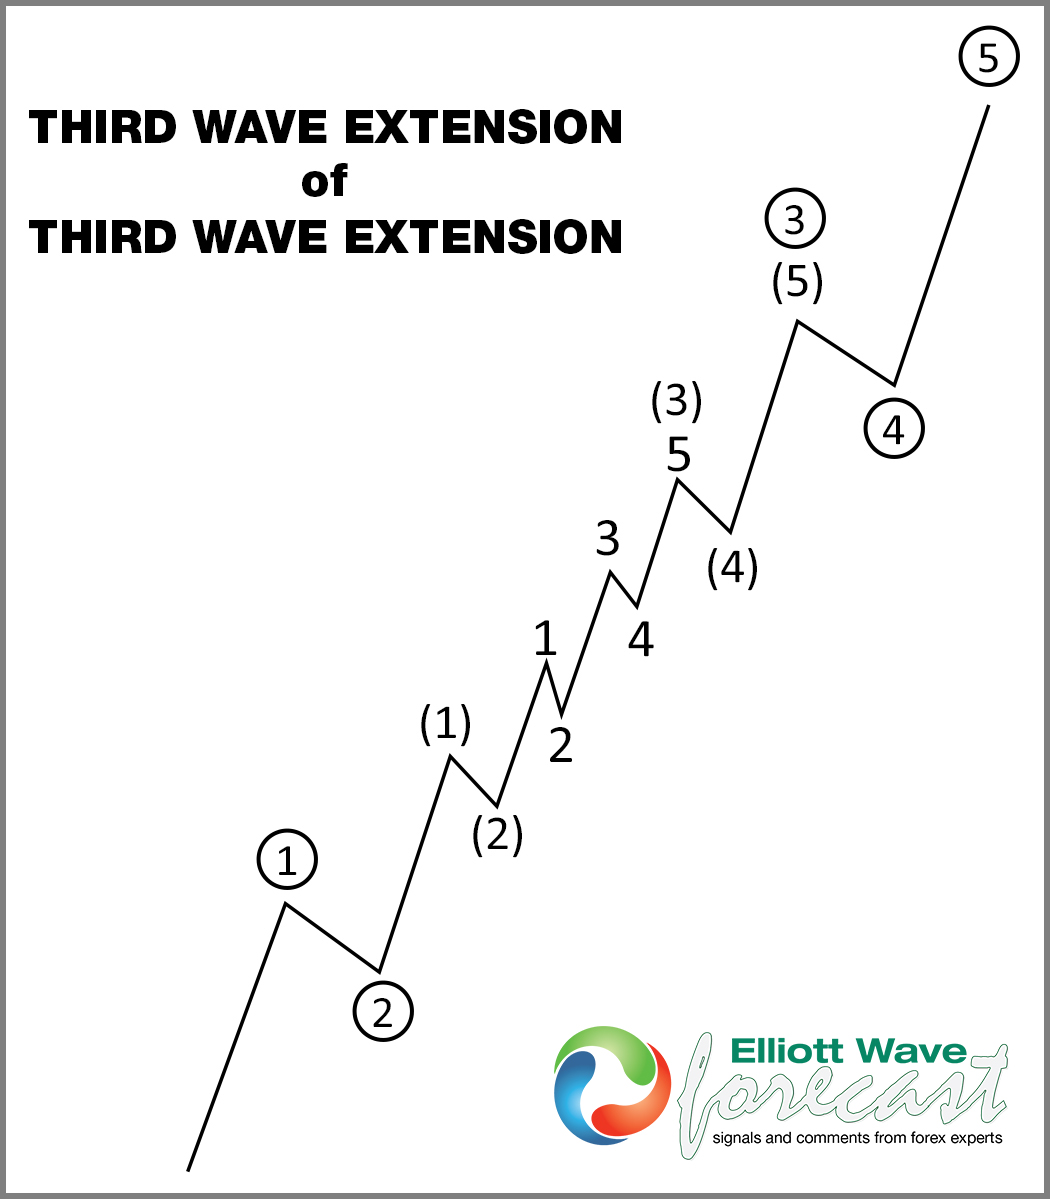
The following chart is a graphical depiction of the nest. We can see the series of I-II until the extension of wave III happens. Knowing when to locate and catch the break in a nest is one of the most profitable trades for Elliott wave traders.

The following chart shows the Grand Super Cycle degree in Royal Gold, which we have labeled as a nest in three different degrees.

The first degree is (I) which ended in 2012 and corrected until 2016 when wave (II)) ended and wave (III) started. Then, come to wave I-II and now wave ((1)) and ((2)), which is wave ((2)) of wave III of (III). The key now is zooming in to locate the area to buy wave ((2)) to ride a huge move with a target at $201.00-$245.00 area.
The following chart shows the Daily chart and the proposed ABC lower into the Blue Box area. The symbol ended the cycle since 2020 lows and now is developing the classic zigzag corrective pullback. It shows five waves up from wave wave II and three waves (A)-(B)-(C) pullback, before the trend renews in the direction of the previous five waves.

If the most aggressive move ends happening, we might have a huge movement happening in Gold, which will make the Metal reach our long-waited target area at $2700.00-$3000.00. We at EWF always look for correlations to be able to locate the hedging area and consequently the most likely path. Royal Gold shows the timing and possible path for Gold, a unique opportunity into the end of the Year 2021.
Source: https://elliottwave-forecast.com/vi...he-symbol-might-be-showing-the-path-for-gold/
The following chart is a graphical depiction of the nest. We can see the series of I-II until the extension of wave III happens. Knowing when to locate and catch the break in a nest is one of the most profitable trades for Elliott wave traders.
The following chart shows the Grand Super Cycle degree in Royal Gold, which we have labeled as a nest in three different degrees.
Royal Gold (RGLD) Monthly Elliott Wave
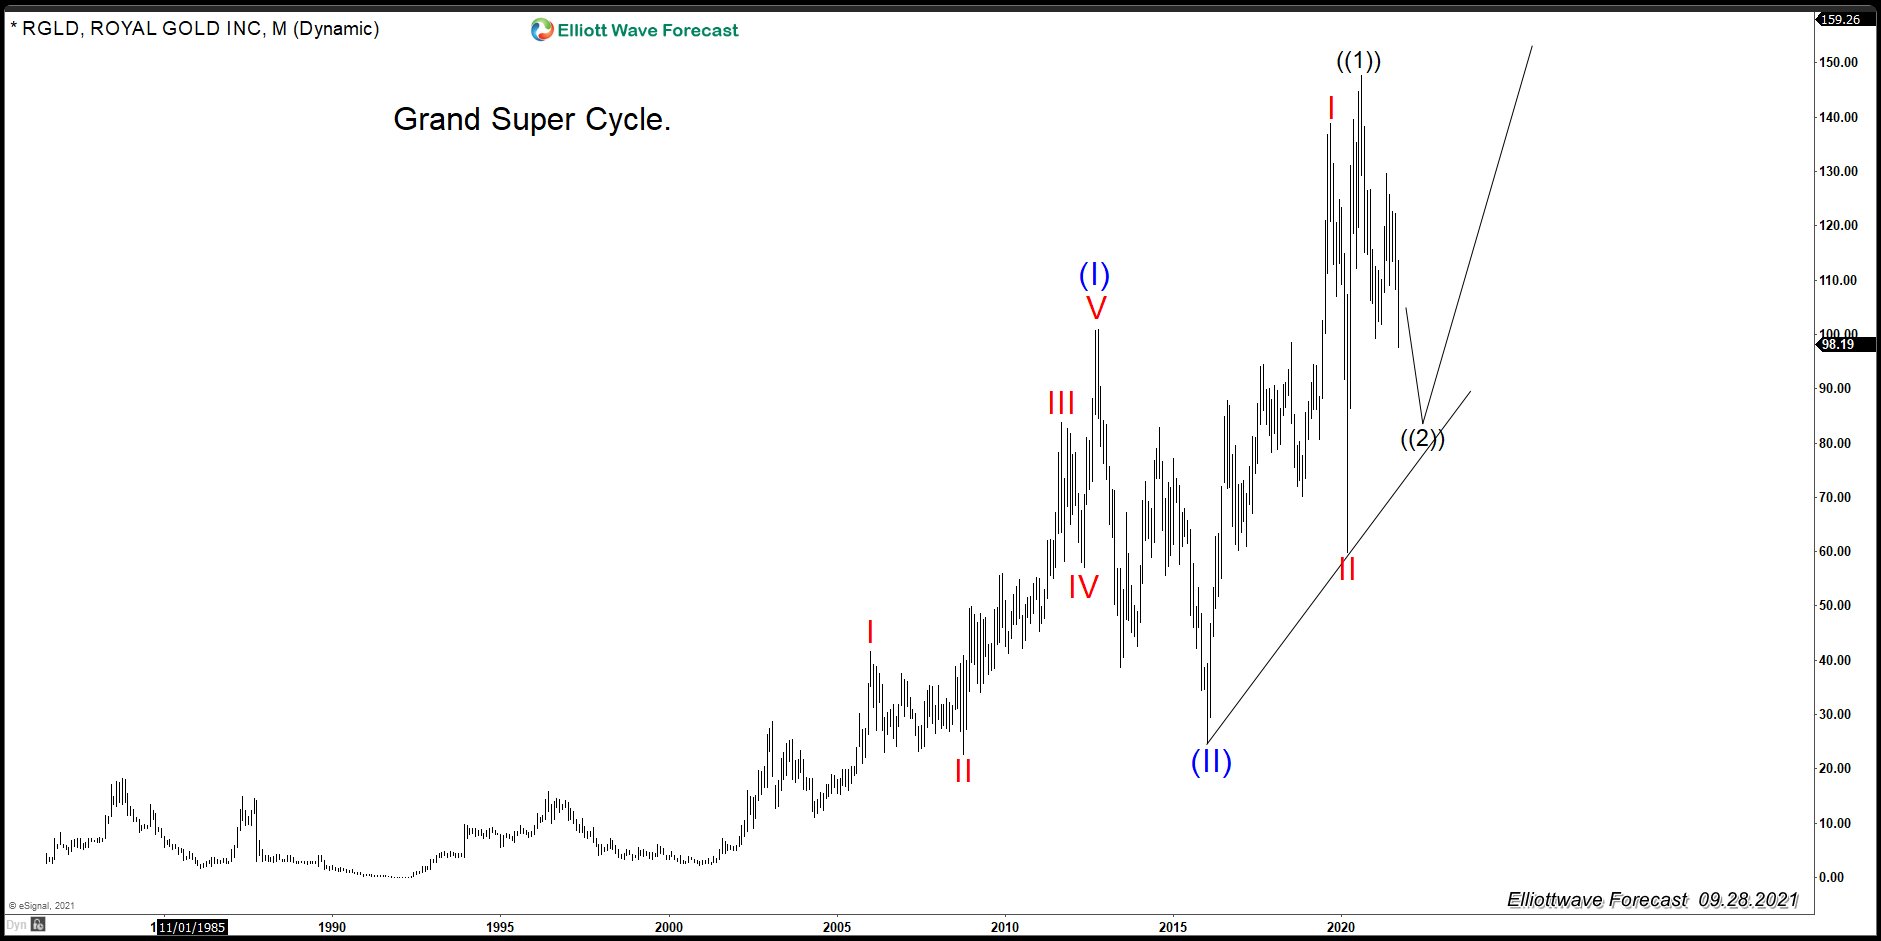
The first degree is (I) which ended in 2012 and corrected until 2016 when wave (II)) ended and wave (III) started. Then, come to wave I-II and now wave ((1)) and ((2)), which is wave ((2)) of wave III of (III). The key now is zooming in to locate the area to buy wave ((2)) to ride a huge move with a target at $201.00-$245.00 area.
The following chart shows the Daily chart and the proposed ABC lower into the Blue Box area. The symbol ended the cycle since 2020 lows and now is developing the classic zigzag corrective pullback. It shows five waves up from wave wave II and three waves (A)-(B)-(C) pullback, before the trend renews in the direction of the previous five waves.
Royal Gold (RGLD) Daily Elliott Wave Chart
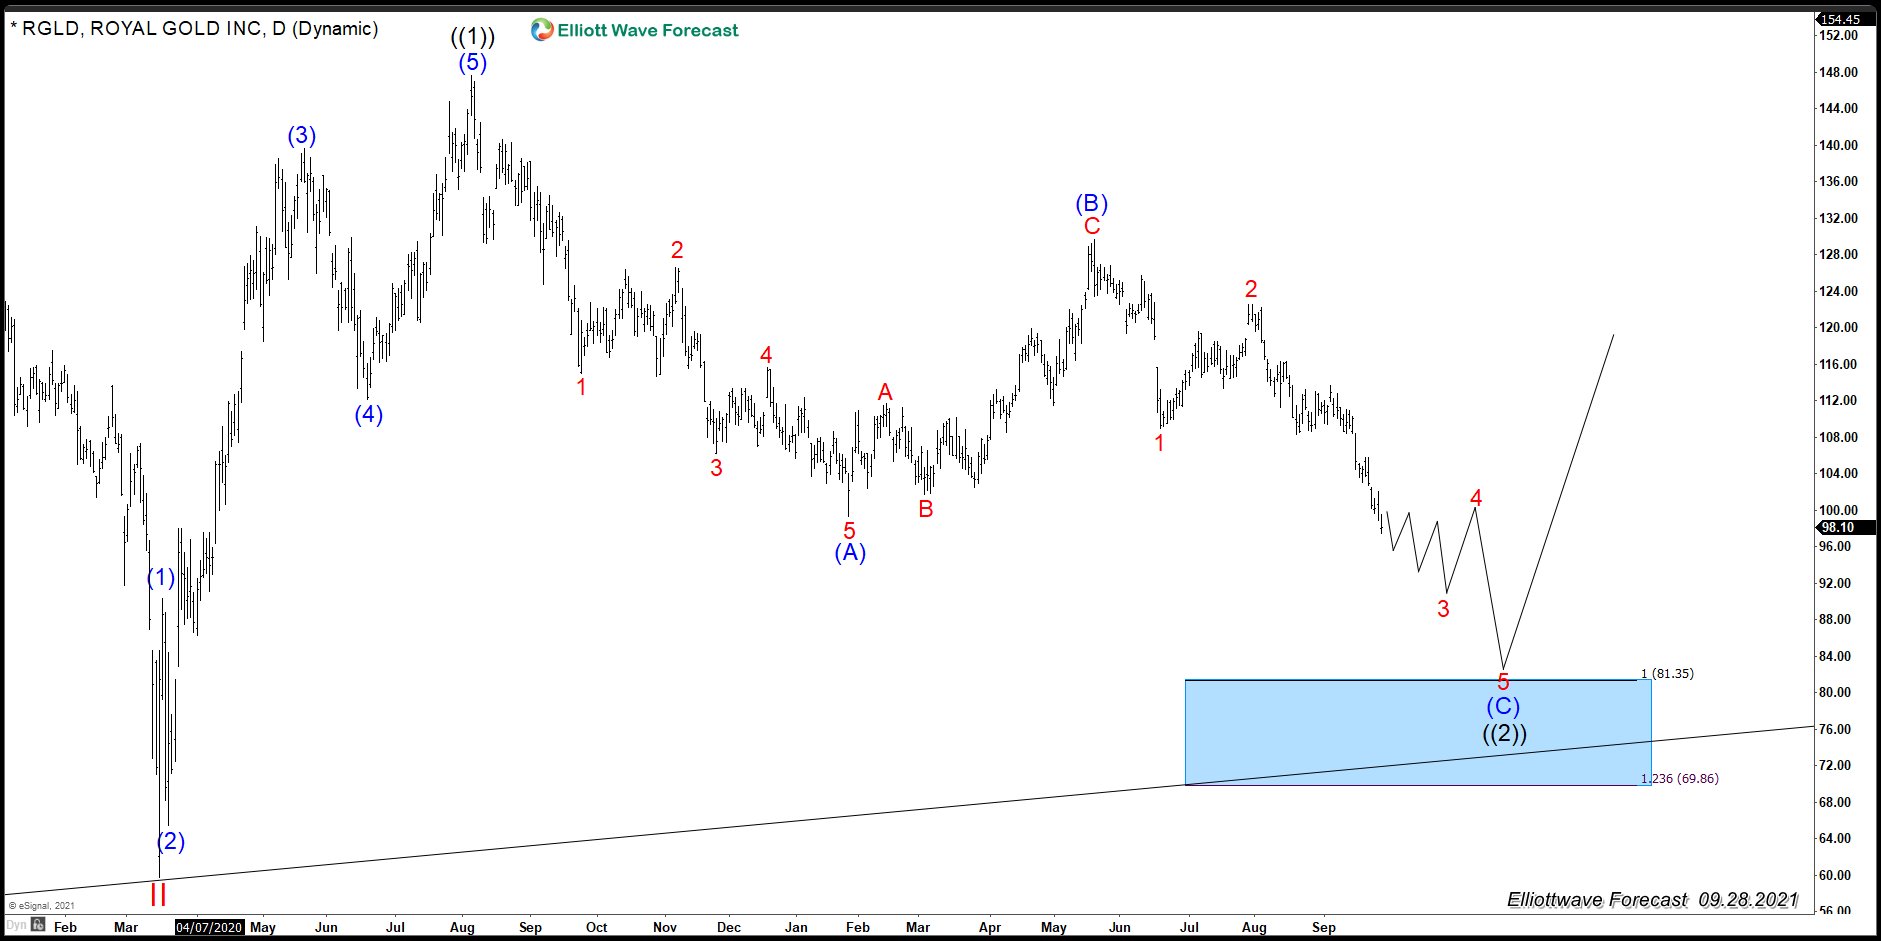
If the most aggressive move ends happening, we might have a huge movement happening in Gold, which will make the Metal reach our long-waited target area at $2700.00-$3000.00. We at EWF always look for correlations to be able to locate the hedging area and consequently the most likely path. Royal Gold shows the timing and possible path for Gold, a unique opportunity into the end of the Year 2021.
Source: https://elliottwave-forecast.com/vi...he-symbol-might-be-showing-the-path-for-gold/
LUV (Southwest Airlines) shows a very constructive price action since the all-time lows. We can see a very nice impulse or five waves into the peak in 2017. The Elliott Wave Theory's main message is that the trend advances in five waves and then a pullback in three waves. The following chart is a representation of the basic pattern in the Elliott wave Theory. We can see a clear five waves in which each subdivision with the trend is in five waves and each pullback is in three waves.

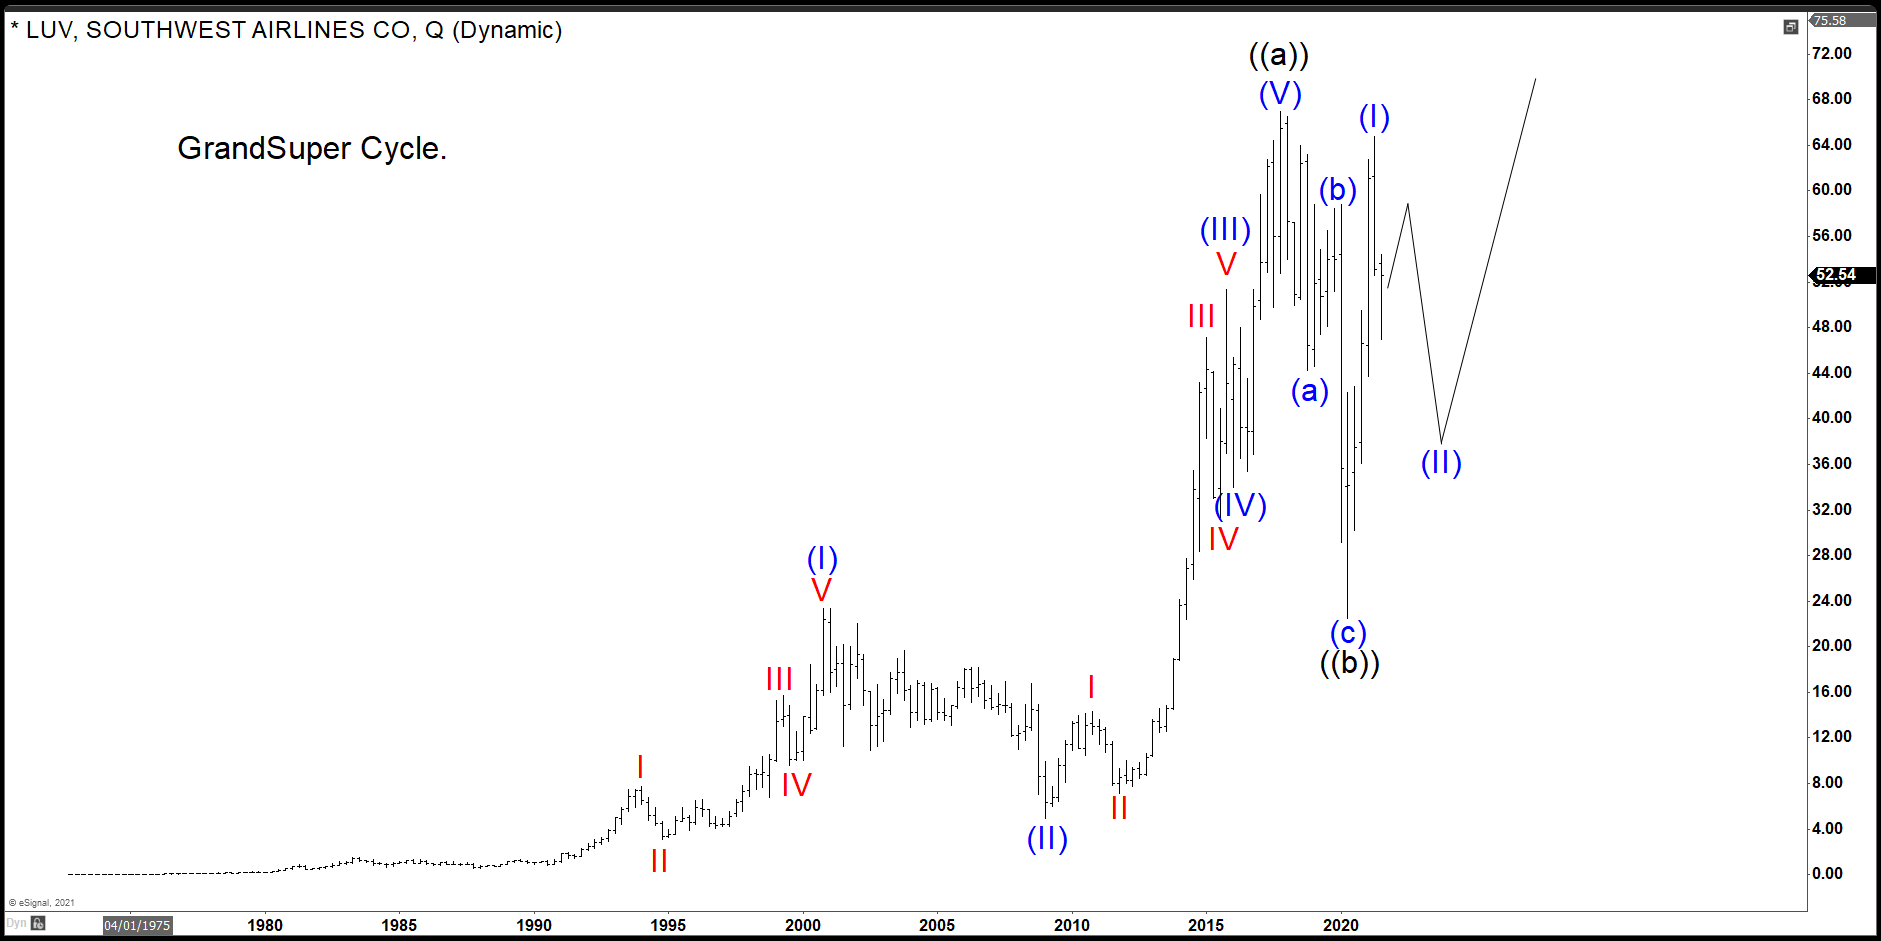
The following chart shows LUV (Southwest Airlines) Grand Super Cycle advance which is a very clear impulse or five waves advance. The five waves are represented in the blue degree, and the peak is either wave ((a))/ ((I)), and the three waves pullback might have already ended in wave ((b)) during the Covid decline. The correction can be completed and might start the next leg higher.

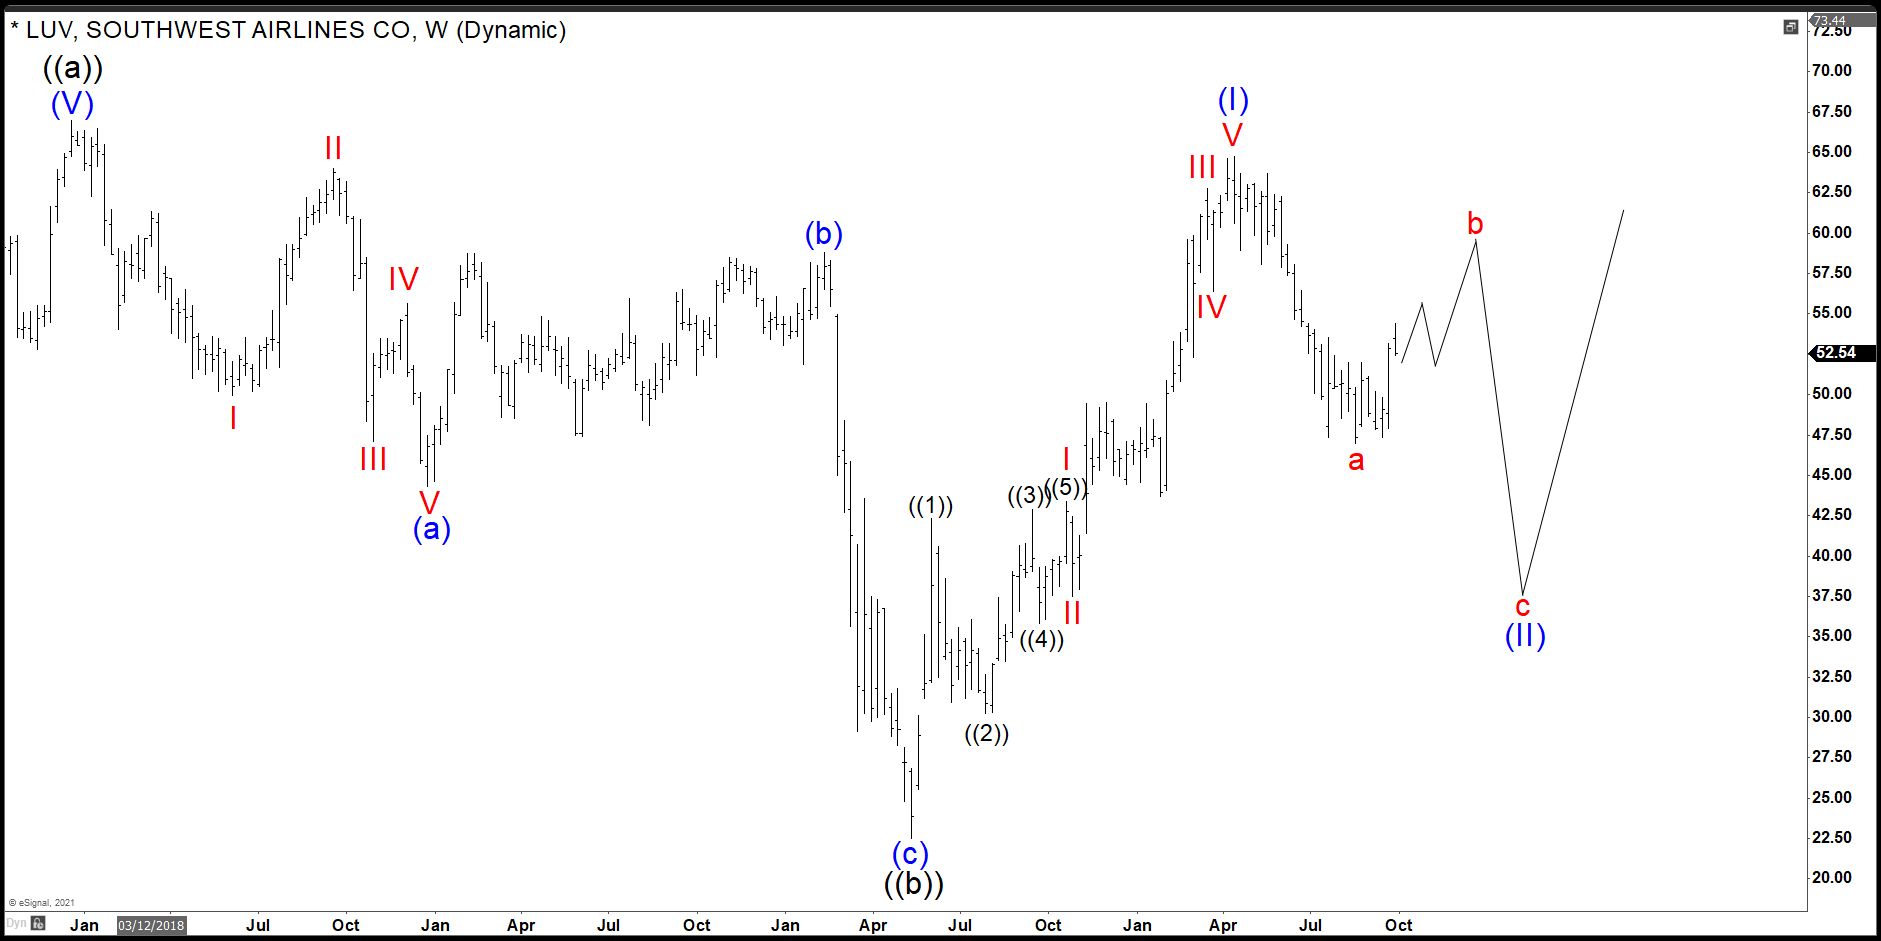
Downgrading the time frame, we can see the reaction off the lows from 05.18.2020, which is in five waves. From the peak on 04.12.2021, the price action seems impulsive which ended wave a in red. Now we are trading higher in wave b in red. We are expecting wave c lower into next year. The three waves pullback should represent a unique opportunity to buy the trend into all-time highs.

We can see how the Elliott wave pattern is repeating in the Grand Super Cycle and the Super Cycle trend provides a very encouraging price action for the buyers. We have a very simple recommendation to wait for the stock to drop into a long-term equal leg area before buying into all-time highs.
Source: https://elliottwave-forecast.com/vi...symbol-showing-a-nice-elliott-wave-structure/
Silver Miners ETF (SIL) has been consolidating since bottoming on January 2016 low at 14.94. Presently, it has reached 100% fibonacci extension from August 2020 peak at $26.2 - 35.3. This means the instrument can soon see support and rally in 3 waves at least if not resuming higher. Let's take a look at the Elliott Wave chart below:

The rally from January 2016 low is unfolding as a possible next where wave I ended at 54.24 and wave II ended at 16. The ETF has rallied higher in wave III with internal subdivision as another impulse in lesser degree. Up from wave II, wave ((1)) ended at 52.87 and pullback in wave ((2)) remains in progress. While pullback remains above March 2020 low (15.72), it should soon see another push higher.

SIL is correcting cycle from March 2020 low as a double zigzag Elliott Wave structure. Rally from March 2020 low ended wave ((1)) at 52.87 as an impulse. Pullback in wave ((2)) has reached the 100% fibonacci extension towards 26.64 - 35.55 but short term still can see a bit lower. As far as March 2020 low pivot at 17.01 remains intact, expect pullback to soon find support at blue box area for more upside.
Source: https://elliottwave-forecast.com/stock-market/silver-miners-etf-sil-has-reached-support-area/
The following chart shows LUV (Southwest Airlines) Grand Super Cycle advance which is a very clear impulse or five waves advance. The five waves are represented in the blue degree, and the peak is either wave ((a))/ ((I)), and the three waves pullback might have already ended in wave ((b)) during the Covid decline. The correction can be completed and might start the next leg higher.
LUV Quarterly Elliott Wave Chart
Downgrading the time frame, we can see the reaction off the lows from 05.18.2020, which is in five waves. From the peak on 04.12.2021, the price action seems impulsive which ended wave a in red. Now we are trading higher in wave b in red. We are expecting wave c lower into next year. The three waves pullback should represent a unique opportunity to buy the trend into all-time highs.
LUV Weekly Elliott Wave Chart
We can see how the Elliott wave pattern is repeating in the Grand Super Cycle and the Super Cycle trend provides a very encouraging price action for the buyers. We have a very simple recommendation to wait for the stock to drop into a long-term equal leg area before buying into all-time highs.
Source: https://elliottwave-forecast.com/vi...symbol-showing-a-nice-elliott-wave-structure/
Post automatically merged:
Silver Miners ETF (SIL) has been consolidating since bottoming on January 2016 low at 14.94. Presently, it has reached 100% fibonacci extension from August 2020 peak at $26.2 - 35.3. This means the instrument can soon see support and rally in 3 waves at least if not resuming higher. Let's take a look at the Elliott Wave chart below:
SIL Monthly Elliott Wave Chart
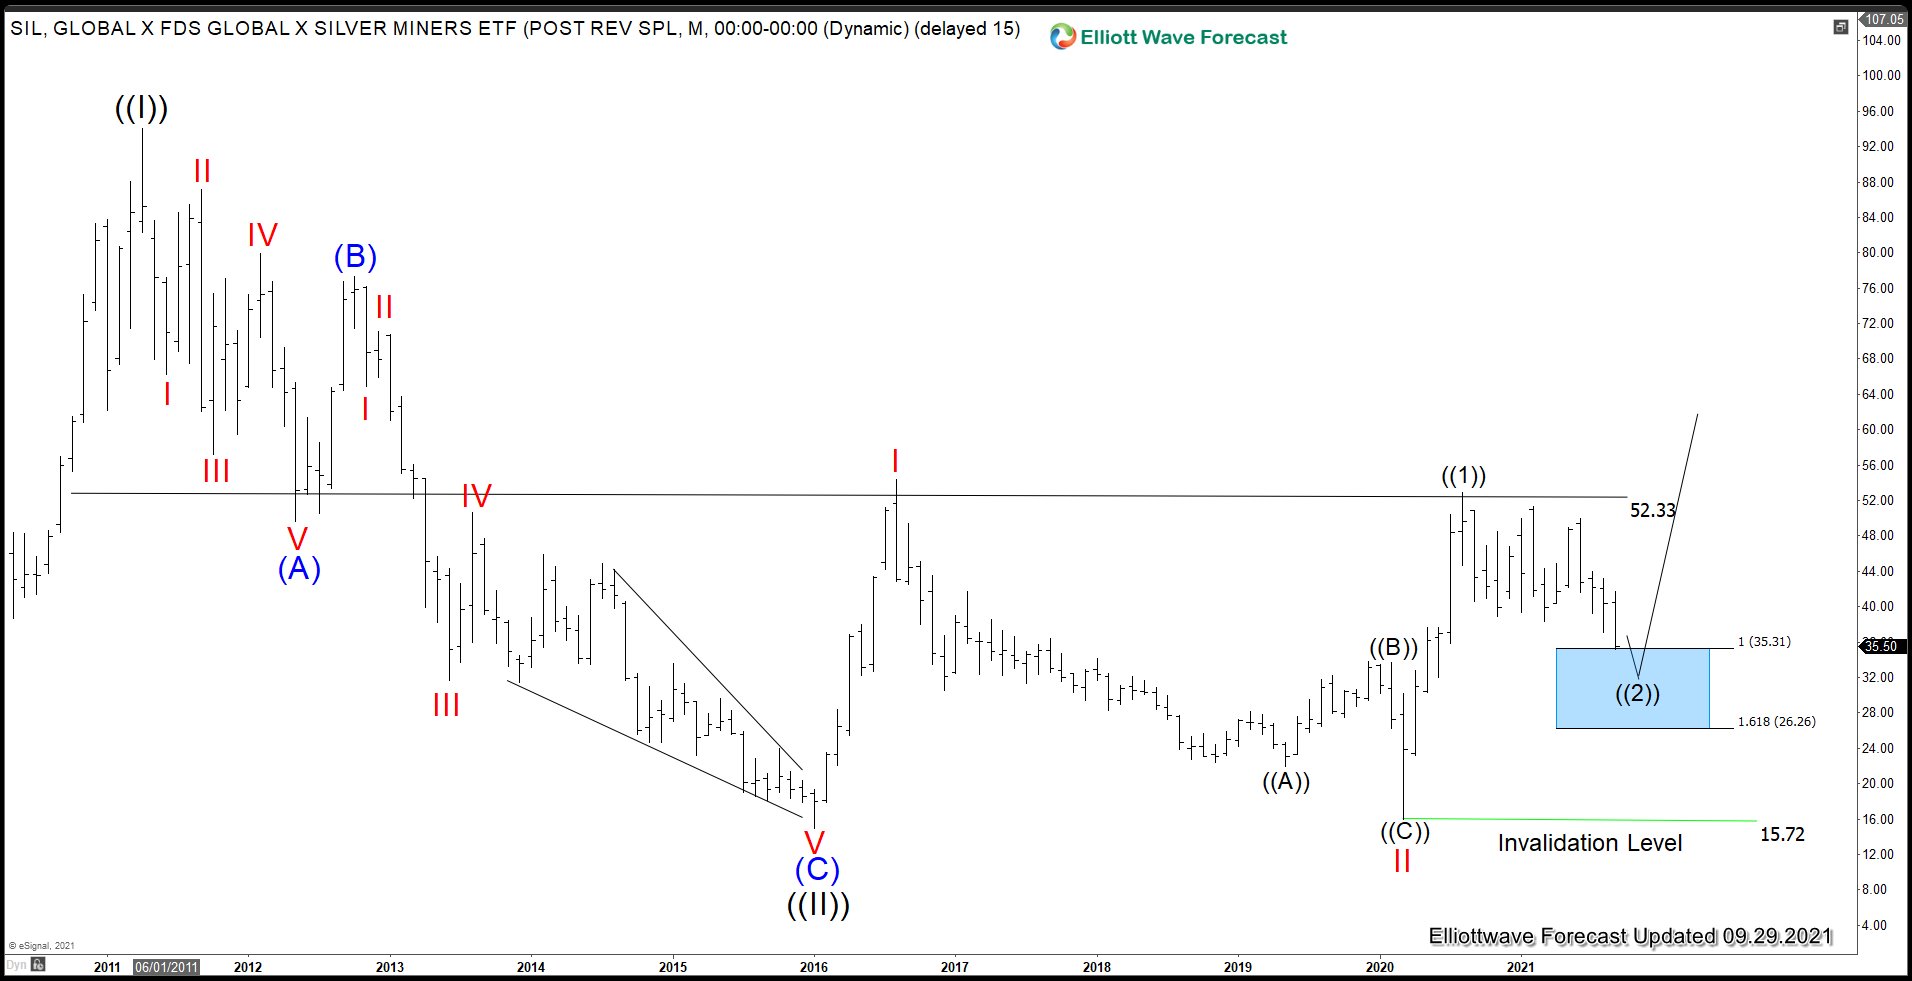
The rally from January 2016 low is unfolding as a possible next where wave I ended at 54.24 and wave II ended at 16. The ETF has rallied higher in wave III with internal subdivision as another impulse in lesser degree. Up from wave II, wave ((1)) ended at 52.87 and pullback in wave ((2)) remains in progress. While pullback remains above March 2020 low (15.72), it should soon see another push higher.
SIL Daily Elliott Wave Chart
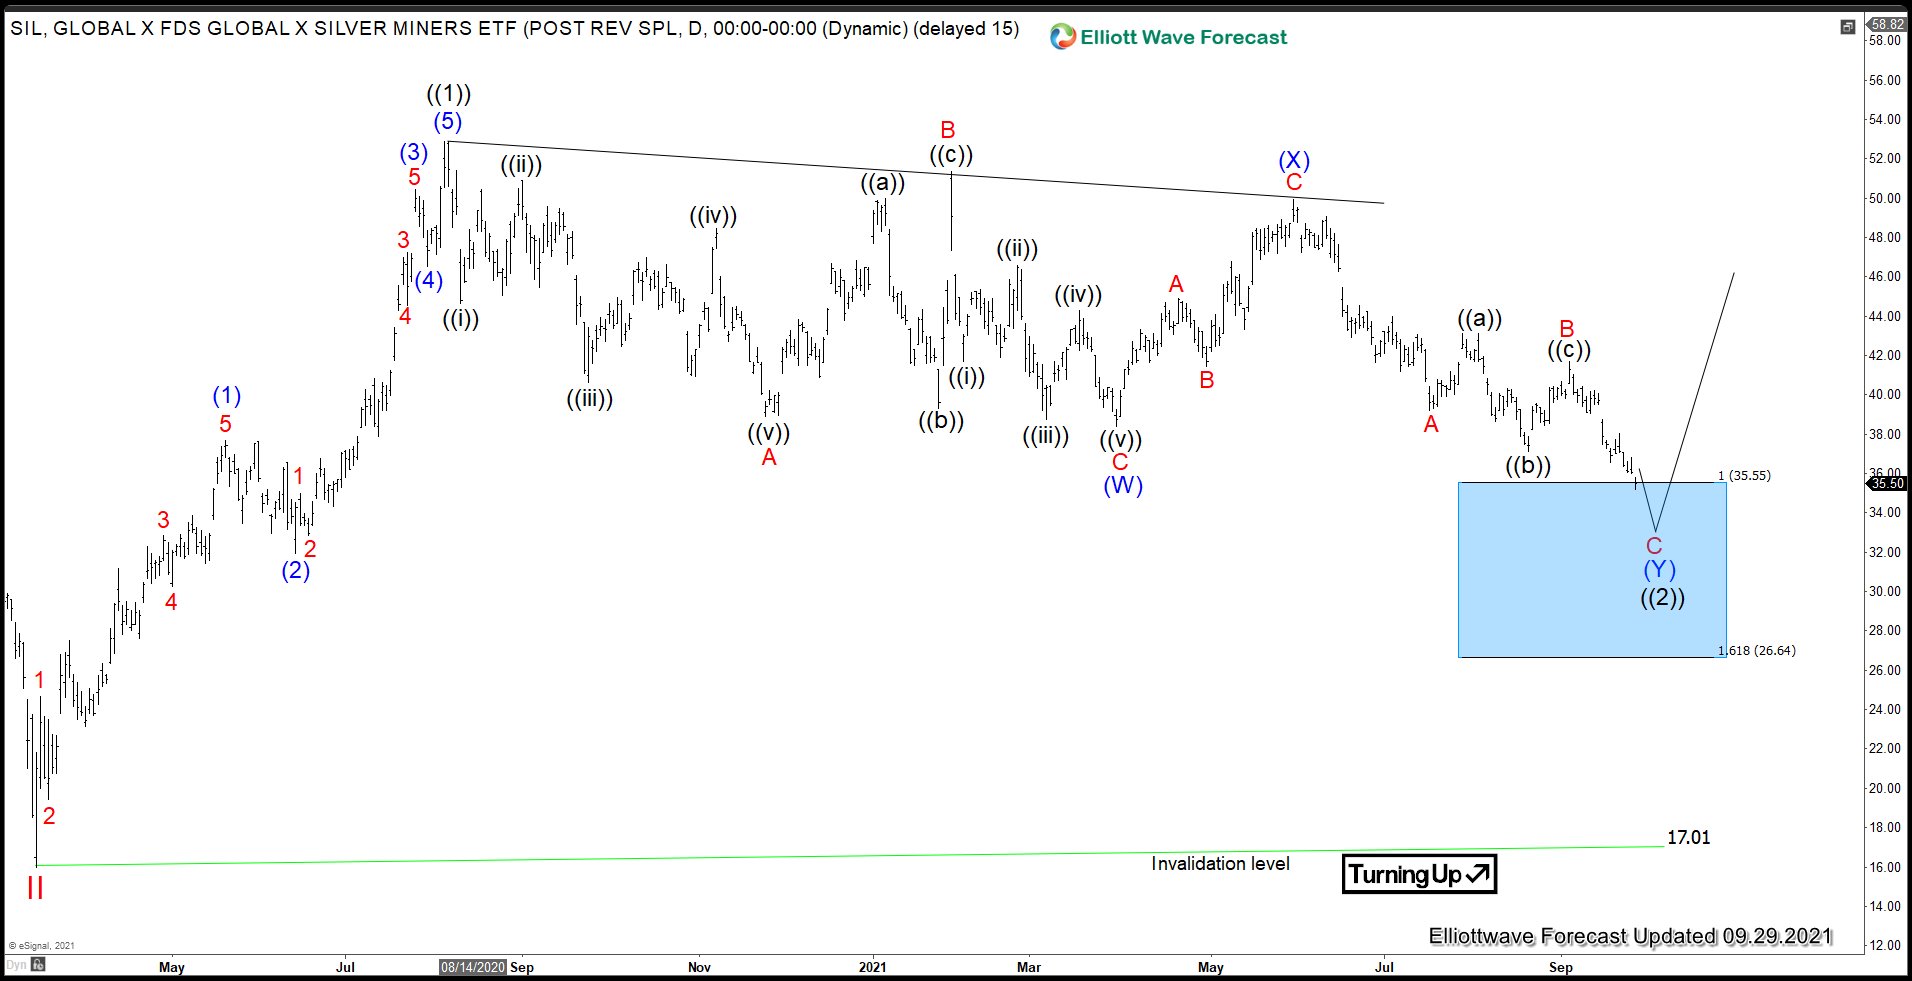
SIL is correcting cycle from March 2020 low as a double zigzag Elliott Wave structure. Rally from March 2020 low ended wave ((1)) at 52.87 as an impulse. Pullback in wave ((2)) has reached the 100% fibonacci extension towards 26.64 - 35.55 but short term still can see a bit lower. As far as March 2020 low pivot at 17.01 remains intact, expect pullback to soon find support at blue box area for more upside.
Source: https://elliottwave-forecast.com/stock-market/silver-miners-etf-sil-has-reached-support-area/
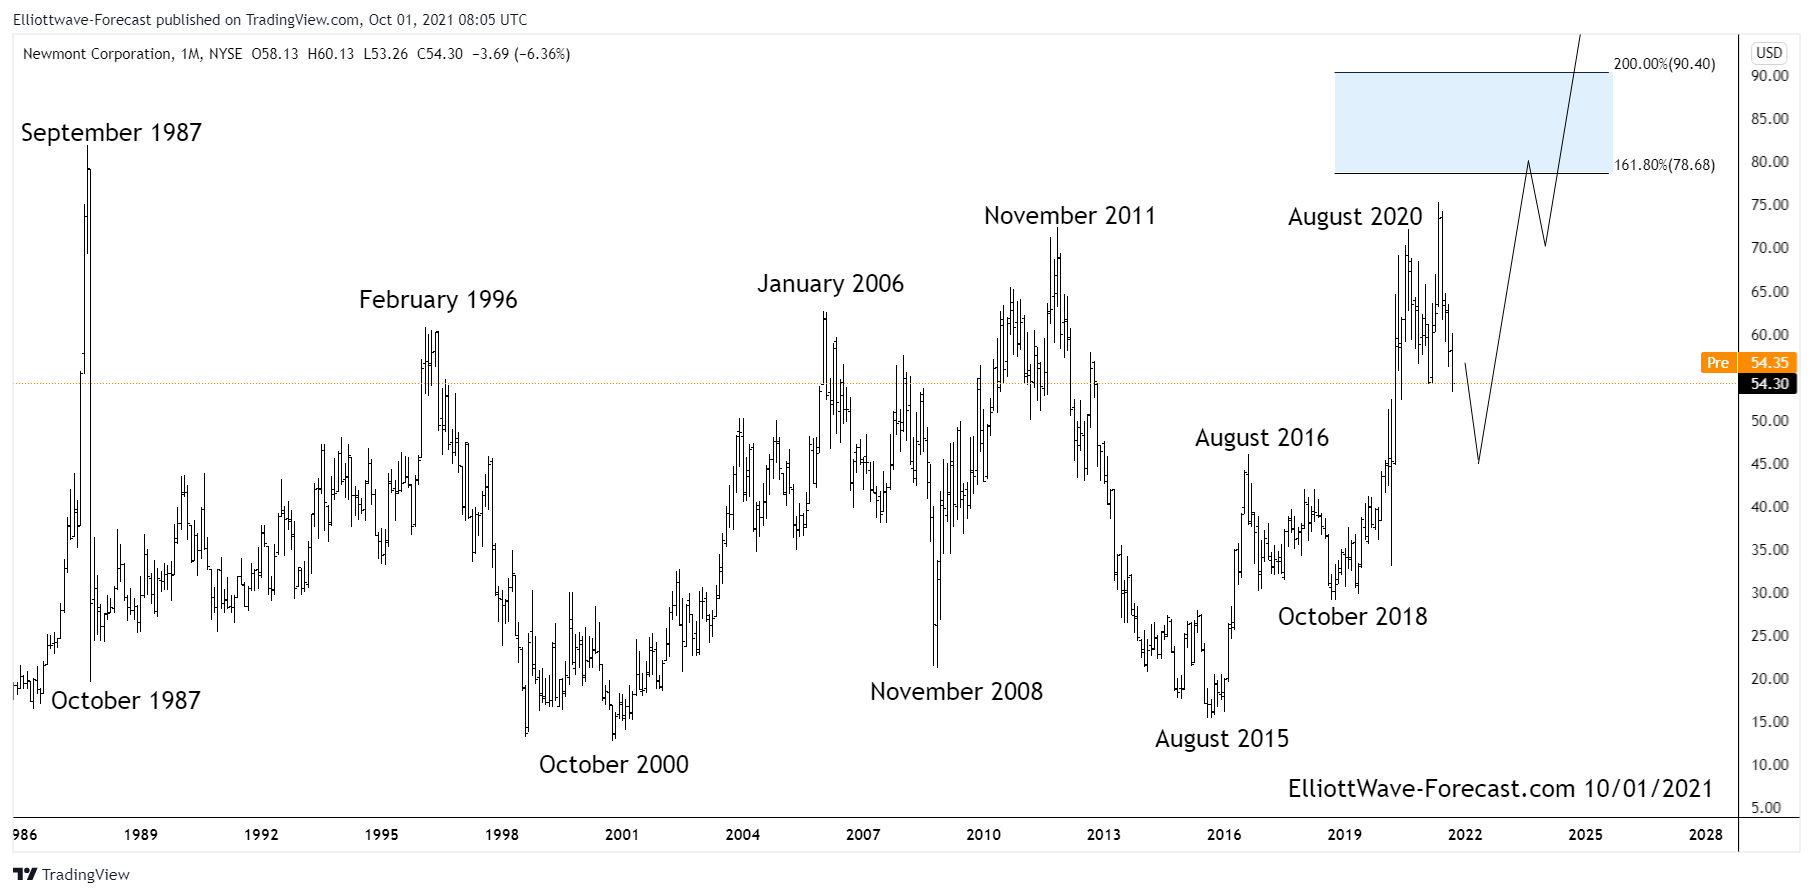
$NEM Longer Term Bullish Cycles of The Newmont Corporation
Firstly from the beginning of price data from back in the 1970’s not shown on the chart, the price trend was obviously up. It ended that bullish cycle in September 1987 and pulled back really hard during the October 1987 crash. Price stabilized from there several years into the 1996 highs before another cycle lower into the October 2000 lows. That swing lower finished a correction of the cycle up from the all time lows. Those lows are still intact. The bounce that developed from the October 2000 lows into the January 2006 highs appears to have been an Elliott Wave impulse of five waves.
Secondly the three large swings from the January 2006 highs down to November 2008 lows appears to be the beginning of a large flat 3-3-5 structure. From the November 2008 lows back up to the November 2011 highs was likely a zig-zag structure by itself. The decline from the November 2011 highs down to the August 2015 lows appeared to be five waves. This completed a 3-3-5 flat structure. Of note, the lows from October 2000 remained intact again suggesting the August 2015 lows finished correcting that cycle up from there.
The analysis continues below the chart.

Thirdly in conclusion the aforementioned lows from August 2015 & now as well as the October 2018 lows should remain intact during future pullbacks for a long time to come. The bounce from those lows definitely ended the cycle lower. The bounce to the August 2016 high appeared to be five waves up. This was similar to the October 2000 to January 2006 bounce although of smaller degree. The pullback lower from the August 2016 high to the October 2018 low was obviously three swings. Price has bounced real hard from there suggesting it is within a larger degree wave three. Pullbacks should remain well above the October 2018 cycle lows. While doing that, the possibility remains that current cycle will take out the old highs from September 1987 in the not too distant future.
Source: https://elliottwave-forecast.com/st...rm-bullish-cycles-of-the-newmont-corporation/
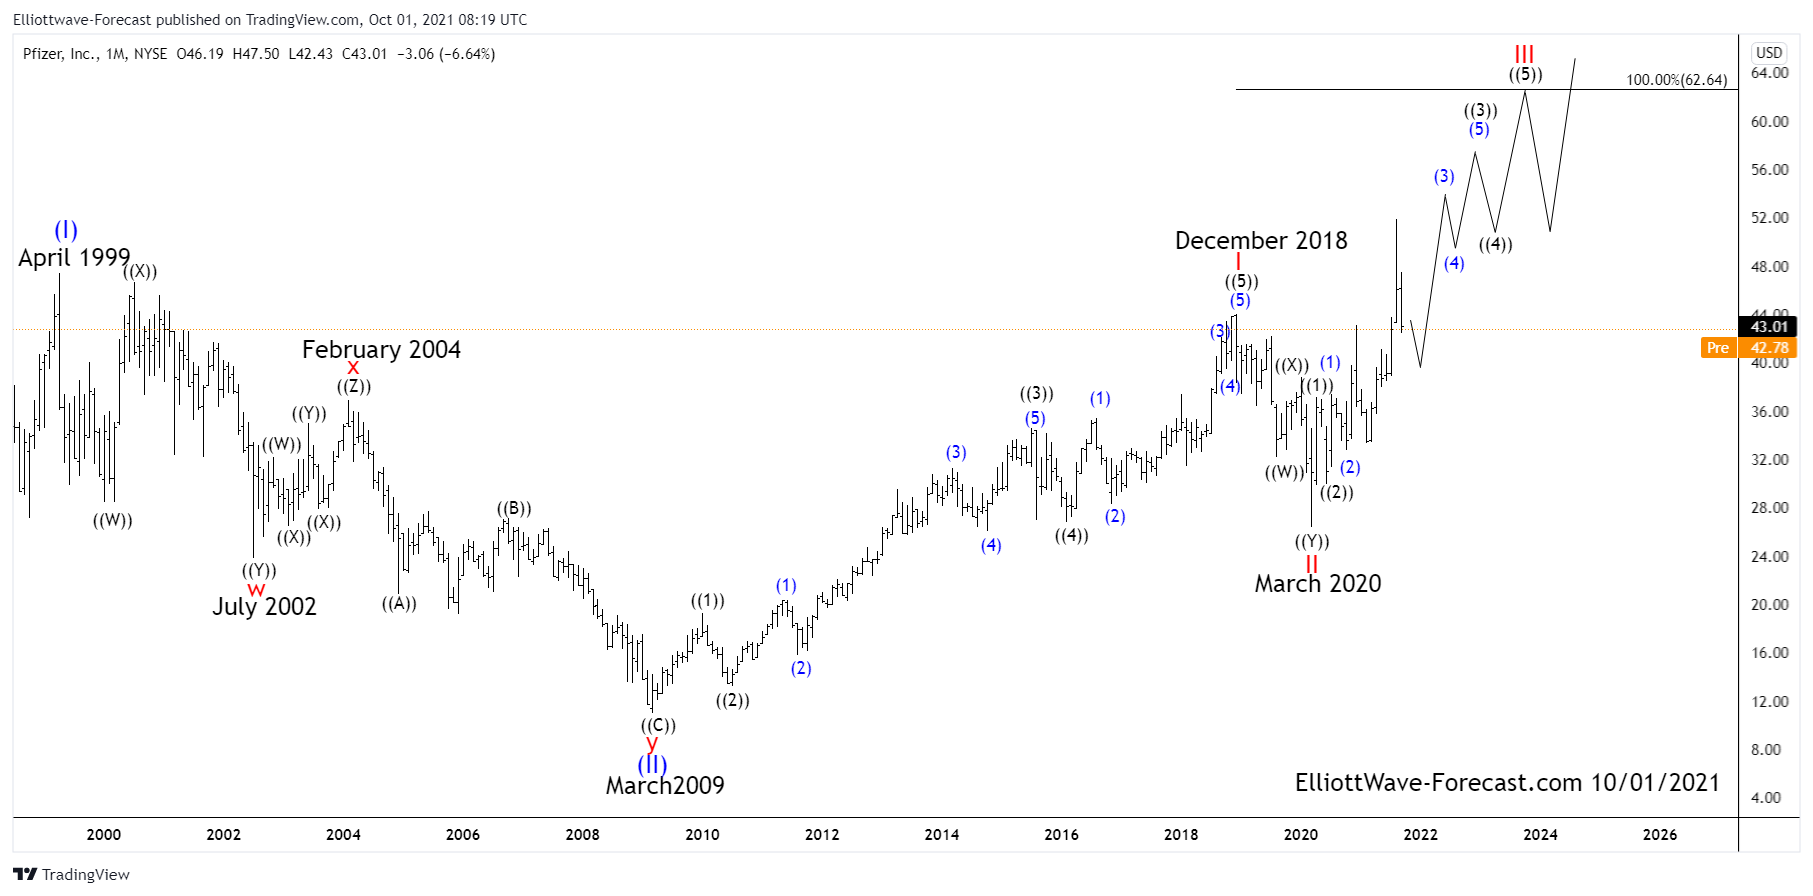
$PFE Elliott Wave Cycles & Long Term Bullish Trend
The Pfizer Long Term Bullish Trend and Elliott Wave Cycles suggest the stock price will be trending higher. The cycles project it should continue toward the April 1999 highs while it is above the March 2020 lows. From the beginning of the stock trading it had a couple decades long uptrend cycle to the April 1999 peak. This is where the analysis begins on the chart at the larger degree blue wave (I).
Firstly I will mention that is roughly a 10 year decline in the blue wave (II) to the March 2009 lows. This was certainly long enough in time and price to correct the previously mentioned decades long up trend cycle. The pullback was a basic seven swing double three correction. You can see the subdivisions of the larger degree red w and y subdivided into three swings each as well. The connector wave red x appeared to have been a triple three although it is not of any significance now. It served the purpose at the time of being the connector wave.
Secondly I will talk about the impulsive bounce from the March 2009 larger degree blue wave (II) lows. I would also like to mention you can see the guidelines for reading Elliott Wave structures at our website. From the March 2009 lows the larger degree red I subdivided into a clear five waves. There was enough room on the chart to show the subdivision the wave ((2)) lows to the wave ((3)) highs into five waves of smaller degree in blue. The analysis and conclusion continues below the chart.

Thirdly as you can see the wave ((4)) lows in February 2016 to the December 2018 highs was also extended enough to show the subdivision of the wave ((5)) cycle. I also will mention some of the technical aspects of why the red I and II is favored in place to give that target area.
The stock clearly shows a five waves impulse from the 2009 lows. The read on the momentum indicators like rsi suggested the dip to the March 2020 lows corrected the whole cycle from the March 2009 lows.
In conclusion, ideally the stock will go higher while above the March 2020 lows. To get the longer term target area beginning at 62.64 is as follows. Take the Fibonacci extension tool on your chart platform and begin at the point of the March 2009 lows. From there go up to the point of the red I peak then back down to the red wave II low. That will give a target extension area where the current red wave III is equal to the red wave I at 62.64.
As mentioned that is where the target area begins. Higher would be more preferable as we sometimes see a wave III reach the 161.8 Fibonacci extension or greater. Once it ends it will only be expected to correct the cycle up from the March 2020 lows. This should be in a relatively shallow .236 to .382 Fibonacci retracement of the wave III cycle. Afterward it will be expected to be turning higher again.
Source: https://elliottwave-forecast.com/stock-market/pfe-elliott-wave-cycles-long-term-bullish-trend/
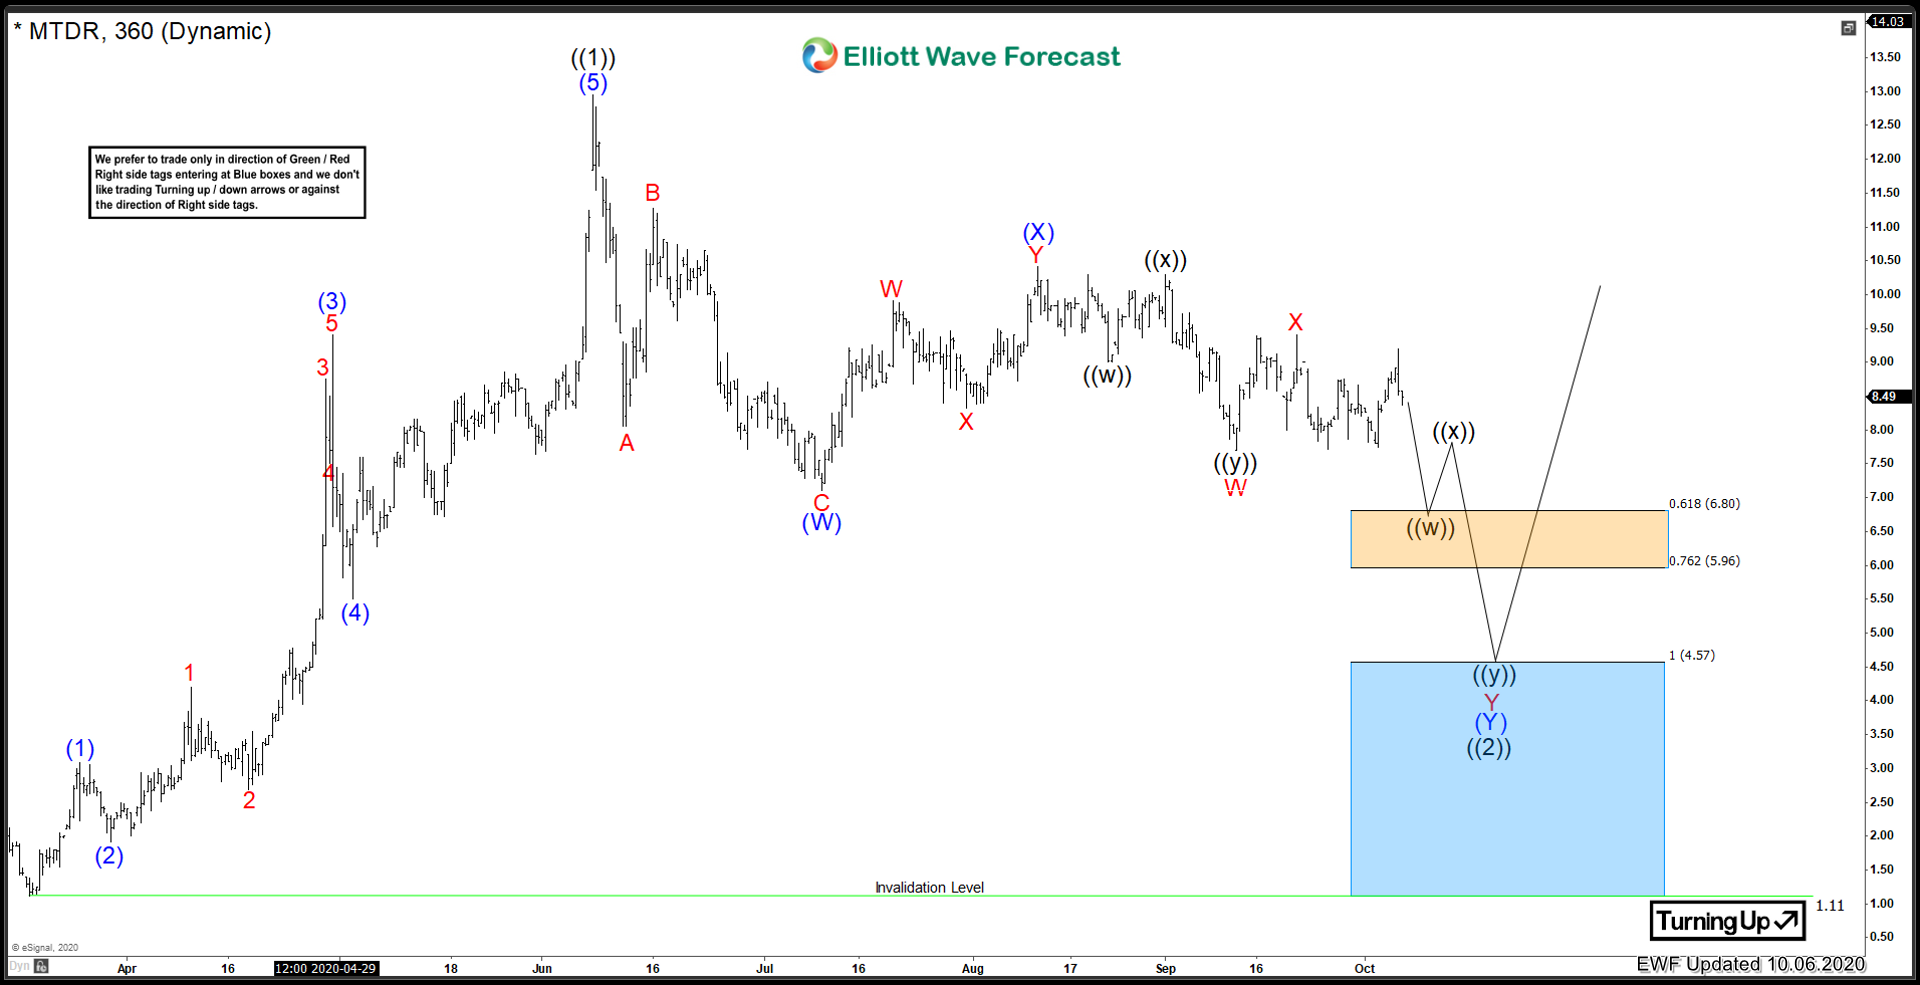
The last time I analyzed this company (article can be found here), it was close to setting a low in wave ((2)) before moving higher in a wave ((3)). Before I get into the charts, lets check out the company profile:
"Matador Resources Company is an independent energy company engaged in the exploration, development, production and acquisition of oil and natural gas resources in the United States, with an emphasis on oil and natural gas shale and other unconventional plays. Our current operations are focused primarily on the oil and liquids-rich portion of the Wolfcamp and Bone Spring plays in the Delaware Basin in Southeast New Mexico and West Texas. We also operate in the Eagle Ford shale play in South Texas and the Haynesville shale and Cotton Valley plays in Northwest Louisiana."
Technically speaking, I liked what I saw nearly a year ago, so how did things play out? Lets take a look at the previous Elliottwave view from 2020:

I had noted in the previous article, that the stock may bottom at the 0.618% extension area, instead of the blue box due to a variety of factors which you can read in my previous article. How did things turn out? Well lets take a look at the current view:

Prices did indeed strike a low near the orange box area on the initial view. From there, prices have enjoyed a very nice wave ((3)) advance. From that low set in October 2020, the stock has shown a 5 waves impulse into ((3)). ((3)) peaked on June 25/2021 at 38.05. From there a pullback took place in ((4)) which bottomed at the August 19/2021 low. After that, it has rallied impulsively, and exceeded the ((3)) peak creating a new incomplete bullish sequence.
In conclusion. There are some 3s and 4s that need to be realized before this stock can peak. the 41.31 to 46.43 is the next area on the upside where another pullback can happen.
Source: https://elliottwave-forecast.com/stock-market/matador-resources-co-mtdr-advancing-5th-wave/
Platinum is a metal which is used in jewelry, decoration and dental work. The metal and its alloys are also used for electrical contacts, fine resistance wires and medical / laboratory instruments. An alloy of platinum and cobalt is used to produce strong permanent magnets (chemicool.com). Other uses of the metal include cancer drugs, use in car airbags, personal hygiene and make up products, as a catalyst in hydrogen-powered fuel cell electric vehicles (FCEVs) and power generation. Today, we will take a look at long-term Elliott Wave Analysis and forecast of Platinum futures.


Source: https://elliottwave-forecast.com/commodities/platinum-futures-elliott-wave-analysis/
Firstly from the beginning of price data from back in the 1970’s not shown on the chart, the price trend was obviously up. It ended that bullish cycle in September 1987 and pulled back really hard during the October 1987 crash. Price stabilized from there several years into the 1996 highs before another cycle lower into the October 2000 lows. That swing lower finished a correction of the cycle up from the all time lows. Those lows are still intact. The bounce that developed from the October 2000 lows into the January 2006 highs appears to have been an Elliott Wave impulse of five waves.
Secondly the three large swings from the January 2006 highs down to November 2008 lows appears to be the beginning of a large flat 3-3-5 structure. From the November 2008 lows back up to the November 2011 highs was likely a zig-zag structure by itself. The decline from the November 2011 highs down to the August 2015 lows appeared to be five waves. This completed a 3-3-5 flat structure. Of note, the lows from October 2000 remained intact again suggesting the August 2015 lows finished correcting that cycle up from there.
The analysis continues below the chart.
Thirdly in conclusion the aforementioned lows from August 2015 & now as well as the October 2018 lows should remain intact during future pullbacks for a long time to come. The bounce from those lows definitely ended the cycle lower. The bounce to the August 2016 high appeared to be five waves up. This was similar to the October 2000 to January 2006 bounce although of smaller degree. The pullback lower from the August 2016 high to the October 2018 low was obviously three swings. Price has bounced real hard from there suggesting it is within a larger degree wave three. Pullbacks should remain well above the October 2018 cycle lows. While doing that, the possibility remains that current cycle will take out the old highs from September 1987 in the not too distant future.
Source: https://elliottwave-forecast.com/st...rm-bullish-cycles-of-the-newmont-corporation/
Post automatically merged:
$PFE Elliott Wave Cycles & Long Term Bullish Trend
The Pfizer Long Term Bullish Trend and Elliott Wave Cycles suggest the stock price will be trending higher. The cycles project it should continue toward the April 1999 highs while it is above the March 2020 lows. From the beginning of the stock trading it had a couple decades long uptrend cycle to the April 1999 peak. This is where the analysis begins on the chart at the larger degree blue wave (I).
Firstly I will mention that is roughly a 10 year decline in the blue wave (II) to the March 2009 lows. This was certainly long enough in time and price to correct the previously mentioned decades long up trend cycle. The pullback was a basic seven swing double three correction. You can see the subdivisions of the larger degree red w and y subdivided into three swings each as well. The connector wave red x appeared to have been a triple three although it is not of any significance now. It served the purpose at the time of being the connector wave.
Secondly I will talk about the impulsive bounce from the March 2009 larger degree blue wave (II) lows. I would also like to mention you can see the guidelines for reading Elliott Wave structures at our website. From the March 2009 lows the larger degree red I subdivided into a clear five waves. There was enough room on the chart to show the subdivision the wave ((2)) lows to the wave ((3)) highs into five waves of smaller degree in blue. The analysis and conclusion continues below the chart.
PFIZER Monthly Chart $PFE
Thirdly as you can see the wave ((4)) lows in February 2016 to the December 2018 highs was also extended enough to show the subdivision of the wave ((5)) cycle. I also will mention some of the technical aspects of why the red I and II is favored in place to give that target area.
The stock clearly shows a five waves impulse from the 2009 lows. The read on the momentum indicators like rsi suggested the dip to the March 2020 lows corrected the whole cycle from the March 2009 lows.
In conclusion, ideally the stock will go higher while above the March 2020 lows. To get the longer term target area beginning at 62.64 is as follows. Take the Fibonacci extension tool on your chart platform and begin at the point of the March 2009 lows. From there go up to the point of the red I peak then back down to the red wave II low. That will give a target extension area where the current red wave III is equal to the red wave I at 62.64.
As mentioned that is where the target area begins. Higher would be more preferable as we sometimes see a wave III reach the 161.8 Fibonacci extension or greater. Once it ends it will only be expected to correct the cycle up from the March 2020 lows. This should be in a relatively shallow .236 to .382 Fibonacci retracement of the wave III cycle. Afterward it will be expected to be turning higher again.
Source: https://elliottwave-forecast.com/stock-market/pfe-elliott-wave-cycles-long-term-bullish-trend/
Post automatically merged:
The last time I analyzed this company (article can be found here), it was close to setting a low in wave ((2)) before moving higher in a wave ((3)). Before I get into the charts, lets check out the company profile:
"Matador Resources Company is an independent energy company engaged in the exploration, development, production and acquisition of oil and natural gas resources in the United States, with an emphasis on oil and natural gas shale and other unconventional plays. Our current operations are focused primarily on the oil and liquids-rich portion of the Wolfcamp and Bone Spring plays in the Delaware Basin in Southeast New Mexico and West Texas. We also operate in the Eagle Ford shale play in South Texas and the Haynesville shale and Cotton Valley plays in Northwest Louisiana."
Technically speaking, I liked what I saw nearly a year ago, so how did things play out? Lets take a look at the previous Elliottwave view from 2020:
I had noted in the previous article, that the stock may bottom at the 0.618% extension area, instead of the blue box due to a variety of factors which you can read in my previous article. How did things turn out? Well lets take a look at the current view:
Matador Resources Elliottwave View:

Prices did indeed strike a low near the orange box area on the initial view. From there, prices have enjoyed a very nice wave ((3)) advance. From that low set in October 2020, the stock has shown a 5 waves impulse into ((3)). ((3)) peaked on June 25/2021 at 38.05. From there a pullback took place in ((4)) which bottomed at the August 19/2021 low. After that, it has rallied impulsively, and exceeded the ((3)) peak creating a new incomplete bullish sequence.
In conclusion. There are some 3s and 4s that need to be realized before this stock can peak. the 41.31 to 46.43 is the next area on the upside where another pullback can happen.
Source: https://elliottwave-forecast.com/stock-market/matador-resources-co-mtdr-advancing-5th-wave/
Post automatically merged:
Platinum is a metal which is used in jewelry, decoration and dental work. The metal and its alloys are also used for electrical contacts, fine resistance wires and medical / laboratory instruments. An alloy of platinum and cobalt is used to produce strong permanent magnets (chemicool.com). Other uses of the metal include cancer drugs, use in car airbags, personal hygiene and make up products, as a catalyst in hydrogen-powered fuel cell electric vehicles (FCEVs) and power generation. Today, we will take a look at long-term Elliott Wave Analysis and forecast of Platinum futures.
Platinum Futures Elliott Wave Analysis - Monthly Chart
Monthly chart below shows super cycle wave (I) completed in March 2008. Within super cycle wave (I), wave I completed at $652.8, wave II completed at $329.5, wave III completed at $1347, wave IV completed at $1053 and wave V at $2308.8. This was followed by a zigzag Elliott wave pull back to $562 which completed in March 2020. Metal rallied nearly for 11 months to reach a high of $1348.2 in February 2021 and is pulling back again. As far as pull back stays above March 2020 low, we expect the rally to resume for a new high above March 2008 or 1 more leg higher at least.
Platinum Futures Elliott Wave Analysis - Daily Chart
Chart below shows Elliott wave structure of the rally from March 2020 low. As the chart shows rally can be counted in 5 waves and completed at $1348.2 in February 2021. This has been labelled as wave I of (III). Since then it has been in a pull back and is currently showing 5 swings down within the pull back. While below $1011 and more importantly below $1145.2, expectations are for another swing lower towards $812.9 - $606.5 to complete 7 swings corrective pull back in wave II. As cycle from March 2008 peak has ended so our strategy remains to look for buying opportunities in the pull backs as far as prices stay above $562 low. Alternate view suggests, wave II pull back ended already at $892.6 and next leg higher has started. A break above $1011 will make the alternate view more likely to play out.
Source: https://elliottwave-forecast.com/commodities/platinum-futures-elliott-wave-analysis/
In this technical blog, we are going to take a look at the past performance of Facebook stock 1hr chart presented to members at elliottwave-forecast.com. In which the decline from September 01, 2021, high unfolded as Elliott wave impulse sequence thus suggested that it's a continuation pattern & bounces should get fail in 3 or 7 swings structure. We will explain the structure & forecast below:

Here's the 1hr Elliott wave Chart from the 9/26/2021 Weekend update. In which, the decline to $340.18 low ended 5 waves impulse sequence from the peak within wave (A). Up from there, the stock made a bounce in wave (B) to correct the cycle from 9/01/2021 high. The internals of that bounce unfolded as Elliott wave flat structure where wave A ended in 3 swings at $349.67 high. Then wave B ended at $341.48 low and started the C leg higher with the expectation of another push higher to end the flat correction.

This is the Latest 1hr view from the weekend update. In which the stock made the last push higher & end up failing lower as expected in another 5 waves impulse sequence suggesting that the (C) leg lower already started. Now as far as bounces fail below $355.17 high the stock is expected to see more downside towards $311- $300 area lower.
Source: https://elliottwave-forecast.com/stock-market/facebook-reacted-lower-ending-flat-correction/
US Dollar has been rallying in the past few months ahead of the expected tapering by the Fed and rising yields. However, it doesn't change the long term bullish outlook in Pound Sterling. The pullback in GBPUSD retested the breakout neckline of the inverse head and shoulder as the chart below shows. Further downside in near term remains possible, but the pair is close to major support levels.

GBPUSD weekly chart above shows pair managed to break above 3 years inverse head and shoulder neckline. Current pullback from June 2021 peak has retested the breakout neckline. Although marginal low can't be ruled out, the pair is getting closer to major support areas. Pair may have also ended the correction and start to resume the upside. Potential target is the distance between the head and neckline measured from the point of breakout which is 1.55.

Weekly Elliott Wave chart of GBPUSD above shows pair is in the process of ending wave II pullback to correct cycle from March 2020 low. If pair continues the correction lower, then a potential support area is 100% - 161.8% Fibonacci extension from May 2021 peak at 1.286 - 1.329. From this blue box area, pair could resume the rally higher or rally in 3 waves at least.
Source: https://elliottwave-forecast.com/forex/gbpusd-close-to-support-levels/
Facebook 1 Hour Elliott Wave Chart

Here's the 1hr Elliott wave Chart from the 9/26/2021 Weekend update. In which, the decline to $340.18 low ended 5 waves impulse sequence from the peak within wave (A). Up from there, the stock made a bounce in wave (B) to correct the cycle from 9/01/2021 high. The internals of that bounce unfolded as Elliott wave flat structure where wave A ended in 3 swings at $349.67 high. Then wave B ended at $341.48 low and started the C leg higher with the expectation of another push higher to end the flat correction.
Facebook Latest 1hr Elliott Wave Chart

This is the Latest 1hr view from the weekend update. In which the stock made the last push higher & end up failing lower as expected in another 5 waves impulse sequence suggesting that the (C) leg lower already started. Now as far as bounces fail below $355.17 high the stock is expected to see more downside towards $311- $300 area lower.
Source: https://elliottwave-forecast.com/stock-market/facebook-reacted-lower-ending-flat-correction/
Post automatically merged:
US Dollar has been rallying in the past few months ahead of the expected tapering by the Fed and rising yields. However, it doesn't change the long term bullish outlook in Pound Sterling. The pullback in GBPUSD retested the breakout neckline of the inverse head and shoulder as the chart below shows. Further downside in near term remains possible, but the pair is close to major support levels.
GBPUSD Retesting Inverse Head and Shoulder Neckline
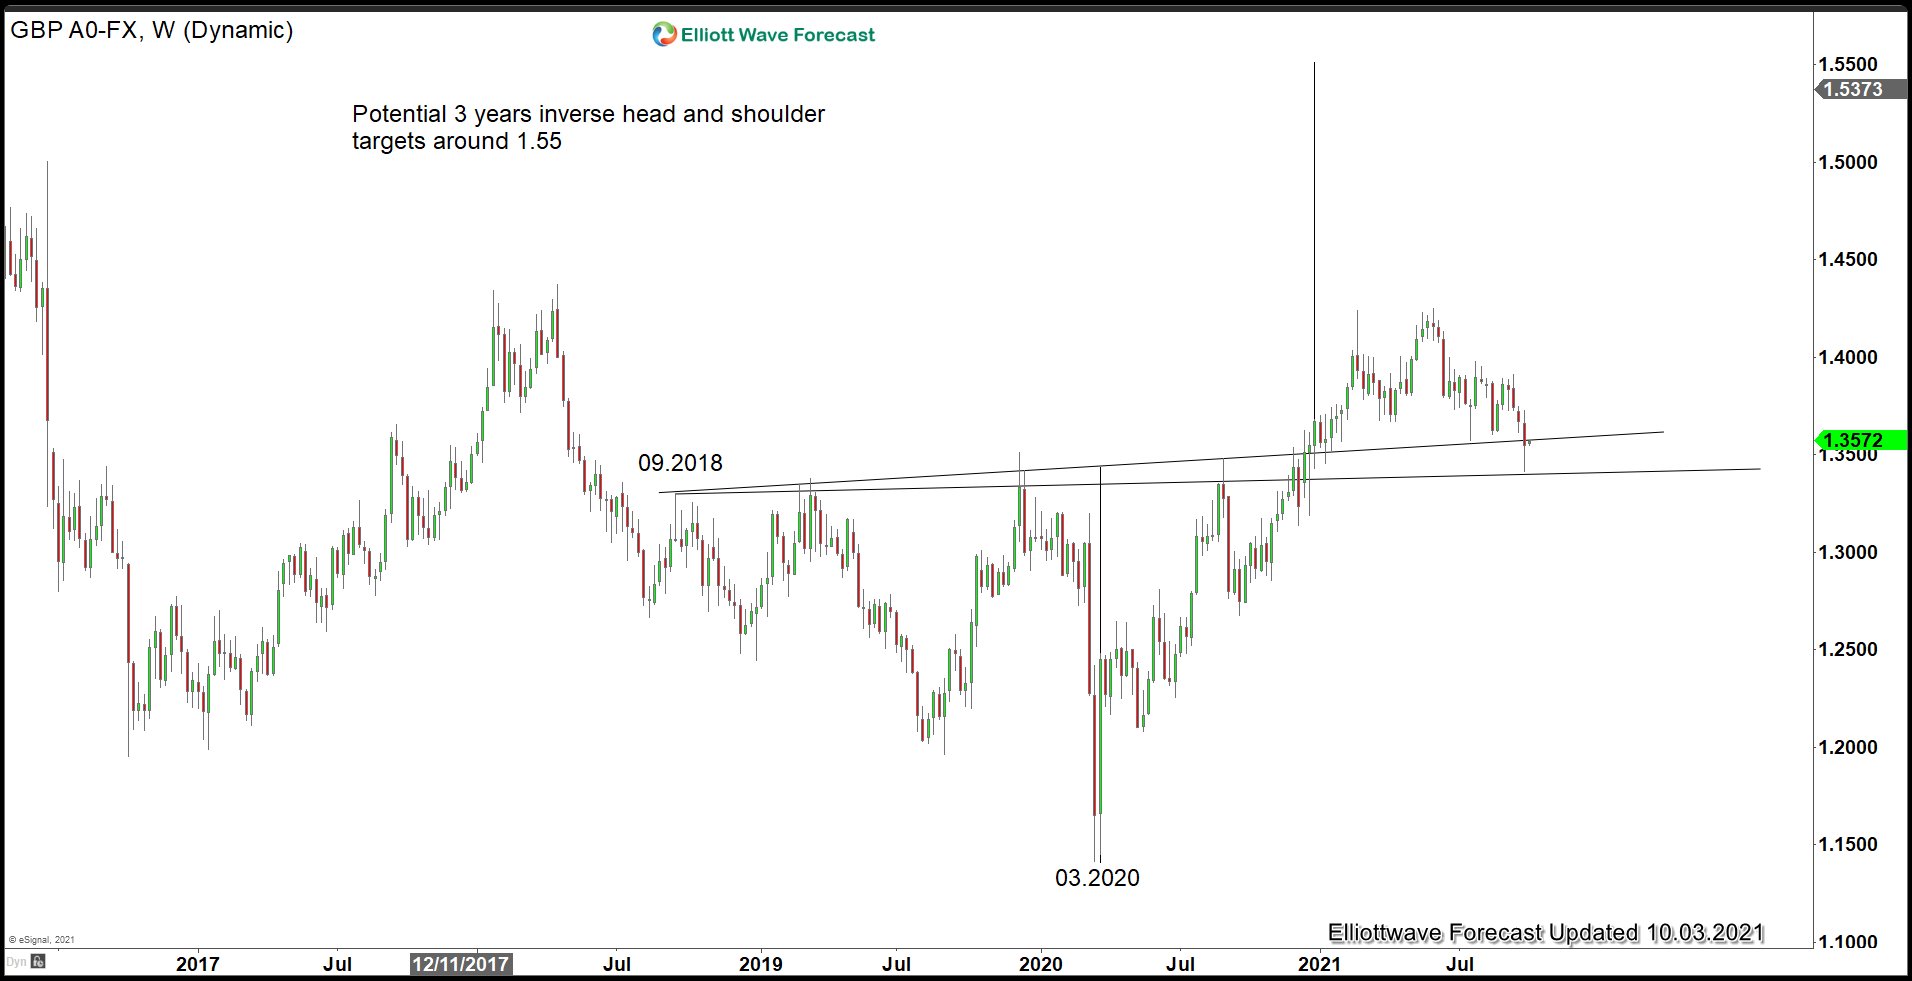
GBPUSD weekly chart above shows pair managed to break above 3 years inverse head and shoulder neckline. Current pullback from June 2021 peak has retested the breakout neckline. Although marginal low can't be ruled out, the pair is getting closer to major support areas. Pair may have also ended the correction and start to resume the upside. Potential target is the distance between the head and neckline measured from the point of breakout which is 1.55.
GBPUSD Weekly Elliott Wave View
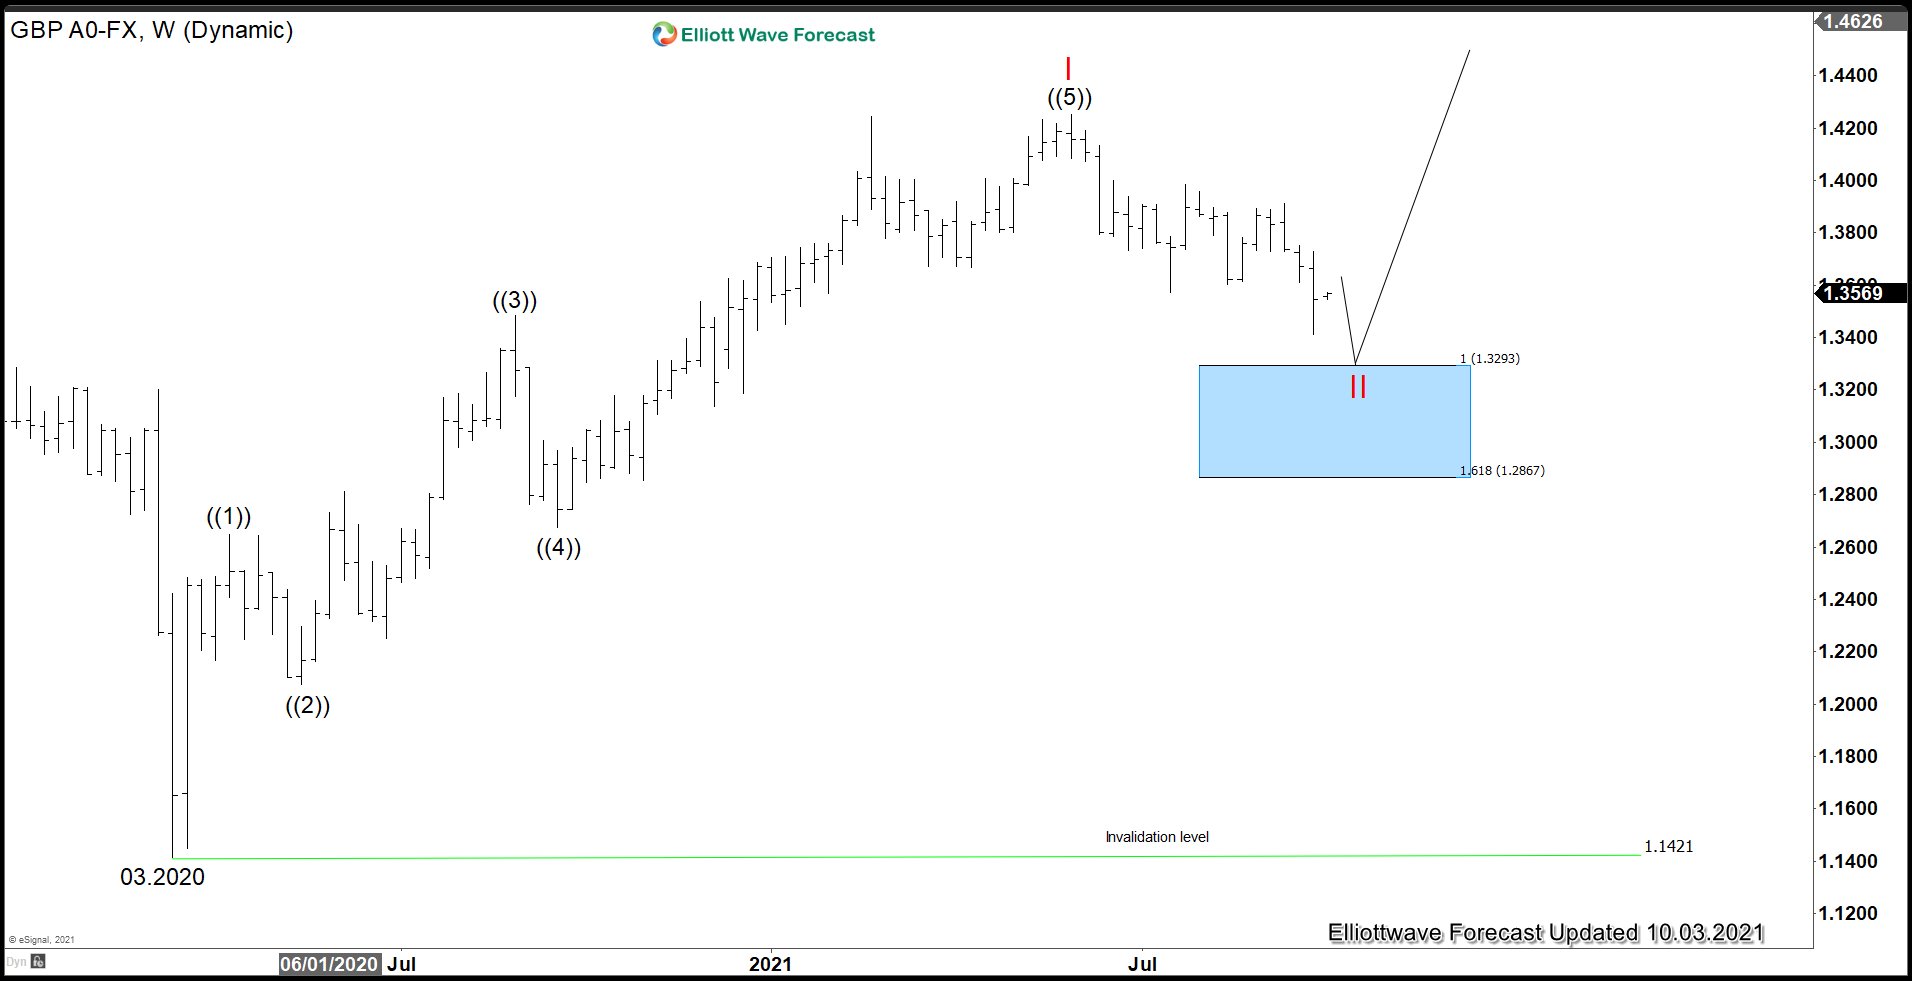
Weekly Elliott Wave chart of GBPUSD above shows pair is in the process of ending wave II pullback to correct cycle from March 2020 low. If pair continues the correction lower, then a potential support area is 100% - 161.8% Fibonacci extension from May 2021 peak at 1.286 - 1.329. From this blue box area, pair could resume the rally higher or rally in 3 waves at least.
Source: https://elliottwave-forecast.com/forex/gbpusd-close-to-support-levels/
Since the crash of March 2020, all stocks have tried to recover what they lost, and Disney was no exception. Disney did not only recover the lost, but It also reached historic highs. Now, we are going to try to build an impulse from the March 2020 lows with a target around $230. Target measured from 0 to 2019’s high projected from March’s low, equal legs. Since we begin with this analysis on February 13th, we bought the share in 160.97 then the market broke to a new historical high and reached the first target at 190.88 after hours. The target gave us a return of +18.58% in 12 days. (If you want to learn more about Elliott Wave Theory, please follow these links: Elliott Wave Education and Elliott Wave Theory).

We relabelled Disney impulse building a leading diagonal from March 2020 low ending at 137.34 as wave ((1)). Then a zig zag correction as wave ((2)) finishing at 117.19. Wave ((3)) is a clearly impulse ended at 183.54 and wave 4 pullback ended at 160.57. The last push to the upside to complete wave ((5)) and Wave I topped at 203.01. From there, the stock did a 3 swings down gave us the idea that we need one rally to complete the impulse, but the lagging in time from may un today is too long to think that and it is better to think that we are already in wave II correction.
We could see now we need to break the low of wave (W) in blue to confirm the progress of wave (Y). Then we should continue lower to 165.79 - 152.18 area to complete wave ((W)) as (W), (X), and (Y) double correction structure. That is the first part of the correction. Then we should see a bounce in 3 swings that should fail to complete the connector ((X)) and further downside should take place. This last face should have the same structure of the first one, that is a double correction (W), (X), (Y) to complete wave ((Y)) and also wave II.
Source: https://elliottwave-forecast.com/stock-market/disney-ended-cycle-double-three-play/
Ammo Incorporated is an U.S. American defense company producing high-quality ammunition. The company owns STREAK (R), HyperClean and military ammunition technologies. Headquartered in Scottsdale, Arizona, USA, Ammo can be traded under the ticker $POWW at Nasdaq.
Within wave ((III)), one can see the initial cycle in wave I. Hereby, red wave I of blue wave (I) has ended at 10.37 highs.

While below 7.93, investors and traders can be looking to buy $POWW from 4.18-1.86 area expecting acceleration higher.

Source: https://elliottwave-forecast.com/stock-market/ammo-incorporated-high-potential/
Unilever is a multinational consumer goods corporation. Unilever products include food, condiments, ice cream, coffee, cleaning agents, pet food, beauty products, personal care and more. Founded 1919 by the merger of the Dutch margarine producer Margarine Unie and the British soapmaker Lever Brothers, it is headquartered in London, UK. Unilever is a part of FTSE 100, AEX and Eurostoxx 50 indices. Investors can trade it under the tickers $ULVR at LSE, $UNA at Euronext Amsterdam and under $UL at NYSE. Corporation Unilever owns over 400 brands. Among them, the trademarks like Dove, Omo/Persil, Knorr, Lipton, Magnum, Rexona/Degree and others. The company products are present in 190 countries.
The stock price of Unilever is in a permanent rally from the all-time lows. In the last years, one can see a sideways price action in a form of a triangle. That means, that Unilever should thrust higher towards the new all-time highs.

As an outlook, while above 45.64, the new cycle in blue wave (V) should bring the prices towards 62.30-69.67 area and even higher. In a larger time scale, after wave (V) of ((I)) will end, expect a larger pullback to happen. This again should provide an opportunity later on.

Source: https://elliottwave-forecast.com/stock-market/unilever-thrust-new-high/
In this technical blog we’re going to take a look at the Elliott Wave charts charts of S&P 500 Futures $ES_F published in members area of the website. As our members know $ES_F is giving us pull back ((4)), which is correcting the cycle from the 24th September low. Recently the futures found sellers after completing short term recovery as Elliott Wave Zig Zag. In further text we’re going to explain the forecast and Elliott Wave Patterns.
Before we take a look at the real market example, let’s explain Elliott Wave Zigzag.
Elliott Wave Zigzag is the most popular corrective pattern in Elliott Wave theory . It’s made of 3 swings which have 5-3-5 inner structure. Inner swings are labeled as A,B,C where A =5 waves, B=3 waves and C=5 waves. That means A and C can be either impulsive waves or diagonals. (Leading Diagonal in case of wave A or Ending in case of wave C) . Waves A and C must meet all conditions of being 5 wave structure, such as: having RSI divergency between wave subdivisions, ideal Fibonacci extensions and ideal retracements.
You can learn more about Elliott Wave ZigZag Patterns at our Free Elliott Wave Educational Web Page.


Keep in mind that market is dynamic and presented view could have changed in the mean time. You can check most recent charts in the membership area of the site. Best instruments to trade are those having incomplete bullish or bearish swings sequences. We put them in Sequence Report and best among them are shown in the Live Trading Room.

Elliott Wave Forecast
Source: https://elliottwave-forecast.com/elliottwave/elliott-wave-sp-500-futures-es_f/
Disney Daily Chart

We relabelled Disney impulse building a leading diagonal from March 2020 low ending at 137.34 as wave ((1)). Then a zig zag correction as wave ((2)) finishing at 117.19. Wave ((3)) is a clearly impulse ended at 183.54 and wave 4 pullback ended at 160.57. The last push to the upside to complete wave ((5)) and Wave I topped at 203.01. From there, the stock did a 3 swings down gave us the idea that we need one rally to complete the impulse, but the lagging in time from may un today is too long to think that and it is better to think that we are already in wave II correction.
We could see now we need to break the low of wave (W) in blue to confirm the progress of wave (Y). Then we should continue lower to 165.79 - 152.18 area to complete wave ((W)) as (W), (X), and (Y) double correction structure. That is the first part of the correction. Then we should see a bounce in 3 swings that should fail to complete the connector ((X)) and further downside should take place. This last face should have the same structure of the first one, that is a double correction (W), (X), (Y) to complete wave ((Y)) and also wave II.
Source: https://elliottwave-forecast.com/stock-market/disney-ended-cycle-double-three-play/
Post automatically merged:
Ammo Incorporated is an U.S. American defense company producing high-quality ammunition. The company owns STREAK (R), HyperClean and military ammunition technologies. Headquartered in Scottsdale, Arizona, USA, Ammo can be traded under the ticker $POWW at Nasdaq.
Ammo Monthly Elliott Wave Analysis 10.04.2021
The monthly chart below shows the Ammo stock $POWW traded at Nasdaq. From the all-time lows, the stock price has developed a cycle higher in black wave ((I)) of grand super cycle degree towards the all-time highs on February 1998 at 195.31. From the highs, a correction lower in black wave ((II)) has unfolded as an Elliott wave zigzag pattern. It has printed an important bottom in September 2003 at 0.03. Within 5 years and half, the stock price went almost to zero. From the lows, a new cycle in wave ((III)) has already started and should extend towards 195.31 highs and even higher.Within wave ((III)), one can see the initial cycle in wave I. Hereby, red wave I of blue wave (I) has ended at 10.37 highs.

Ammo Daily Elliott Wave Analysis 10.04.2021
The daily chart below shows in more detail the last stages of the advance higher in wave I and the pullback in wave II. The wave I has ended in June 2021 at 10.37 highs. From there, a pullback in wave II is taking place and should find support in 3, 7, 11 swings above 0.03 lows.While below 7.93, investors and traders can be looking to buy $POWW from 4.18-1.86 area expecting acceleration higher.

Source: https://elliottwave-forecast.com/stock-market/ammo-incorporated-high-potential/
Post automatically merged:
Unilever is a multinational consumer goods corporation. Unilever products include food, condiments, ice cream, coffee, cleaning agents, pet food, beauty products, personal care and more. Founded 1919 by the merger of the Dutch margarine producer Margarine Unie and the British soapmaker Lever Brothers, it is headquartered in London, UK. Unilever is a part of FTSE 100, AEX and Eurostoxx 50 indices. Investors can trade it under the tickers $ULVR at LSE, $UNA at Euronext Amsterdam and under $UL at NYSE. Corporation Unilever owns over 400 brands. Among them, the trademarks like Dove, Omo/Persil, Knorr, Lipton, Magnum, Rexona/Degree and others. The company products are present in 190 countries.
The stock price of Unilever is in a permanent rally from the all-time lows. In the last years, one can see a sideways price action in a form of a triangle. That means, that Unilever should thrust higher towards the new all-time highs.
Unilever Monthly Elliott Wave Analysis 10.04.2021
The monthly chart below shows the Unilever shares $UNA traded at Euronext Amsterdam. From the all-time lows, the stock price is within the larger impulse as wave ((I)). Hereby, Unilever has finished the waves (I)-(III) by printing the all-time high on September 2019 at 57.77. Within the impulsive advance in wave (III), the internals I and III are impulsive waves, too. From the September 2019 highs, a correction lower in wave (IV) shows a contracting triangle pattern being a 3-3-3-3-3 structure. It may have ended in September 2009 at 45.64.
Unilever Daily Elliott Wave Analysis 10.04.2021
The Daily chart below shows the $UNA shares price action in more detail. In particular, it demonstrates the contracting legs c-d-e of the triangle. Each one is either a zigzag pattern or a double three structure. From the September 2021 low, a new cycle in wave (V) might be in the first stages and should break to the new highs..As an outlook, while above 45.64, the new cycle in blue wave (V) should bring the prices towards 62.30-69.67 area and even higher. In a larger time scale, after wave (V) of ((I)) will end, expect a larger pullback to happen. This again should provide an opportunity later on.

Source: https://elliottwave-forecast.com/stock-market/unilever-thrust-new-high/
Post automatically merged:
In this technical blog we’re going to take a look at the Elliott Wave charts charts of S&P 500 Futures $ES_F published in members area of the website. As our members know $ES_F is giving us pull back ((4)), which is correcting the cycle from the 24th September low. Recently the futures found sellers after completing short term recovery as Elliott Wave Zig Zag. In further text we’re going to explain the forecast and Elliott Wave Patterns.
Before we take a look at the real market example, let’s explain Elliott Wave Zigzag.
Elliott Wave Zigzag is the most popular corrective pattern in Elliott Wave theory . It’s made of 3 swings which have 5-3-5 inner structure. Inner swings are labeled as A,B,C where A =5 waves, B=3 waves and C=5 waves. That means A and C can be either impulsive waves or diagonals. (Leading Diagonal in case of wave A or Ending in case of wave C) . Waves A and C must meet all conditions of being 5 wave structure, such as: having RSI divergency between wave subdivisions, ideal Fibonacci extensions and ideal retracements.


$ES_F 1 Hour Elliott Wave Analysis 9.23.2021.
Wave (X) blue correction can be in progress as Elliott Wave Zig Zag pattern. First leg of the (X) bounce has subdivision in 5 waves. Then we got 3 waves pull back B red . Now ideally doing 5 waves up in C red. We expect to see more short term strength in SP Futures. Approximate area where (X) blue connector can complete comes at the A-B red equal legs : 4424.3-4488.8. From that zone we expect to see another leg down. There is no incomplete bearish sequences at the moment, and we don't recommend selling.You can learn more about Elliott Wave ZigZag Patterns at our Free Elliott Wave Educational Web Page.

$ES_F 1 Hour Elliott Wave Analysis 9.23.2021.
Recovery made 5 waves in C red leg as we expected. $ES_F completed Elliott Wave Zig Zag Structure at 4471.77 high. At the moment we are getting 3 waves recovery in short term X red connector. As far as the price holds pivot at 4471.77 high in place , the futures can see more weakness in (Y) blue leg. We need to see break of (W) blue low -09/20 to confirm next leg down is in progress.
$ES_F 1 Hour Elliott Wave Analysis 10.01.2021.
We got further decline after 3 waves bounce. Eventually the price has broken 09/20 low , making lower low sequences. That made $ES_F bearish against the 4472.19 high in near term, targeting 4214.8-4154.3 area. Short term recovery can be ending soon at 43338.8-4377.4 area.Keep in mind that market is dynamic and presented view could have changed in the mean time. You can check most recent charts in the membership area of the site. Best instruments to trade are those having incomplete bullish or bearish swings sequences. We put them in Sequence Report and best among them are shown in the Live Trading Room.

Elliott Wave Forecast
Source: https://elliottwave-forecast.com/elliottwave/elliott-wave-sp-500-futures-es_f/
The last time I analyzed Bit Digital was in August 2021 (article can be read here). At the time, I had called the low in Red II, and was looking for an impulsive leg up to take place. Bit Digital is one of the worlds largest bitcoin miners. Before moving their operations to North America, they were primarily based out of China. This had a negative impact on the stock price leading into the Red II low. However, most of their equipment is now setup, or is close to being setup in North America. So that risk factor is now in the past. Lets take a look at my view from August.

As you can see, in August 2021 the low was looking like it was set and I was favouring a 5 waves rally into (1), before pulling back into (2). Now lets take a look at todays price action.

The stock has performed exactly as anticipated. After rallying in 5 waves higher into (1), the stock pulled back to correct the cycle from the July 20/2021 low. This correction unfolded as an ABC correction. Typically, an event will cause the final turn to take place. In this case with Bit Digital, they announced a private stock offering which caused prices to decline into the (2) low. The dip didn't last long and prices are well on their way higher.
In conclusion, as per chart above, the expectation is for another wave 2 to take place before moving strong higher. As long as the (2) lows hold, further upside in a wave 3 is favored to take place.
Source: https://elliottwave-forecast.com/stock-market/bit-digital-btbt-priming-wave-3-breakout/
In this article, we will look at the correction in BTCUSD during the month of September and how we called the rally after it completed a Zigzag Elliott wave correction. Chart below is from 28th September 2021 when we called the correction completed and called for the rally to resume. We saw an Elliott wave pattern called nesting which is basically a series of 1-2-((i))-((ii)) and is seen before acceleration in wave ((iii)) takes place.


Source: https://elliottwave-forecast.com/forex/btcusd-forecasting-rally-post-correction/
Bit Digital Early August 2021 Elliottwave View:

As you can see, in August 2021 the low was looking like it was set and I was favouring a 5 waves rally into (1), before pulling back into (2). Now lets take a look at todays price action.
Bit Digital October 2021 Elliottwave View:

The stock has performed exactly as anticipated. After rallying in 5 waves higher into (1), the stock pulled back to correct the cycle from the July 20/2021 low. This correction unfolded as an ABC correction. Typically, an event will cause the final turn to take place. In this case with Bit Digital, they announced a private stock offering which caused prices to decline into the (2) low. The dip didn't last long and prices are well on their way higher.
In conclusion, as per chart above, the expectation is for another wave 2 to take place before moving strong higher. As long as the (2) lows hold, further upside in a wave 3 is favored to take place.
Source: https://elliottwave-forecast.com/stock-market/bit-digital-btbt-priming-wave-3-breakout/
Post automatically merged:
In this article, we will look at the correction in BTCUSD during the month of September and how we called the rally after it completed a Zigzag Elliott wave correction. Chart below is from 28th September 2021 when we called the correction completed and called for the rally to resume. We saw an Elliott wave pattern called nesting which is basically a series of 1-2-((i))-((ii)) and is seen before acceleration in wave ((iii)) takes place.
BTCUSD 4 Hour Elliott Wave Analysis 9.28.2021

BTCUSD 4 Hour Elliott Wave Analysis 10.4.2021
BTCUSD held above the low of red 2 and rallied strongly just as the chart on 9.28.2021 anticipated. We can see in the chart below that wave ((iii)) has completed and after a pull back in wave ((iv)), Bitcoin is closer to ending wave ((v)) of 3. Afterwards, we expect a pull back in wave 4 to correct the rally from red 2 low before another high to complete 5 waves up from black ((2)) low. Once wave (1) is completed, expect a pull back in wave (2) to correct the cycle from black ((2)) low before continuation higher. A break of black wave ((1)) peak will add more conviction to this view. Until then, a double correction lower in wave ((2)) can't be ruled out and if seen, should present another good swing buying opportunity.
Source: https://elliottwave-forecast.com/forex/btcusd-forecasting-rally-post-correction/
Since bottoming earlier this year, US Dollar has steadily caught a bid. One of the primary reasons for the USD strength is because of the expectation that the Fed will start tapering later this year. The Fed has communicated their intent to reduce the emergency measures as the economy starts to recover from global pandemic. The market has more or less priced in this tapering. In the last Fed's meeting, Chairman Powell indicated a taper ending around mid-2022 may be appropriate.
What is less clear however is how fast the Fed would raise interest rate and returns to a normal monetary policy. Inflation has been well above the the Fed's 2% target. Even using the Fed's preferred gauge for inflation, prices were up 3.6% in July year-over-year. The "dot-plot" of interest rate projection shows an even split between Fed officials who see interest liftoff in 2022 and those who see it later than that. Eight of the Fed members saw first interest rate hike in 2023.
We will look at the weekly Elliott Wave chart for Dollar Index (DXY) below to see the expected move.
 Elliott Wave chart")
The Dollar Index (DXY) has reached inflection area from January 6, 2021 low at the blue box area of 93.7 - 96.3. The current rally from January 6, 2021 low is in 3 swing so far. It could be either an ((A))-((B))-((C)) in a bearish scenario, or ((1))-((2))-((3)) in a bullish scenario. If the move higher extends to 161.8% Fibonacci extension at 96.3, then the odd that it becomes a wave ((3)) of an impulse will increase. As far as it stays within the box, then the move up can be a zigzag ((A))-((B))-((C)).
As the Index has reached blue box, it can soon turn lower in 3 waves at least. Shorter cycle, further upside extension can't be ruled out. However, a 3 waves pullback can soon happen assuming an ((A))-((B))-((C)) rally from January 6, 2021 low. This view will become less likely if the Dollar Index is able to rally to 161.8% extension at 96.3. If this happens, we may become more bullish in the index.
Source: https://elliottwave-forecast.com/forex/us-dollar-reached-inflection-area/
What is less clear however is how fast the Fed would raise interest rate and returns to a normal monetary policy. Inflation has been well above the the Fed's 2% target. Even using the Fed's preferred gauge for inflation, prices were up 3.6% in July year-over-year. The "dot-plot" of interest rate projection shows an even split between Fed officials who see interest liftoff in 2022 and those who see it later than that. Eight of the Fed members saw first interest rate hike in 2023.
We will look at the weekly Elliott Wave chart for Dollar Index (DXY) below to see the expected move.
Dollar Index (DXY) Daily Elliott Wave Chart
 Elliott Wave chart")
The Dollar Index (DXY) has reached inflection area from January 6, 2021 low at the blue box area of 93.7 - 96.3. The current rally from January 6, 2021 low is in 3 swing so far. It could be either an ((A))-((B))-((C)) in a bearish scenario, or ((1))-((2))-((3)) in a bullish scenario. If the move higher extends to 161.8% Fibonacci extension at 96.3, then the odd that it becomes a wave ((3)) of an impulse will increase. As far as it stays within the box, then the move up can be a zigzag ((A))-((B))-((C)).
As the Index has reached blue box, it can soon turn lower in 3 waves at least. Shorter cycle, further upside extension can't be ruled out. However, a 3 waves pullback can soon happen assuming an ((A))-((B))-((C)) rally from January 6, 2021 low. This view will become less likely if the Dollar Index is able to rally to 161.8% extension at 96.3. If this happens, we may become more bullish in the index.
Source: https://elliottwave-forecast.com/forex/us-dollar-reached-inflection-area/
In this technical blog, we will look at the past performance of 4 hour Elliott Wave Charts of Google stock ticker symbol: $GOOGL. In which, the rally from 23 March 2020 low unfolded as an impulse structure with an extended wave three. Therefore, we knew that the structure in GOOGL is incomplete to the upside & another push higher should happen to complete the 5 wave advance from March 2020 low. So, we advised members not to sell the stock & buy the dips in 3, 7, or 11 swings at the blue box areas. We will explain the structure & forecast below:

Here’s 4hr Elliott wave Chart from the 10/03/2021 Weekend update. In which, the cycle from 24 September 2020 low ended wave III in 5 waves structure at $2925.08 high & made a pullback in wave IV. The internals of that pullback unfolded as Elliott wave double three structure where wave ((W)) ended in 3 swings at $2726.44 low. Then a bounce to $2846.61 high ended wave ((X)) & started the next leg lower in wave ((Y)) with a lesser degree zigzag structure towards $2647.06- $2522.95 blue box area. From where buyers were expected to appear looking for new highs ideally or for a 3 wave bounce minimum.

This is the latest 4hr Elliott wave Chart from the 10/11/2021 update. In which the stock is showing a strong reaction higher taking place from the blue box area at $2647.06- $2522.95. Right after ending the double three corrections within the blue box area. Allowed members to create a risk-free position shortly after taking the long positions at the blue box area. However, a break above $2925.08 high is still needed to confirm the next extension higher & avoid double correction lower.
Source: https://elliottwave-forecast.com/stock-market/google-buying-dip-blue-box-area/
$FXC Canadian Dollar Trust Long Term Elliott Wave & Cycles
Firstly the FXC instrument inception date was 6/26/2006. The instrument tracks changes of the value of the Canadian dollar relative to the U.S. dollar. It increases in value when the Loonie strengthens and declines when the dollar appreciates. In January 2002 the USDCAD forex pair made an all time high at 1.6184. Then it saw a decline into the November 2007 lows at .9059 where it is thought to have ended correcting the cycle up from the all time lows. That translates to the 113.02 price high from November 2007 in FXC. This is where the analysis begins on the FXC monthly chart shown below. The analysis continues below the FXC Monthly chart.

Secondly as previously suggested the FXC instrument mirrors USDCAD price highs and lows inversely. The decline from the November 2007 highs in FXC appears to be a complete Elliott Wave five wave impulse although it does have some price overlap as would a diagonal. The wave III ended in January 2016 then saw a zig zag wave structure in wave IV that ended in September 2017 correct the cycle from the July 2011 wave II highs.
In conclusion: As the chart suggests, the instrument appears ended a larger cycle lower in wave V of (C) to complete a flat wave ((B)) in March 2020. The bounce from there can be corrected while below the June 1st 2021 highs. The pullback area for the wave (II) in blue is pending at the moment however while it's below 78.76 it can see the 72.92-69.47 area as it corrects the cycle up from the March 2020 lows. While above the March 2020 lows it should resume higher again.
Source: https://elliottwave-forecast.com/st...n-dollar-trust-long-term-elliott-wave-cycles/
$SMH Semiconductors Long Term Cycles & Elliott Wave
Firstly as seen on the monthly chart shown below. There is data back to May 2000 in the ETF fund. Data suggests the fund made a low in November 2008. This low has not been taken out in price. The cycles in this instrument tends to reflect the Nasdaq index fairly well. However it has a larger degree difference in that the Nasdaq made a low to correct the cycle from the all time lows in October 2002 compared to the low made in November 2008 in the SMH semiconductors.
Secondly every way I count this data it suggests several things. Several counts are always possible however the wave (III) in red & blue are still in progress as per the best reading of the cycles.
The analysis continues below the monthly chart.

Thirdly it appears a wave ((3)) can have already ended and the instrument can relatively soon end an Elliott Wave ((4)) pullback to correct the cycle from the March 2020 lows. The wave ((4)) should see only around a .236 to .382 retracement of the wave ((3)) before turning higher again in wave ((5)) of III.
In conclusion. It appears the pullback in wave ((2)) to the March 2020 lows corrected the cycle up from the red wave II lows from December 2018. I always like to give the trend benefit of the doubt. In this case it should be obvious the trend is higher. The longer term lows highlighted on the chart suggest the SMH should trade higher. This while pullbacks are shallow and show they will remain above the March 2020 lows. Furthermore importantly while it's above the December 2018 lows according to the price data currently available.
Source: https://elliottwave-forecast.com/stock-market/smh-semiconductors-long-term-cycles-elliott-wave-2/
Google 4 Hour Elliott Wave Chart

Here’s 4hr Elliott wave Chart from the 10/03/2021 Weekend update. In which, the cycle from 24 September 2020 low ended wave III in 5 waves structure at $2925.08 high & made a pullback in wave IV. The internals of that pullback unfolded as Elliott wave double three structure where wave ((W)) ended in 3 swings at $2726.44 low. Then a bounce to $2846.61 high ended wave ((X)) & started the next leg lower in wave ((Y)) with a lesser degree zigzag structure towards $2647.06- $2522.95 blue box area. From where buyers were expected to appear looking for new highs ideally or for a 3 wave bounce minimum.
Google 4 Hour Elliott Wave Chart

This is the latest 4hr Elliott wave Chart from the 10/11/2021 update. In which the stock is showing a strong reaction higher taking place from the blue box area at $2647.06- $2522.95. Right after ending the double three corrections within the blue box area. Allowed members to create a risk-free position shortly after taking the long positions at the blue box area. However, a break above $2925.08 high is still needed to confirm the next extension higher & avoid double correction lower.
Source: https://elliottwave-forecast.com/stock-market/google-buying-dip-blue-box-area/
Post automatically merged:
$FXC Canadian Dollar Trust Long Term Elliott Wave & Cycles
Firstly the FXC instrument inception date was 6/26/2006. The instrument tracks changes of the value of the Canadian dollar relative to the U.S. dollar. It increases in value when the Loonie strengthens and declines when the dollar appreciates. In January 2002 the USDCAD forex pair made an all time high at 1.6184. Then it saw a decline into the November 2007 lows at .9059 where it is thought to have ended correcting the cycle up from the all time lows. That translates to the 113.02 price high from November 2007 in FXC. This is where the analysis begins on the FXC monthly chart shown below. The analysis continues below the FXC Monthly chart.
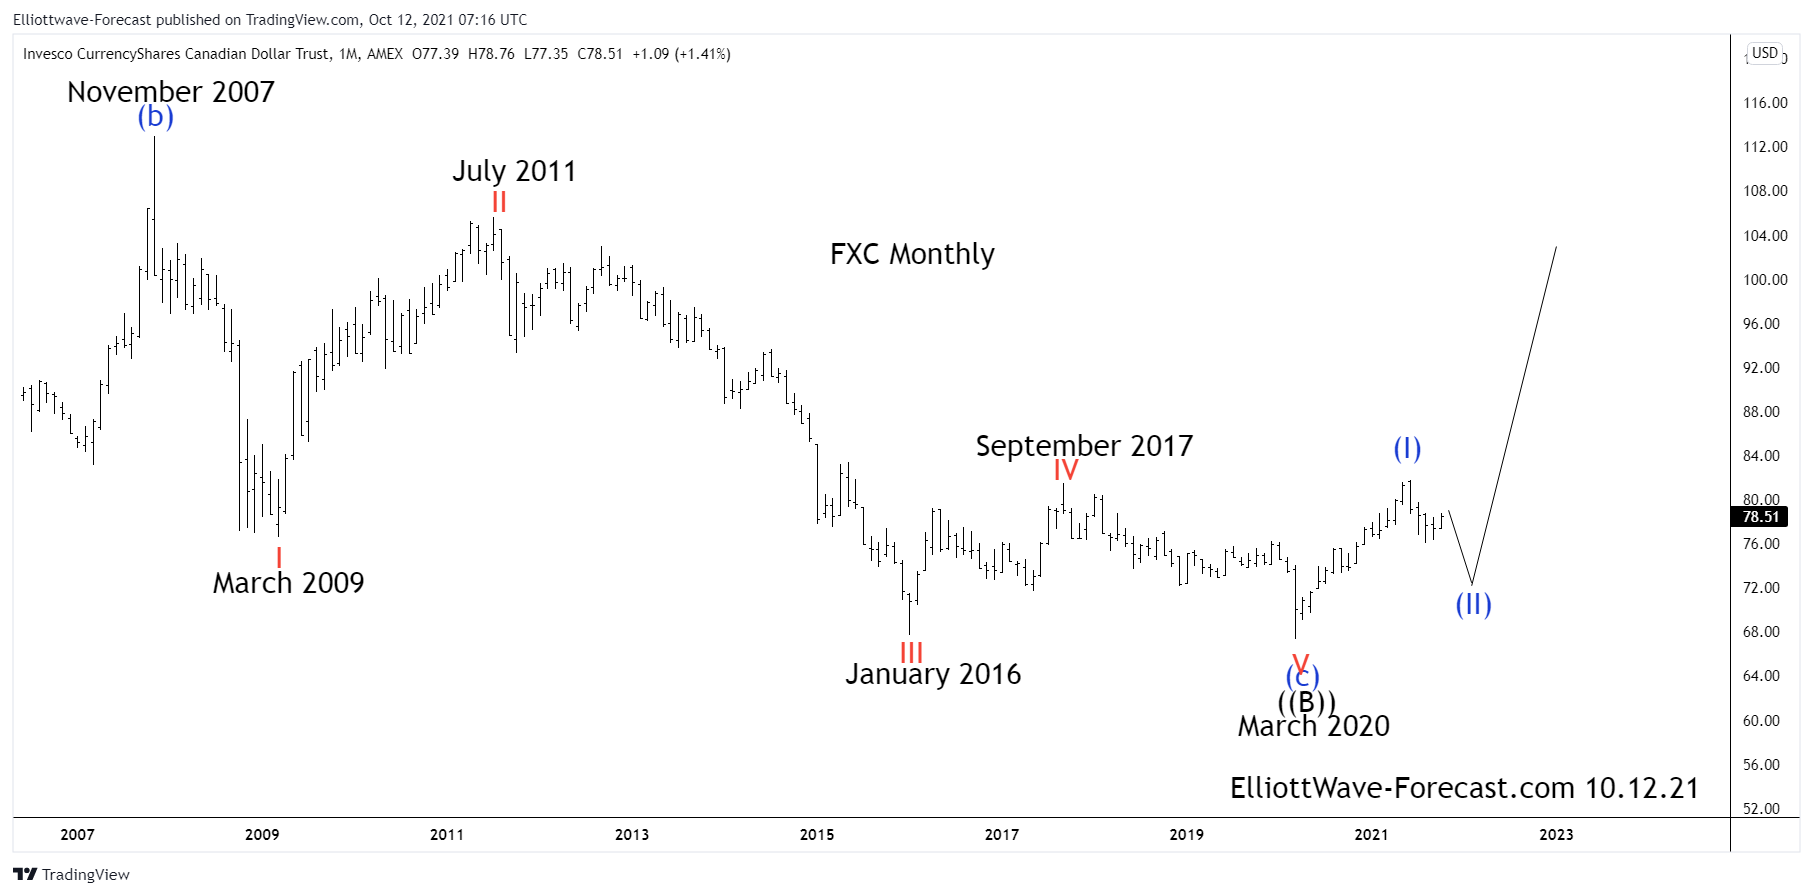
Secondly as previously suggested the FXC instrument mirrors USDCAD price highs and lows inversely. The decline from the November 2007 highs in FXC appears to be a complete Elliott Wave five wave impulse although it does have some price overlap as would a diagonal. The wave III ended in January 2016 then saw a zig zag wave structure in wave IV that ended in September 2017 correct the cycle from the July 2011 wave II highs.
In conclusion: As the chart suggests, the instrument appears ended a larger cycle lower in wave V of (C) to complete a flat wave ((B)) in March 2020. The bounce from there can be corrected while below the June 1st 2021 highs. The pullback area for the wave (II) in blue is pending at the moment however while it's below 78.76 it can see the 72.92-69.47 area as it corrects the cycle up from the March 2020 lows. While above the March 2020 lows it should resume higher again.
Source: https://elliottwave-forecast.com/st...n-dollar-trust-long-term-elliott-wave-cycles/
Post automatically merged:
$SMH Semiconductors Long Term Cycles & Elliott Wave
Firstly as seen on the monthly chart shown below. There is data back to May 2000 in the ETF fund. Data suggests the fund made a low in November 2008. This low has not been taken out in price. The cycles in this instrument tends to reflect the Nasdaq index fairly well. However it has a larger degree difference in that the Nasdaq made a low to correct the cycle from the all time lows in October 2002 compared to the low made in November 2008 in the SMH semiconductors.
Secondly every way I count this data it suggests several things. Several counts are always possible however the wave (III) in red & blue are still in progress as per the best reading of the cycles.
The analysis continues below the monthly chart.
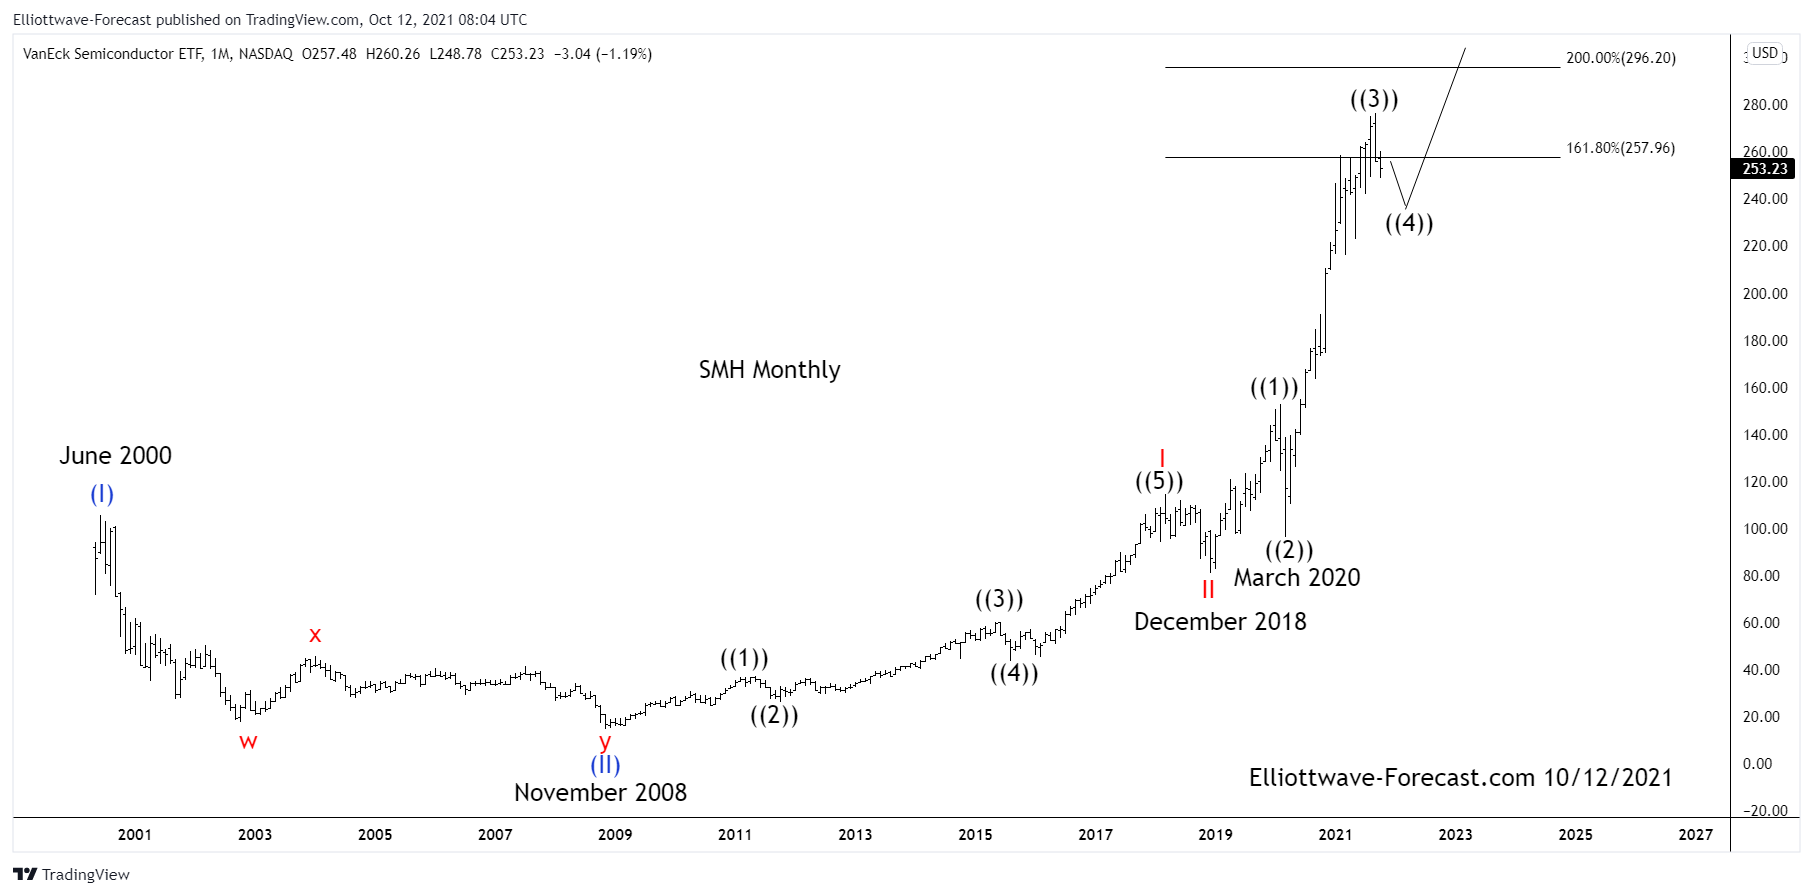
Thirdly it appears a wave ((3)) can have already ended and the instrument can relatively soon end an Elliott Wave ((4)) pullback to correct the cycle from the March 2020 lows. The wave ((4)) should see only around a .236 to .382 retracement of the wave ((3)) before turning higher again in wave ((5)) of III.
In conclusion. It appears the pullback in wave ((2)) to the March 2020 lows corrected the cycle up from the red wave II lows from December 2018. I always like to give the trend benefit of the doubt. In this case it should be obvious the trend is higher. The longer term lows highlighted on the chart suggest the SMH should trade higher. This while pullbacks are shallow and show they will remain above the March 2020 lows. Furthermore importantly while it's above the December 2018 lows according to the price data currently available.
Source: https://elliottwave-forecast.com/stock-market/smh-semiconductors-long-term-cycles-elliott-wave-2/
The last time I covered this stock (article here) I was looking for a bit more upside to take place before pulling back. The market decided the larger pullback was happening sooner than anticipated. So lets take a look at the new view.
It should be noted that there are some company events taking place this month, notably, the $TYDE share dividend spin off. This event is happening later this month and may be providing a catalyst for the coming weeks ahead.

The view remains largely the same for Vinco Ventures, as the last time I looked at the chart. The bigger change is that a larger pullback has taken place in Red IV. The IV low is favoured to be set on Oct 6/2021 @ 4.77 low. Right now, a 5 waves move higher into ((1)) is favoured to take place. Currently the advance from the Oct 6 low is favoured to be in the middle of a wave 3 advance. After ((1)) and ((2)) are set the stock should be ready for a larger wave ((3)) higher.
With these meme stocks, it is important to expect extreme volatility, and to use correct position sizing.
Source: https://elliottwave-forecast.com/stock-market/vinco-ventures-bbig-ready-next-leg-higher/
Silver related symbols including Silver Funds and ETFs have been trading lower since the peak around either 08.06.2020 or 02.01.2021. Most of them have taken a different Elliott wave structure, some have been doing an Elliott wave FLAT like $XAGUSD and some are doing a simple ABC (5-3-5) structure like SIL. The group advanced in five waves since the lows at 03.2020, and as per Elliott Wave Theory after a 5 waves advance, a pullback in three, seven or eleven swings take place. Let's look at the chart below:

Chart above shows the Famous Elliott Wave Pattern which shows five waves advance and consequently three waves pullback.

Instrument is showing the advance since the lows at 03.2020 labeled as five waves and also showing the pullback since the peak at 08.06.2020. The subdivisions are clear, and we can see the ABC pullback which has reached the area where buyers are expected to enter the market. The Blue Box area is when most of the times an ABC structure ends provided it stays above the 1.618% Fibonacci extension level. In case, the pullback breaks the 1.618%, then the decline will turn into an impulse which should complete just wave ((A)). Then there should be a bounce in wave ((B)) and another leg lower in wave ((C)) consequently turning into a larger ABC structure.

Thee Chart above shows the swing sequence of the decline from the peak at 08.2020. Corrective sequences run in three, seven or eleven swings when correcting. As we can see from 08.06.2020, we see eleven swings in black, and three swings in red to the Blue Box buying area. The moment the Blue Box is reached, the move can end at any moment but as of right now, we do not have any indications of the move being over. We have a very technical and well-defined entry in the ETF but also a very clear warning to Silver ($XAGUSD) shorts. The moment $SIL ends the cycle from 08.06.2021, Silver will end its own correction and a multi-month or a multi-year rally will start.
Source: https://elliottwave-forecast.com/video-blog/sil-silver-miners-etf-warning-silver-shorts/
It should be noted that there are some company events taking place this month, notably, the $TYDE share dividend spin off. This event is happening later this month and may be providing a catalyst for the coming weeks ahead.
Vinco Ventures Ellliottwave View:

The view remains largely the same for Vinco Ventures, as the last time I looked at the chart. The bigger change is that a larger pullback has taken place in Red IV. The IV low is favoured to be set on Oct 6/2021 @ 4.77 low. Right now, a 5 waves move higher into ((1)) is favoured to take place. Currently the advance from the Oct 6 low is favoured to be in the middle of a wave 3 advance. After ((1)) and ((2)) are set the stock should be ready for a larger wave ((3)) higher.
With these meme stocks, it is important to expect extreme volatility, and to use correct position sizing.
Source: https://elliottwave-forecast.com/stock-market/vinco-ventures-bbig-ready-next-leg-higher/
Post automatically merged:
Silver related symbols including Silver Funds and ETFs have been trading lower since the peak around either 08.06.2020 or 02.01.2021. Most of them have taken a different Elliott wave structure, some have been doing an Elliott wave FLAT like $XAGUSD and some are doing a simple ABC (5-3-5) structure like SIL. The group advanced in five waves since the lows at 03.2020, and as per Elliott Wave Theory after a 5 waves advance, a pullback in three, seven or eleven swings take place. Let's look at the chart below:

Chart above shows the Famous Elliott Wave Pattern which shows five waves advance and consequently three waves pullback.
SIL (GLOBAL X SILVER MINERS ETF) Daily Elliott Wave Chart
$SIL is showing the above-mentioned Elliott Wave Structure of five waves higher, and then three waves pullback.
Instrument is showing the advance since the lows at 03.2020 labeled as five waves and also showing the pullback since the peak at 08.06.2020. The subdivisions are clear, and we can see the ABC pullback which has reached the area where buyers are expected to enter the market. The Blue Box area is when most of the times an ABC structure ends provided it stays above the 1.618% Fibonacci extension level. In case, the pullback breaks the 1.618%, then the decline will turn into an impulse which should complete just wave ((A)). Then there should be a bounce in wave ((B)) and another leg lower in wave ((C)) consequently turning into a larger ABC structure.
SIL (GLOBAL X SILVER MINERS ETF) Swing Sequence Chart

Thee Chart above shows the swing sequence of the decline from the peak at 08.2020. Corrective sequences run in three, seven or eleven swings when correcting. As we can see from 08.06.2020, we see eleven swings in black, and three swings in red to the Blue Box buying area. The moment the Blue Box is reached, the move can end at any moment but as of right now, we do not have any indications of the move being over. We have a very technical and well-defined entry in the ETF but also a very clear warning to Silver ($XAGUSD) shorts. The moment $SIL ends the cycle from 08.06.2021, Silver will end its own correction and a multi-month or a multi-year rally will start.
Source: https://elliottwave-forecast.com/video-blog/sil-silver-miners-etf-warning-silver-shorts/
NASDAQ is another instrument that has given us good trading opportunity lately . The index is showing impulsive and clear bullish trend that is calling for continuation of the rally. Recently it made clear 7 swings pull back and found buyers at the blue box as we were expecting . Pull back unfolded as Elliott Wave Double Three Pattern. In this technical blog we’re going to take a quick look at the charts of $NQ_F published in members area of the website and explain the Elliott Wave structure and trading strategy.
Before we take a look at the real market example, let’s explain Elliott Wave Double Three pattern.
The picture below presents what Elliott Wave Double Three pattern looks like. It has (W),(X),(Y) labeling and 3,3,3 inner structure, which means all of these 3 legs are corrective sequences. Each (W) and (Y) are made of 3 swings , they’re having A,B,C structure in lower degree, or alternatively they can have W,X,Y labeling

As the main trend is bullish we expect buyers to appear at the blue box for 3 waves bounce at least. Once bounce reaches 50 Fibs against the X red high, we will make long position risk free ( put SL at BE). Invalidation for the trade would be break below 1.618 fibs extension: 13940.5. As our members know, Blue Boxes are no enemy areas , giving us 85% chance to get a bounce.
You can learn more about Elliott Wave Double Three Patterns at our Free Elliott Wave Educational Web Page.

Keep in mind that market is dynamic and presented view could have changed in the mean time. You can check most recent charts in the membership area of the site. Best instruments to trade are those having incomplete bullish or bearish swings sequences. We put them in Sequence Report and best among them are shown in the Live Trading Room.

Elliott Wave Forecast
Source: https://elliottwave-forecast.com/trading/nasdaq-nq_f-elliott-wave-double-three/
An overlay of Yen pairs below show that they clearly share the same cycle.

The chart above shows that all Yen pairs made major low on March 18, 2020. From there, they all rally together. In the past two weeks, we have seen several Yen pairs breaking to new high above May 2021 high suggesting that the next leg higher has started. Short term, we should see further upside in the Yen pairs and it can last until the end of the year. A more important question however is whether the extension higher is a new bullish cycle or still part of the cycle from March 2020 low. Let's look at the charts below and consider the two options:

CADJPY last week broke above May 2021 low and one possibility is to consider the breakout as wave ((5)) from March 18, 2020 low. In this scenario, we should see pair extending higher in short term to complete wave ((5)) which then should end wave I in higher degree. Afterwards, we could see a larger pullback in 3, 7, or 11 swing to correct the entire rally from March 18, 2020 low. In the near term, while pullback stays above 84.7, expect pair to extend higher.

The chart above shows the second scenario if the breakout is a new bullish cycle. In this scenario, CADJPY and thus all other Yen pairs will be even more bullish than the first scenario as it starts a new bullish cycle in wave III. Wave II low at 84.7 on August 20 in this case will become an important low and any subsequent dips will continue to find buyers in 3, 7, or 11 swing against this level.
The two scenarios in CADJPY above should apply to all other Yen pairs. We can either extend within wave ((5)) from March 2020 low which is less bullish scenario. Or we can also start a new bullish cycle which is very bullish. In the near term, both options suggest we would see further upside still.
Source: https://elliottwave-forecast.com/forex/yen-pairs-started-next-leg-higher/
All stocks tried to recover what they lost and Berkshire Hathaway was not exception since the crash of March 2020. BRK.B did not only recover the lost, but It also reached historic highs. Now, it is building an impulse from March 2020 lows and we are going to follow to determinate the best area to complete the impulse.
 As we see in this daily chart from April, The wave ((1)) ended and the structure could be rare for you because it is not quite common, and it is called an expanding leading diagonal. (If you want to learn more about Elliott Wave Theory, please follow this link: Elliott Wave Theory). I think it is better to manage the structure of Berkshire Hathaway in that way instead of a nest, and this is because comparing some cycles in the market has more sense with the current structures of the market. Then we have a clear (A), (B), (C) correction as wave ((2)) and we called the continuation of wave ((3)) to the upside.

In this daily chart from beginning of September, we were calling one more high to complete wave ((3)); but after a month, the Berkshire Hathaway’s share entered in a ranging stage and it has consumed a lot of time to think that the structure from wave (3) in blue peak it is more likely that is the wave ((4)) of the impulse and we changed the labelling of the chart.
 Then we restructure the impulse and wave ((3)) ended at 295.08. Wave ((4)) pullback ended at 270.73 and we should continue with the bullish momentum. We began the last impulse to complete wave ((5)). In lesser degree wave (1) ended at 291.82 and wave (2) correction ended at 271.36 and we are building wave (3). Near term, we are looking one more high to complete 5 swings up as a leading diagonal wave 1 in red and then a pullback as wave 2 in red before continue with the rally. With the actual structure, we find out the target to complete wave ((5)) comes in 310 – 331 area.
Source: https://elliottwave-forecast.com/stock-market/berkshire-hathaway-target-comes-310-331-area/
Before we take a look at the real market example, let’s explain Elliott Wave Double Three pattern.
Elliott Wave Double Three Pattern
Double three is the common pattern in the market , also known as 7 swing structure. It’s a reliable pattern which is giving us good trading entries with clearly defined invalidation levels.The picture below presents what Elliott Wave Double Three pattern looks like. It has (W),(X),(Y) labeling and 3,3,3 inner structure, which means all of these 3 legs are corrective sequences. Each (W) and (Y) are made of 3 swings , they’re having A,B,C structure in lower degree, or alternatively they can have W,X,Y labeling

Now let's take a look what Elliott Wave Double Three looks like in a real market.NASDAQ Elliott Wave 4 Hour Chart 9.30.2021
Current view suggests Nasdaq is doing (4) blue correction that is unfolding as Elliott Wave Double Three Pattern with WXY red inner labeling. First leg W is showing corrective sequences - 3 waves down ((a))((b))((c)). Then we got 3 waves bounce in X red finally doing Y red that also should have corrective sequences. Pull back looks incomplete at the moment. We believe ((a)) of Y should be ending as 5 waves. Wave ((b)) bounce should happen soon, which will be 6th swing of (4) correction. Then as far as X red pivot stays intact, we would be expecting another leg down ( 7th swing) toward extreme zone : 14498.2-13940.5 area.As the main trend is bullish we expect buyers to appear at the blue box for 3 waves bounce at least. Once bounce reaches 50 Fibs against the X red high, we will make long position risk free ( put SL at BE). Invalidation for the trade would be break below 1.618 fibs extension: 13940.5. As our members know, Blue Boxes are no enemy areas , giving us 85% chance to get a bounce.
You can learn more about Elliott Wave Double Three Patterns at our Free Elliott Wave Educational Web Page.

NASDAQ Elliott Wave 4 Hour Chart 10.17.2021
Eventually we got ((b)) bounce and another leg down as expected. Buyers appeared at the blue box and we are getting good reaction from there. The rally from the blue box reached and exceeded 50 fibs against the X red connector. As a result members who took long positions are enjoying profits in a risk free positions. As far as the price stays above current low : 14372.5, we can consider (4) pull back done as Elliott Wave Double Three Pattern.Keep in mind that market is dynamic and presented view could have changed in the mean time. You can check most recent charts in the membership area of the site. Best instruments to trade are those having incomplete bullish or bearish swings sequences. We put them in Sequence Report and best among them are shown in the Live Trading Room.

Elliott Wave Forecast
Source: https://elliottwave-forecast.com/trading/nasdaq-nq_f-elliott-wave-double-three/
Post automatically merged:
An overlay of Yen pairs below show that they clearly share the same cycle.
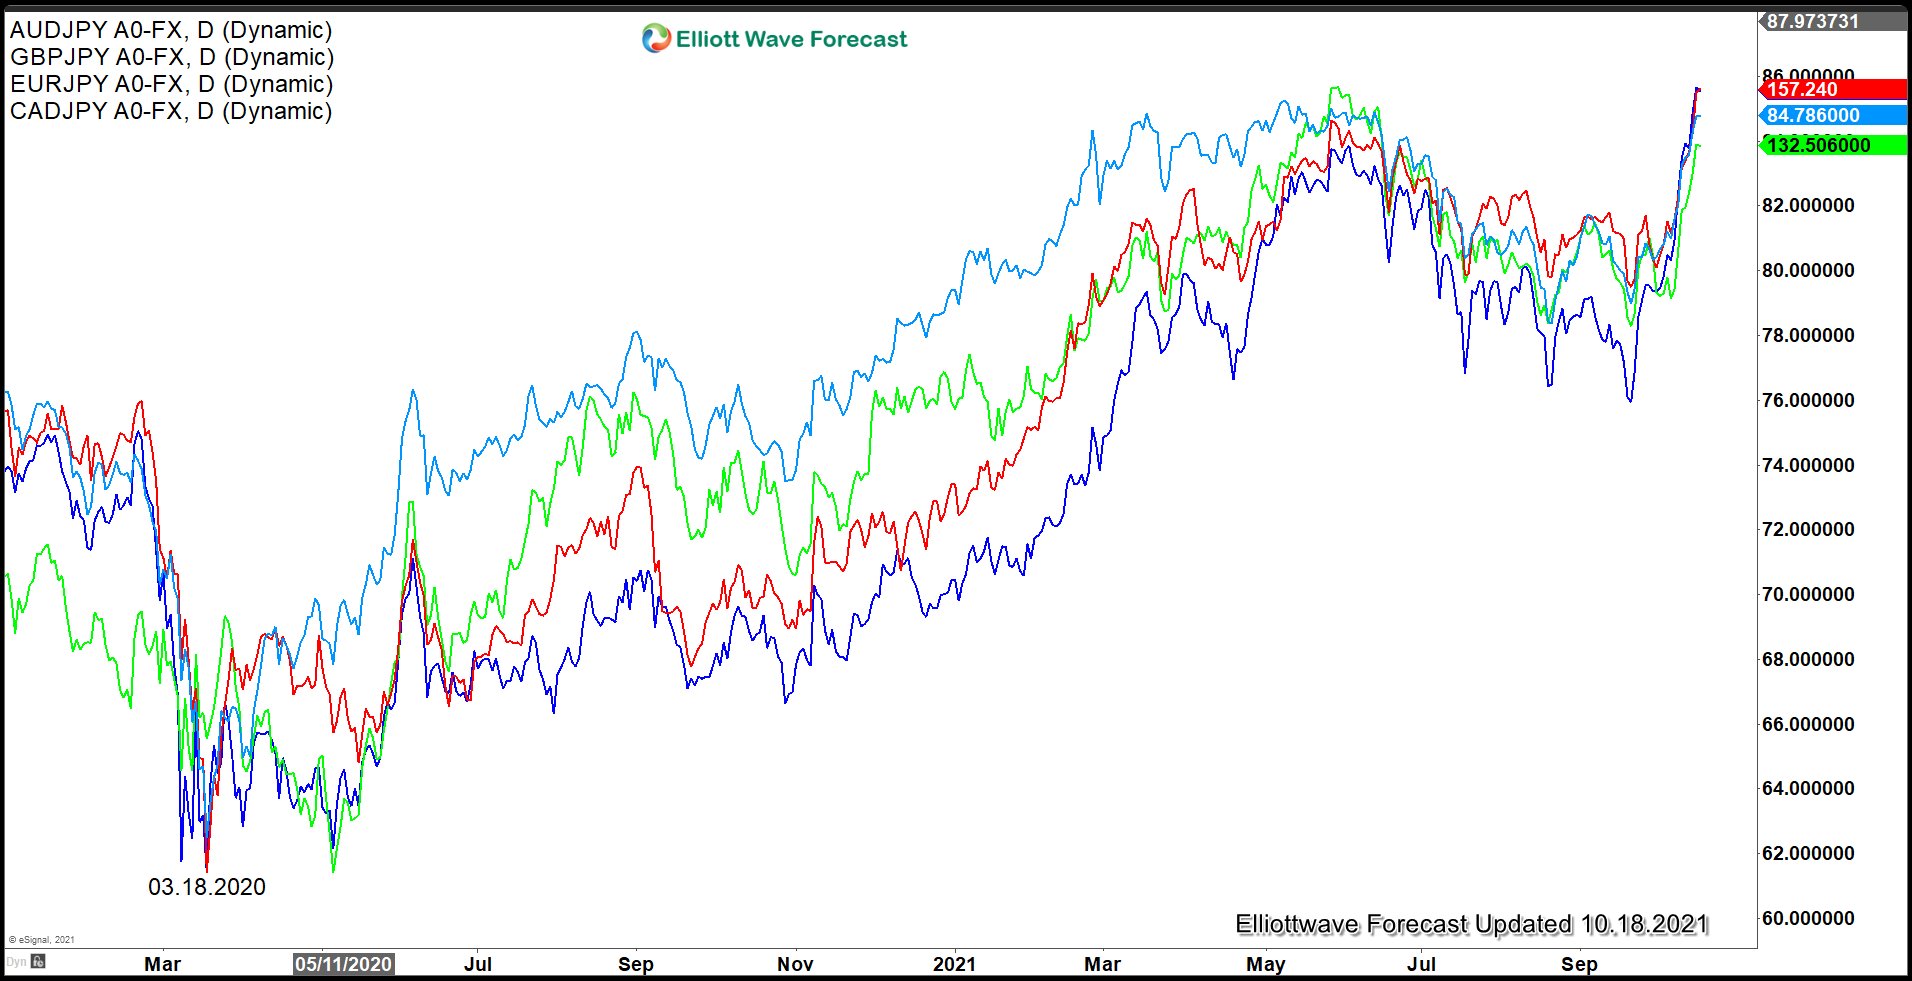
The chart above shows that all Yen pairs made major low on March 18, 2020. From there, they all rally together. In the past two weeks, we have seen several Yen pairs breaking to new high above May 2021 high suggesting that the next leg higher has started. Short term, we should see further upside in the Yen pairs and it can last until the end of the year. A more important question however is whether the extension higher is a new bullish cycle or still part of the cycle from March 2020 low. Let's look at the charts below and consider the two options:
CADJPY Scenario 1: Break Higher is Extension from March 2020 Low
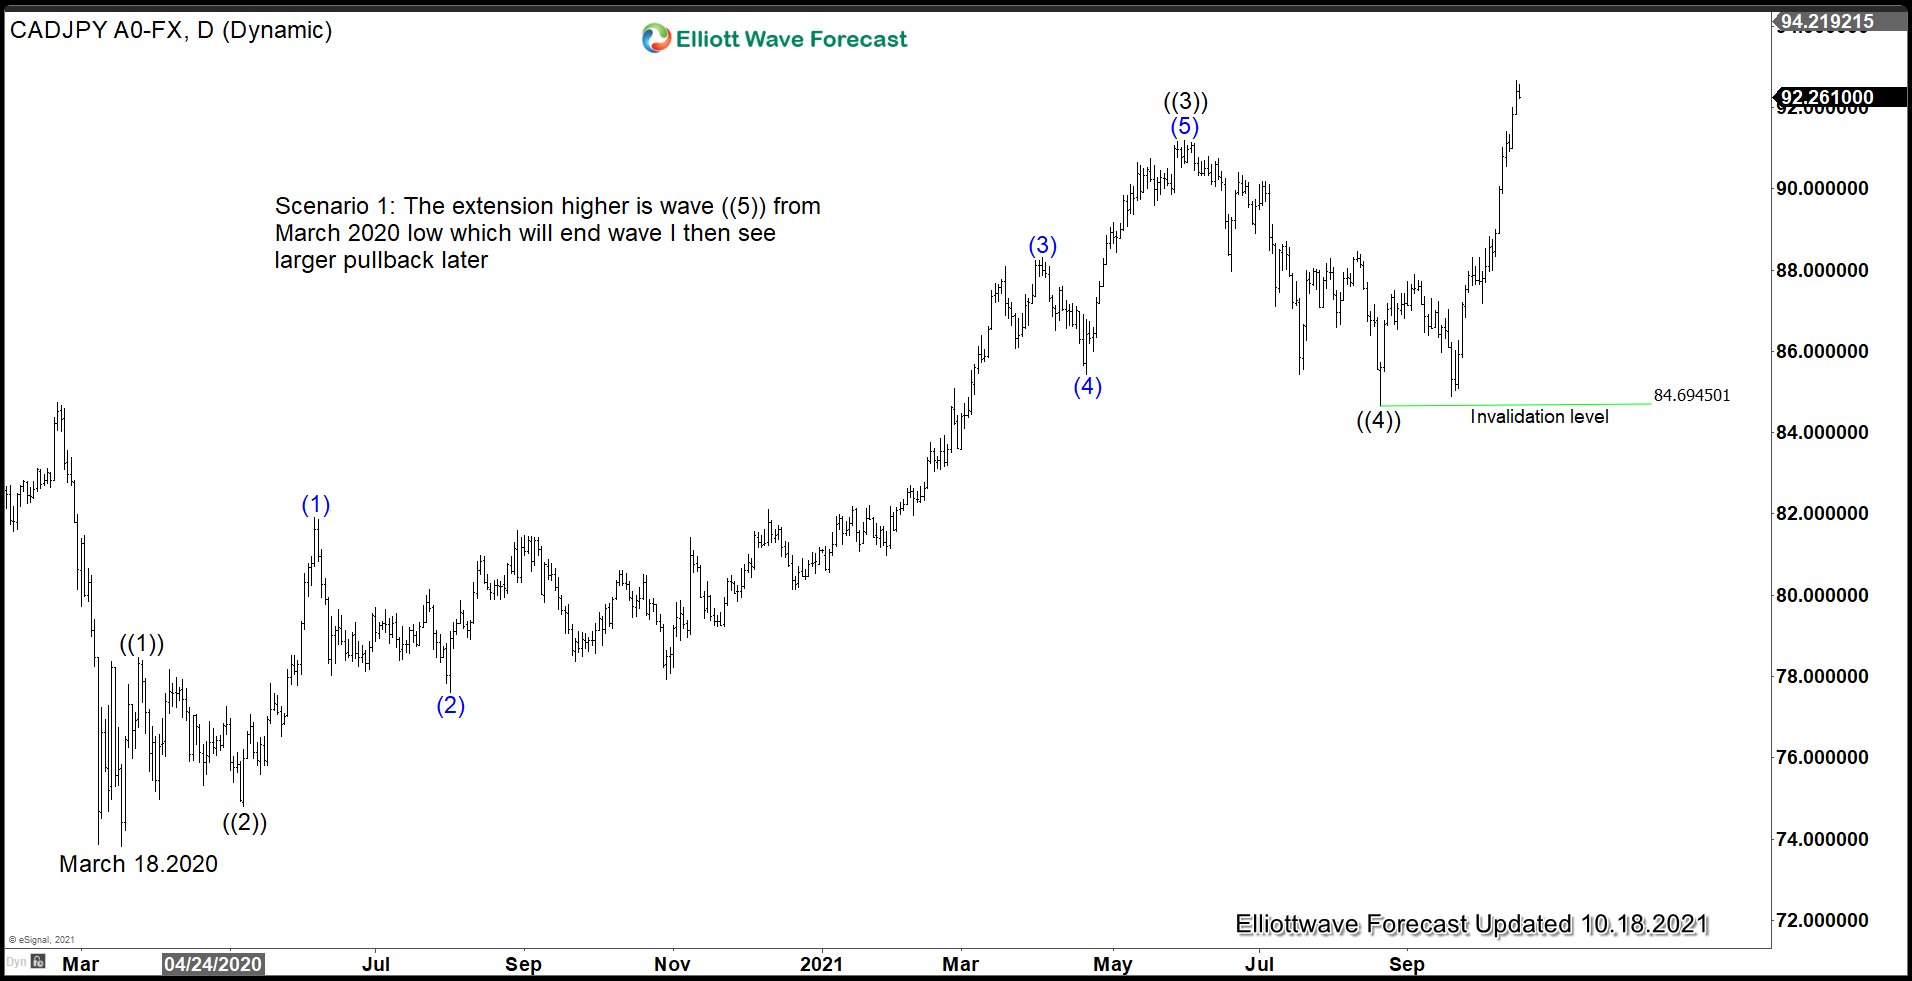
CADJPY last week broke above May 2021 low and one possibility is to consider the breakout as wave ((5)) from March 18, 2020 low. In this scenario, we should see pair extending higher in short term to complete wave ((5)) which then should end wave I in higher degree. Afterwards, we could see a larger pullback in 3, 7, or 11 swing to correct the entire rally from March 18, 2020 low. In the near term, while pullback stays above 84.7, expect pair to extend higher.
CADJPY Scenario 2: Break Higher is a New Bullish Cycle
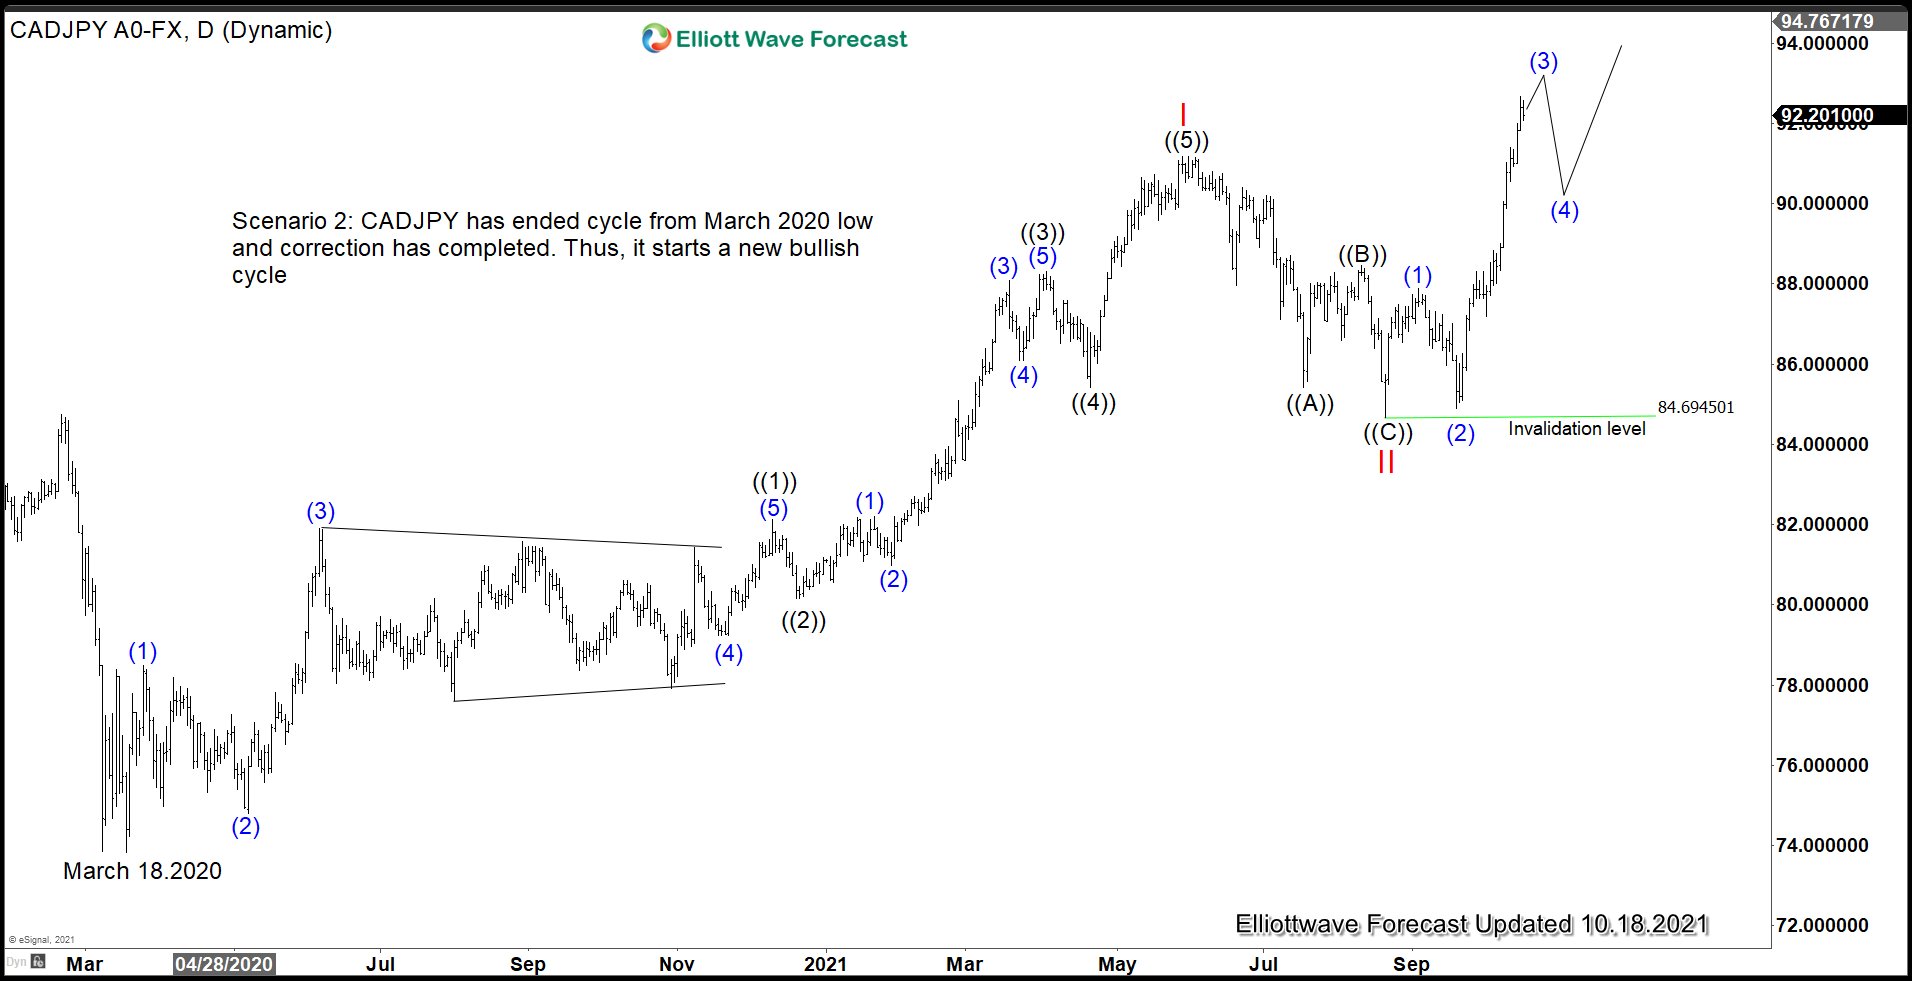
The chart above shows the second scenario if the breakout is a new bullish cycle. In this scenario, CADJPY and thus all other Yen pairs will be even more bullish than the first scenario as it starts a new bullish cycle in wave III. Wave II low at 84.7 on August 20 in this case will become an important low and any subsequent dips will continue to find buyers in 3, 7, or 11 swing against this level.
The two scenarios in CADJPY above should apply to all other Yen pairs. We can either extend within wave ((5)) from March 2020 low which is less bullish scenario. Or we can also start a new bullish cycle which is very bullish. In the near term, both options suggest we would see further upside still.
Source: https://elliottwave-forecast.com/forex/yen-pairs-started-next-leg-higher/
Post automatically merged:
All stocks tried to recover what they lost and Berkshire Hathaway was not exception since the crash of March 2020. BRK.B did not only recover the lost, but It also reached historic highs. Now, it is building an impulse from March 2020 lows and we are going to follow to determinate the best area to complete the impulse.
Berkshire Hathaway Old Daily Chart
 As we see in this daily chart from April, The wave ((1)) ended and the structure could be rare for you because it is not quite common, and it is called an expanding leading diagonal. (If you want to learn more about Elliott Wave Theory, please follow this link: Elliott Wave Theory). I think it is better to manage the structure of Berkshire Hathaway in that way instead of a nest, and this is because comparing some cycles in the market has more sense with the current structures of the market. Then we have a clear (A), (B), (C) correction as wave ((2)) and we called the continuation of wave ((3)) to the upside.
Berkshire Hathaway Old Daily Chart

In this daily chart from beginning of September, we were calling one more high to complete wave ((3)); but after a month, the Berkshire Hathaway’s share entered in a ranging stage and it has consumed a lot of time to think that the structure from wave (3) in blue peak it is more likely that is the wave ((4)) of the impulse and we changed the labelling of the chart.
Berkshire Hathaway Daily Chart
 Then we restructure the impulse and wave ((3)) ended at 295.08. Wave ((4)) pullback ended at 270.73 and we should continue with the bullish momentum. We began the last impulse to complete wave ((5)). In lesser degree wave (1) ended at 291.82 and wave (2) correction ended at 271.36 and we are building wave (3). Near term, we are looking one more high to complete 5 swings up as a leading diagonal wave 1 in red and then a pullback as wave 2 in red before continue with the rally. With the actual structure, we find out the target to complete wave ((5)) comes in 310 – 331 area.
Source: https://elliottwave-forecast.com/stock-market/berkshire-hathaway-target-comes-310-331-area/
Marathon Oil Corporation ( MRO ) is from Energy sector working as Independent Oil & Gas Exploration & Production. MRO is headquartered in Houston, Texas. It trades under MRO ticker at NYSE.
MRO made all time low Since 1969 during Covid pandemic sell off at $3.02 low on 4/01/2020. Thereafter it started higher high sequence. Currently it is trading at $16.18 as closing price in last trading session. Since the ATL, It made the higher high sequence along with Energy sector & started out-performing since 8/20/2021 low. It is having (3) wave extension of ((3)) wave extension within impulse.

2-Hour Elliott Wave Analysis - MRO from 8/20/2021 low
In 2 hour, MRO favored ended 3 minor degree at $16.60 high & 4 proposed ended at $15.40 low as 0.236 retracement against 3. While above $15.40 low, it expect to extend higher in 5 of (3) towards $16.90 or slightly higher levels. As far as it is outperforming the sector, it can extend higher up to $17.40 level or even higher. Once the primary cycle ends, we can see the larger pullback against the sequence started from April-2020 low.

Source: https://elliottwave-forecast.com/stock-market/elliott-wave-view-mro-extend-higher/
MRO made all time low Since 1969 during Covid pandemic sell off at $3.02 low on 4/01/2020. Thereafter it started higher high sequence. Currently it is trading at $16.18 as closing price in last trading session. Since the ATL, It made the higher high sequence along with Energy sector & started out-performing since 8/20/2021 low. It is having (3) wave extension of ((3)) wave extension within impulse.
Daily Elliott Wave View - MRO from 4/01/2020 Low:
From 4/01/2020 low, it started the primary degree ((1)) that ended at $8.48 high on 6/08/2020. While ((2)) ended at $3.73 low on 10/29/2020. The ((2)) was 0.854 retracement of ((1)) as dip correction. Thereafter the nest structure in wave ((3)) extension started which ended at $14.33 high on 7/01/2021 in 13 swings. The ((4)) ended at $10.41 low on 8/20/2021 at 0.382 retracement against ((3)). 0.382 is the common Fibonacci retracement level for wave four correction. Currently it is in ((5)) and expected to make two more highs within the cycle before any larger pullback unfold. The following chart shows the daily sequence started from 4/01/2020 low.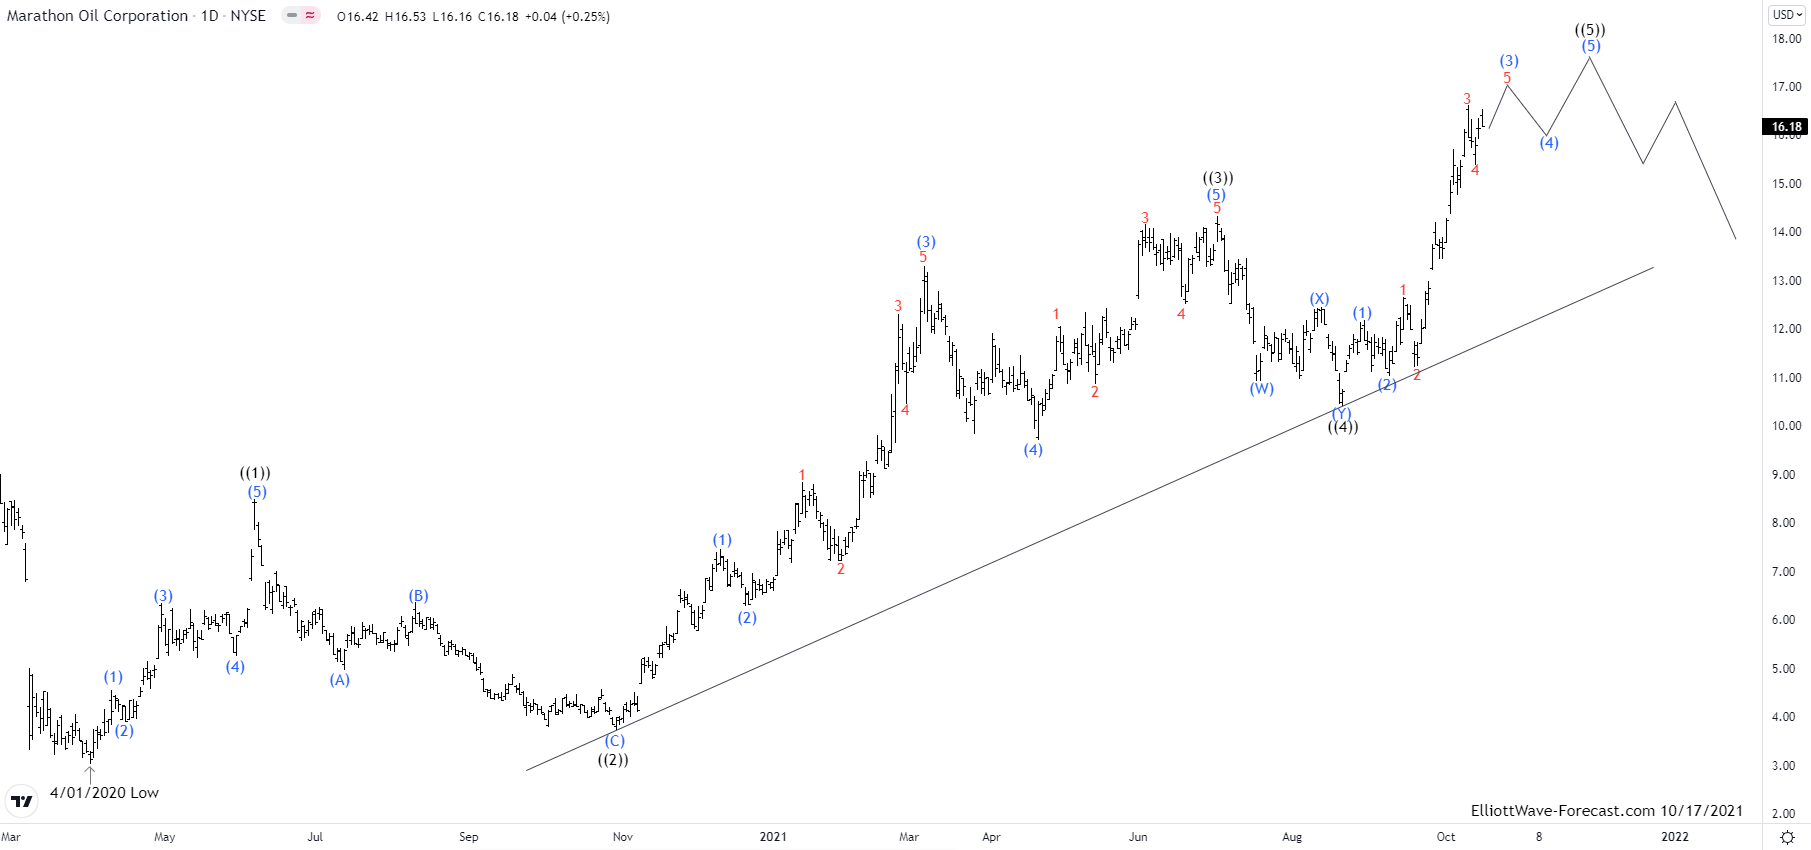
2-Hour Elliott Wave Analysis - MRO from 8/20/2021 low
In 2 hour, MRO favored ended 3 minor degree at $16.60 high & 4 proposed ended at $15.40 low as 0.236 retracement against 3. While above $15.40 low, it expect to extend higher in 5 of (3) towards $16.90 or slightly higher levels. As far as it is outperforming the sector, it can extend higher up to $17.40 level or even higher. Once the primary cycle ends, we can see the larger pullback against the sequence started from April-2020 low.
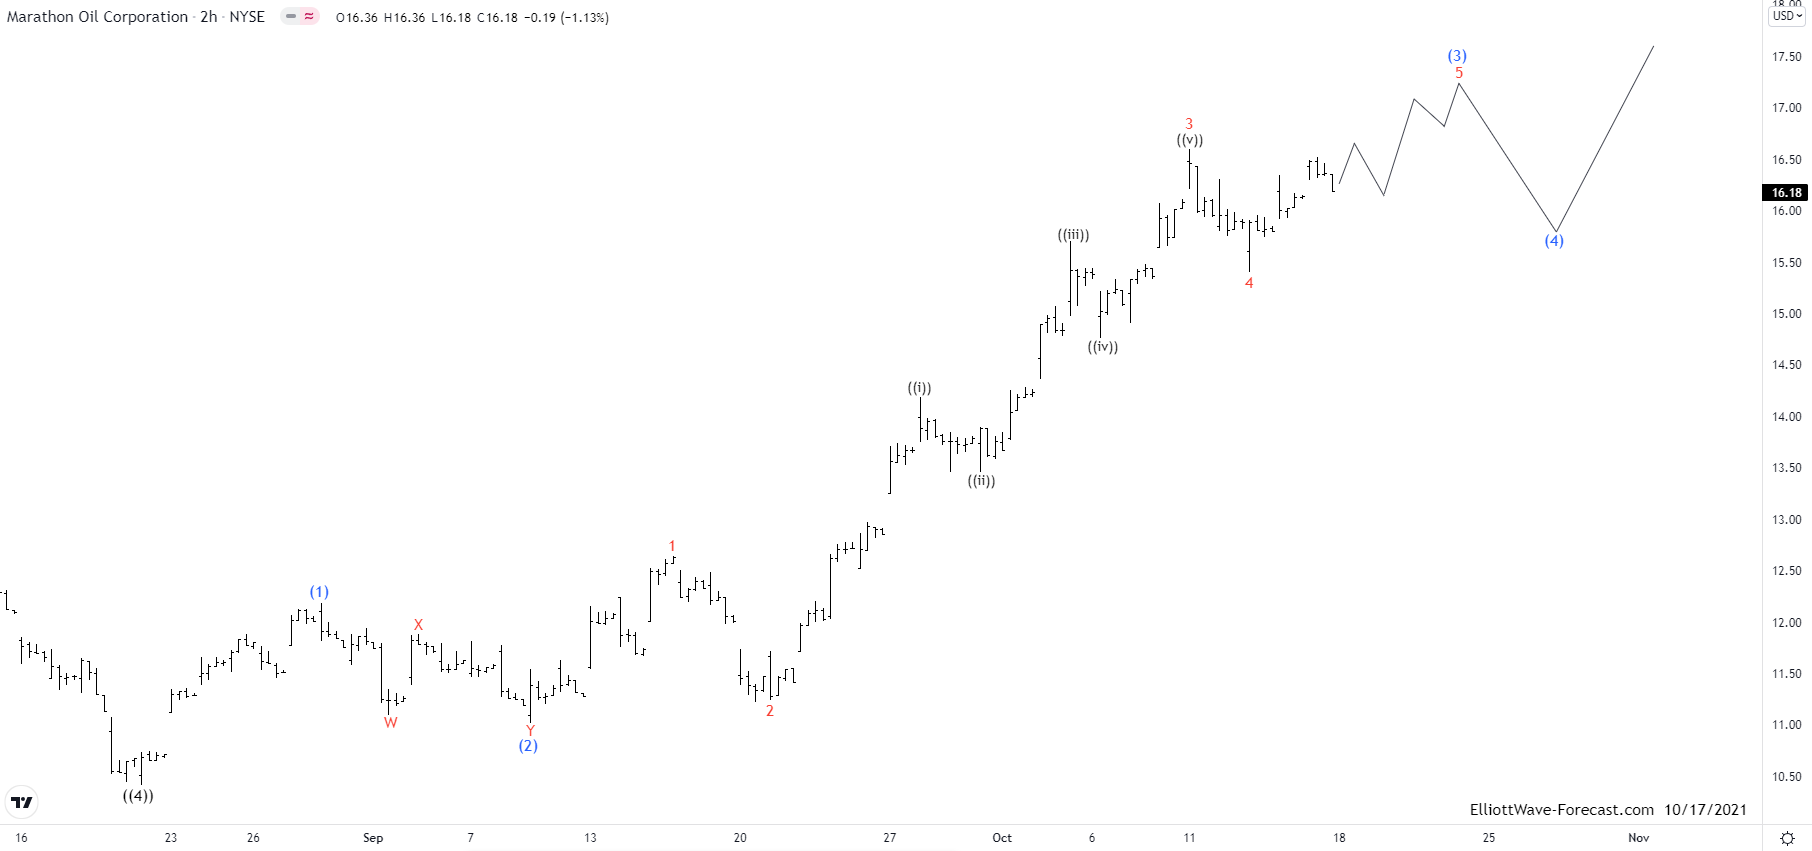
Source: https://elliottwave-forecast.com/stock-market/elliott-wave-view-mro-extend-higher/
Fresenius Medical Care is a German healthcare company. It is one of the four devisions of Fresenius SE & Co. KGaA. The company provides kidney dialysis services and treats end-stage renal disease. Today, it has 38% share of the dialysis market in the US. Fresenius Medical Care operates 45 production sites, mainly in the US, Germany and Japan. Founded in 1996 and headquartered in Bad Homburg vor der Höhe, Germany, Fresenius Medical Care is a part of DAX40 index. One can trade it under the ticker $FME at XETRA.
From the February 2018 high, a consolidation has started and is still in progress. First, a cycle lower in 3 waves has ended in January 2019. Then, from the 55.44 low a rally has failed to make a new high. After 3 waves of blue wave (x) ending in February 2020 at 81.10, $FME has broken below 55.44 low. As a matter of fact, this has opened a bearish sequence. As a consequence, while the price holds below 81.10, one should expect $FME to trade lower into the 42.67-18.87 area.
Investors and traders can buy Fresenius medical care from 42.67-18.87 area expecting a long-term rally to the new highs. The target in the black wave ((III)) will be towards 136-194 area in case of reaction from 42.67 level.

Source: https://elliottwave-forecast.com/stock-market/fme-fresenius-medical-care/
$FXF Longer Term Elliott Wave Analysis & Cycles
Firstly there is data back to when the ETF fund began in 2006 as low as 78.43. Data correlated in the USDCHF foreign exchange pair suggests the FXF high in August 2011 is also the lows of a cycle lower from the all time in the USDCHF. In this instrument there is data available back to 1971 when the exchange rate was 4.3180.
The FXF instrument reflects the price swings of the currency pretty well since inception and as previously mentioned the instrument made a high in August 2011. This where the analysis begins on the monthly chart shown below. The correction from those highs appears to be a an Elliott Wave double three structure. The analysis continues below the monthly chart.

Secondly, as earlier mentioned the decline from the August 2011 highs appears to be an Elliott Wave double three structure. In the second swing of a double three Elliott Wave structure, it generally will reach a price where it is equal to the first swing. When a cycle ends it will show in momentum indicators usually before price makes it obvious. These cycle highs and lows are in the blue color as shown on the chart above (w)-(x). The correction of the January 2015 cycle ended January 2021 in wave b (red). While a bounce remains below there it can see the 70.95 area before a larger bounce higher.
I will mention how this target area lower is obtained in conclusion. Take a Fibonacci extension tool on your chart platform. Beginning at the August 2011 highs as point 1, trace down to the January 2015 lows where the blue (w) is for point 2. Now trace back up to January 2015 blue wave (x) highs for point 3. This will give the equal legs area for (y) (not shown) at 70.95.
Source: https://elliottwave-forecast.com/stock-market/fxf-longer-term-elliott-wave-analysis-cycles/
$EWC Long Term Elliott Wave Uptrend and Cycles
Firstly the EWC instrument inception date was 3/12/1996. The Canada ETF seeks to track the investment results of an index composed of large and mid-sized companies in Canada. This is of course reflected in the price. The best Elliott Wave reading of the long term cycles presume some lower prices that did not exist prior to the ETF fund inception date.
Shown on the monthly chart, the bullish cycle from all time lows is believed to have ended in November 2007. This is mostly in line with many other broad based ETF’s and indices that ended larger cycles near that time. Likewise the steep pullback lower into the March 2009 lows replicated the pullbacks in other ETF & indices instruments. This pullback was strong enough to suggest it had corrected the cycle up from the all time lows. The analysis and commentary continues below the monthly chart.

Secondly the bounce from the March 2009 lows has now got back above the November 2007 highs. However this compared to other indices instruments it is lagging. That’s not to say it will not catch up it is just the way it works out. EWC bounces higher as related indices instruments are going higher. However as of lately at a slower pace. Similarly, the instrument corrects cycles in pullbacks lower when the related instruments are doing the same.
The analysis and conclusion as mentioned earlier; Price has got above the November 2007 highs as the above chart shows. The cycles remain bullish nearer term while pullbacks remain above the March 2020 lows. The instrument should proceed higher with the related other countries ETF’s and indices reflecting the improvements in the progression of mankind.
Source: https://elliottwave-forecast.com/stock-market/ewc-long-term-elliott-wave-uptrend-and-cycles/
News Corporation ( NWSA ) is a Media & Information Services company focuses on creating & distributing content worldwide. It operates in different segments like Digital estate services, subscription based video services, Dow Jones services, book publishing, news media & others. It trades under NWSA ticker at Nasdaq.

In Primary view, it started impulse as wave ((1)) from 4/02/2020 low & ended at $15.90 on 9/18/2020 high. The ((2)) wave was 0.382 retracement of previous degree as shallow correction. While above $12.79 low as ((2)), it favored ended ((3)) at $27.97 high on 5/10/2021 with internal (3) wave extension. The ((4)) proposed ended at $21.61 low on 9/20/2021 as 0.382 retracement of previous degree. Above $21.61 low, it expect to extend higher in ((5)) towards $29.51- $31.96 area before any larger pullback against April-2020 low starts.
Alternatively, it finished the impulse sequence from April-2020 low to May-2021 high as I red. And it can see larger pullback in wave II as double correction. The alternate view is presented in below chart. According to which, it favored ended ((W)) at $21.61 low on 9/20/2021. And above there ((X)) expect to extend higher in 3 swings, which should end near $26.07 or slightly higher. Thereafter the next leg lower will start as ((Y)) in double correction. So in both cases, we expect it to extend higher in short term above $26 before the decision time comes.

Source: https://elliottwave-forecast.com/stock-market/elliott-wave-view-nwsa-pullback-supported/
Olin Corporation ( OLN ) manufactures & distributes Chemical products in the US, Europe & other countries. OLN is based in Clayton, Missouri. It trades under OLN ticker at NYSE. It comes under the Basic Materials sector as Specialty Chemicals industry.

It started the primary degree ((1)) from 3/16/2020 low, which ended at $16.57 high on 4/29/2020. While below there it ended ((2)) at $9.67 low on 8/21/2020 as 0.854 retracement against ((1)). Above $9.67 low, it extended higher in ((3)), which ended at $51.04 high on 6/01/2021 as ((3)) wave extension. Generally, the third wave is the most common extension in stock market. Thereafter it pullbacks in ((4)), which ended at $39.90 low on 7/19/2021. ((4)) was slightly pass below 0.236 retracement against wave ((3)).
It confirms the higher high sequence in ((5)), which appears as 3 swings move indicating possible diagonal ((5)) is in progress. In short term, it is progressing in (3) of ((5)) as 3 swings move from $44.30 low as (2) & expect to move inside wedge. It can see two more highs before any larger reaction unfolds against impulse up cycle started from March-2020 low. After finishing (3), it should pull back near lower line of wedge before it rise again in final leg up. After diagonal structure ends, it expect to fall with higher momentum.
Source: https://elliottwave-forecast.com/stock-market/elliott-wave-view-oln-expect-short-term-upside/
Fresenius Medical Care Monthly Elliott Wave Analysis 10.18.2021
The monthly chart below shows the Fresenius Medical Care stock $FME traded at XETRA. From all-time lows, the stock price has developed an Elliott wave motive wave pattern. The cycle up in black wave ((I)) being of grand super cycle degree has ended by printing its top at all-time highs in February 2018 at 93.82. Within the grand super cycle ((I)), the blue wave (III) of super cycle degree is an impulse showing an extension as related to the waves (I) and (V).From the February 2018 high, a consolidation has started and is still in progress. First, a cycle lower in 3 waves has ended in January 2019. Then, from the 55.44 low a rally has failed to make a new high. After 3 waves of blue wave (x) ending in February 2020 at 81.10, $FME has broken below 55.44 low. As a matter of fact, this has opened a bearish sequence. As a consequence, while the price holds below 81.10, one should expect $FME to trade lower into the 42.67-18.87 area.
Investors and traders can buy Fresenius medical care from 42.67-18.87 area expecting a long-term rally to the new highs. The target in the black wave ((III)) will be towards 136-194 area in case of reaction from 42.67 level.

Source: https://elliottwave-forecast.com/stock-market/fme-fresenius-medical-care/
Post automatically merged:
$FXF Longer Term Elliott Wave Analysis & Cycles
Firstly there is data back to when the ETF fund began in 2006 as low as 78.43. Data correlated in the USDCHF foreign exchange pair suggests the FXF high in August 2011 is also the lows of a cycle lower from the all time in the USDCHF. In this instrument there is data available back to 1971 when the exchange rate was 4.3180.
The FXF instrument reflects the price swings of the currency pretty well since inception and as previously mentioned the instrument made a high in August 2011. This where the analysis begins on the monthly chart shown below. The correction from those highs appears to be a an Elliott Wave double three structure. The analysis continues below the monthly chart.
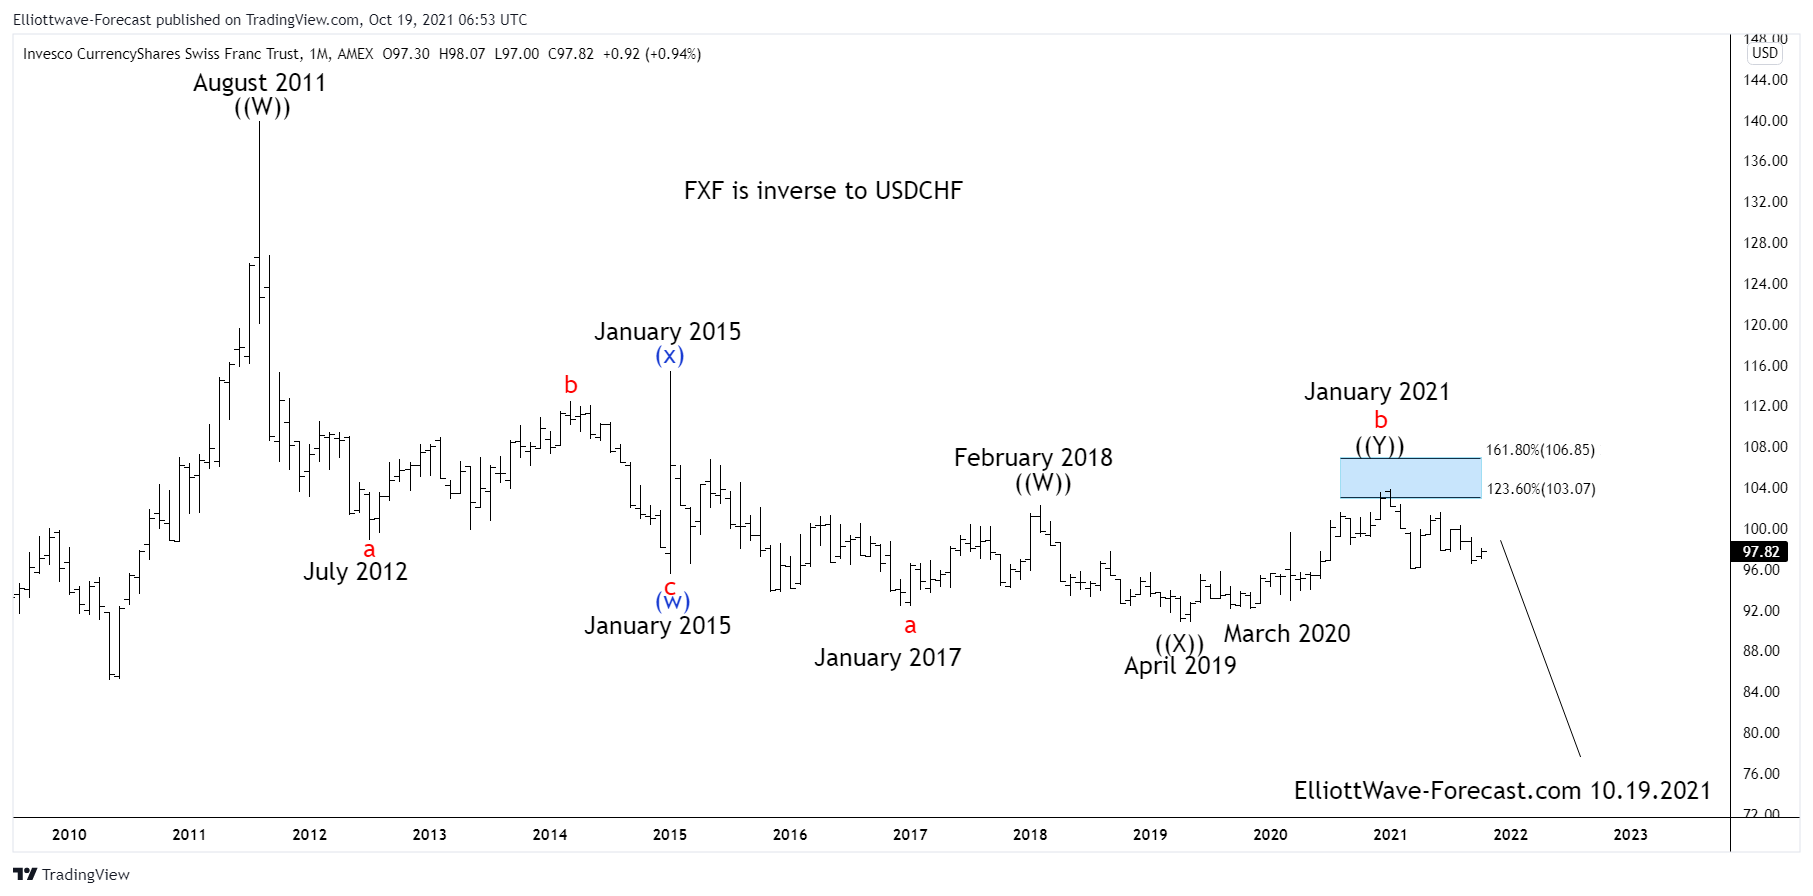
Secondly, as earlier mentioned the decline from the August 2011 highs appears to be an Elliott Wave double three structure. In the second swing of a double three Elliott Wave structure, it generally will reach a price where it is equal to the first swing. When a cycle ends it will show in momentum indicators usually before price makes it obvious. These cycle highs and lows are in the blue color as shown on the chart above (w)-(x). The correction of the January 2015 cycle ended January 2021 in wave b (red). While a bounce remains below there it can see the 70.95 area before a larger bounce higher.
I will mention how this target area lower is obtained in conclusion. Take a Fibonacci extension tool on your chart platform. Beginning at the August 2011 highs as point 1, trace down to the January 2015 lows where the blue (w) is for point 2. Now trace back up to January 2015 blue wave (x) highs for point 3. This will give the equal legs area for (y) (not shown) at 70.95.
Source: https://elliottwave-forecast.com/stock-market/fxf-longer-term-elliott-wave-analysis-cycles/
Post automatically merged:
$EWC Long Term Elliott Wave Uptrend and Cycles
Firstly the EWC instrument inception date was 3/12/1996. The Canada ETF seeks to track the investment results of an index composed of large and mid-sized companies in Canada. This is of course reflected in the price. The best Elliott Wave reading of the long term cycles presume some lower prices that did not exist prior to the ETF fund inception date.
Shown on the monthly chart, the bullish cycle from all time lows is believed to have ended in November 2007. This is mostly in line with many other broad based ETF’s and indices that ended larger cycles near that time. Likewise the steep pullback lower into the March 2009 lows replicated the pullbacks in other ETF & indices instruments. This pullback was strong enough to suggest it had corrected the cycle up from the all time lows. The analysis and commentary continues below the monthly chart.
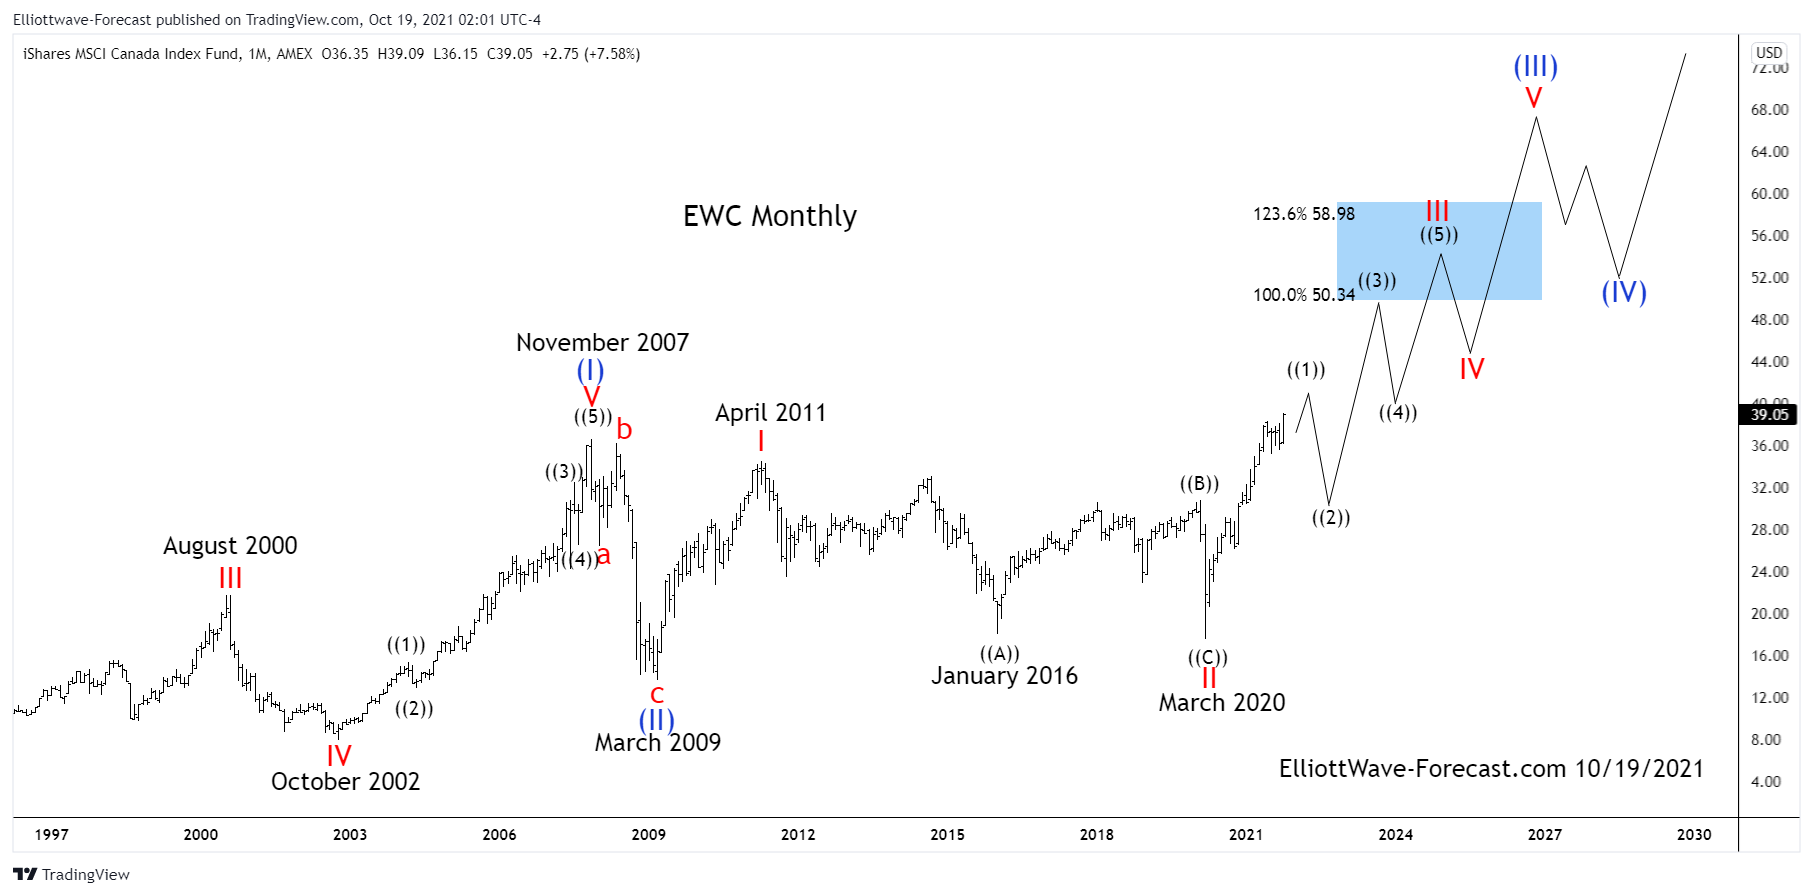
Secondly the bounce from the March 2009 lows has now got back above the November 2007 highs. However this compared to other indices instruments it is lagging. That’s not to say it will not catch up it is just the way it works out. EWC bounces higher as related indices instruments are going higher. However as of lately at a slower pace. Similarly, the instrument corrects cycles in pullbacks lower when the related instruments are doing the same.
The analysis and conclusion as mentioned earlier; Price has got above the November 2007 highs as the above chart shows. The cycles remain bullish nearer term while pullbacks remain above the March 2020 lows. The instrument should proceed higher with the related other countries ETF’s and indices reflecting the improvements in the progression of mankind.
Source: https://elliottwave-forecast.com/stock-market/ewc-long-term-elliott-wave-uptrend-and-cycles/
Post automatically merged:
News Corporation ( NWSA ) is a Media & Information Services company focuses on creating & distributing content worldwide. It operates in different segments like Digital estate services, subscription based video services, Dow Jones services, book publishing, news media & others. It trades under NWSA ticker at Nasdaq.
NWSA Daily Elliott Wave View from April-2020 Low:
Since 2013 in daily, NWSA made all time low during Covid pandemic sell off at $7.90 on 4/02/2020. It started the impulse sequence from April-2020 low & ended ((3)) at $27.97 high on 5/10/2021. While below there it proposed finished ((4)) at $21.61 low on 9/20/2021 & above that level it expect to extend higher in ((5)) for new high above ((3)).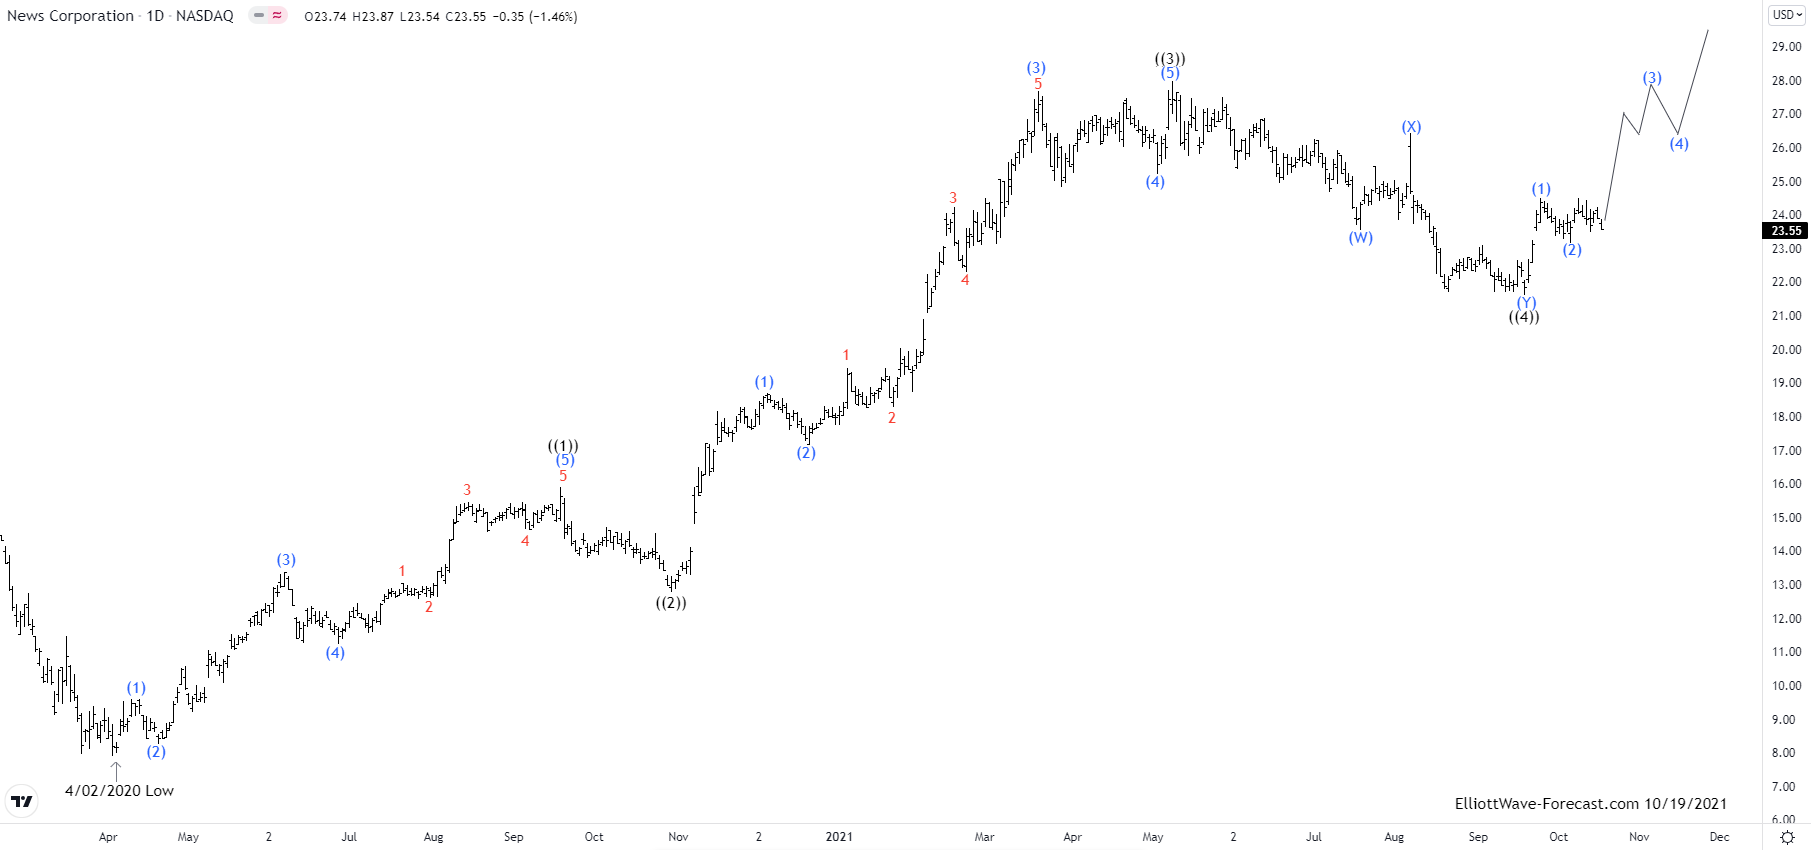
In Primary view, it started impulse as wave ((1)) from 4/02/2020 low & ended at $15.90 on 9/18/2020 high. The ((2)) wave was 0.382 retracement of previous degree as shallow correction. While above $12.79 low as ((2)), it favored ended ((3)) at $27.97 high on 5/10/2021 with internal (3) wave extension. The ((4)) proposed ended at $21.61 low on 9/20/2021 as 0.382 retracement of previous degree. Above $21.61 low, it expect to extend higher in ((5)) towards $29.51- $31.96 area before any larger pullback against April-2020 low starts.
Alternatively, it finished the impulse sequence from April-2020 low to May-2021 high as I red. And it can see larger pullback in wave II as double correction. The alternate view is presented in below chart. According to which, it favored ended ((W)) at $21.61 low on 9/20/2021. And above there ((X)) expect to extend higher in 3 swings, which should end near $26.07 or slightly higher. Thereafter the next leg lower will start as ((Y)) in double correction. So in both cases, we expect it to extend higher in short term above $26 before the decision time comes.
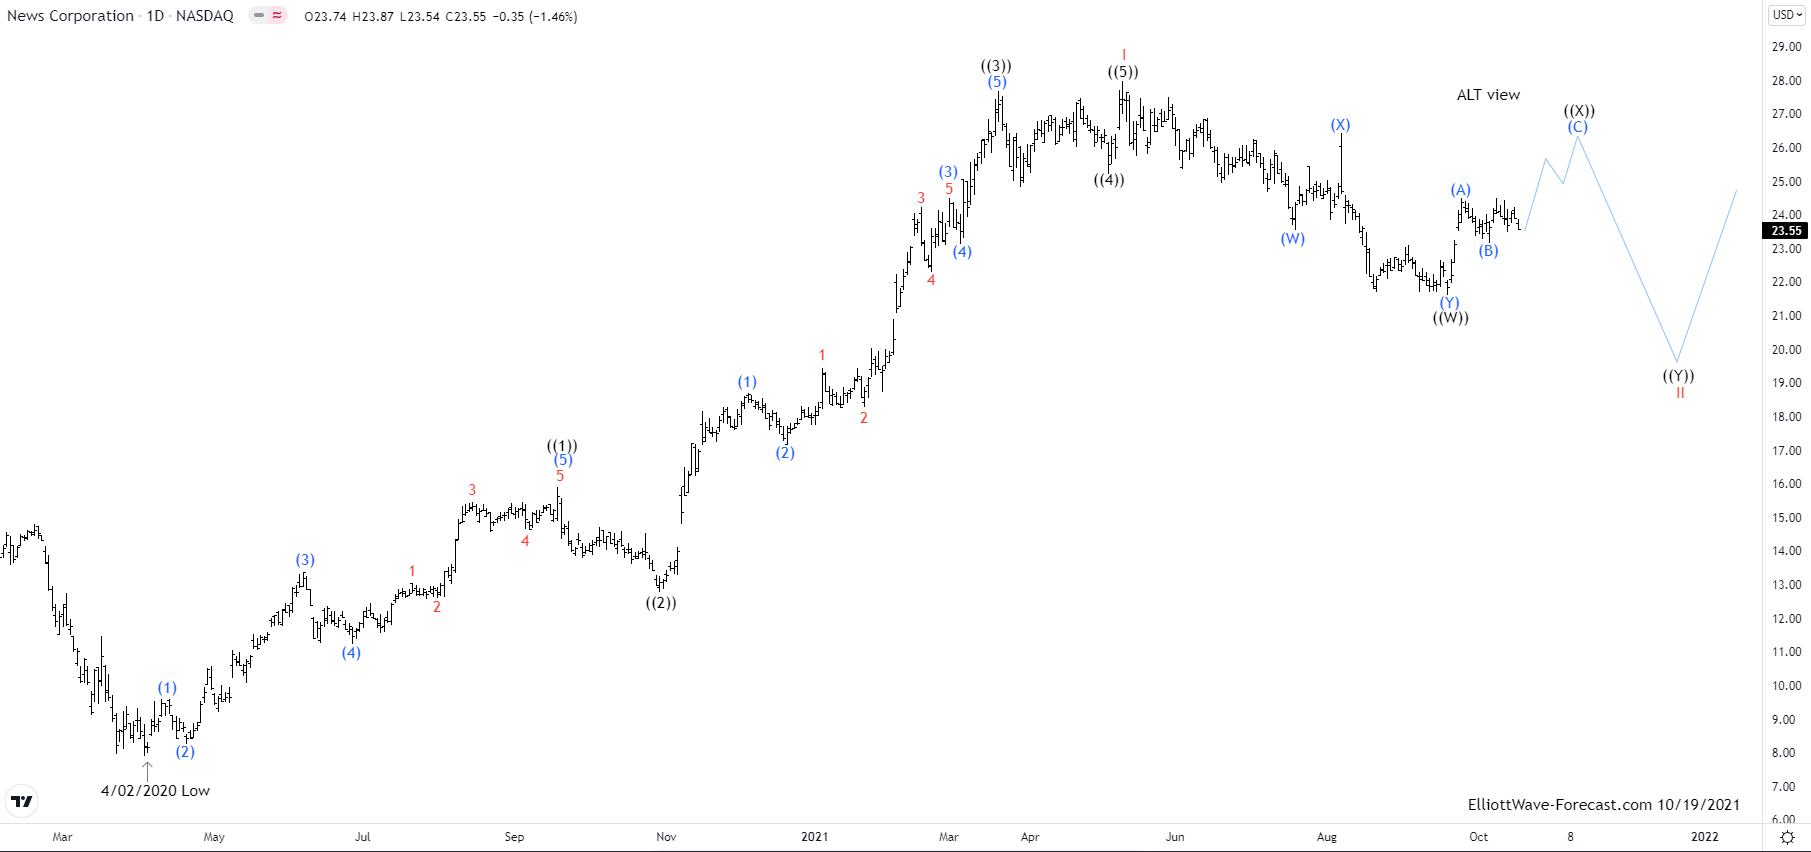
Source: https://elliottwave-forecast.com/stock-market/elliott-wave-view-nwsa-pullback-supported/
Post automatically merged:
Olin Corporation ( OLN ) manufactures & distributes Chemical products in the US, Europe & other countries. OLN is based in Clayton, Missouri. It trades under OLN ticker at NYSE. It comes under the Basic Materials sector as Specialty Chemicals industry.
OLN - Elliott wave view from March-2020 low:
In daily, OLN started a higher high sequence from March-2020 low after a global sell off ended in early last year. Within the impulse cycle, currently it is in ((5)) wave as diagonal making 3-3-3-3-3 structure. It expect to make two more highs before any larger pullback against March-2020 low unfolds.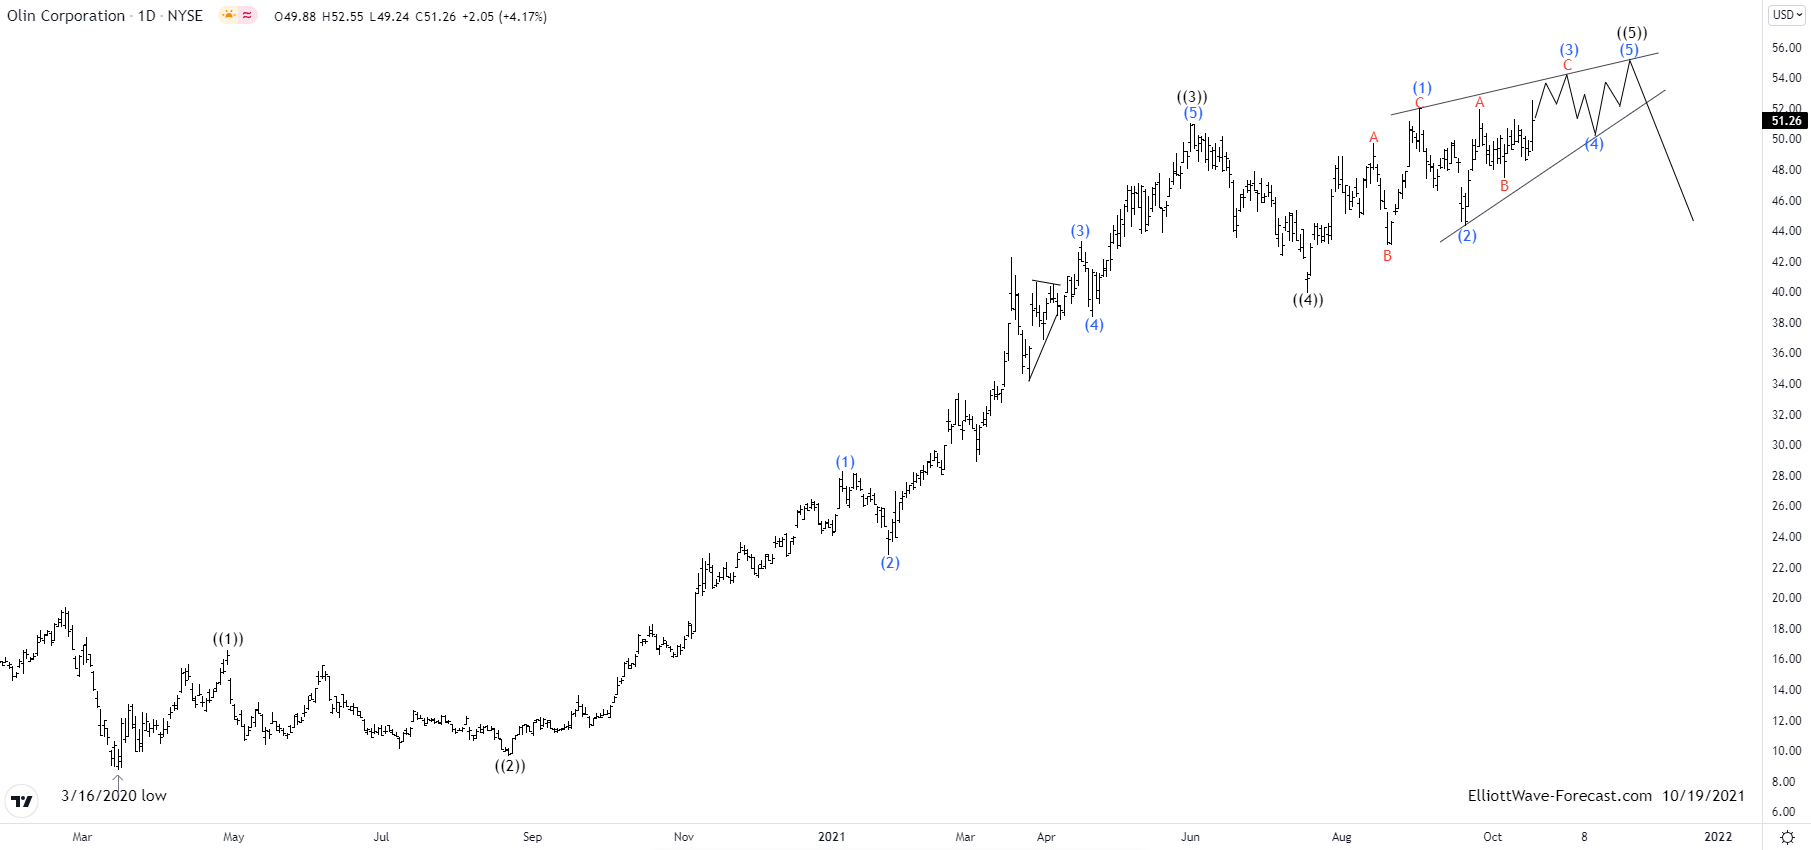
It started the primary degree ((1)) from 3/16/2020 low, which ended at $16.57 high on 4/29/2020. While below there it ended ((2)) at $9.67 low on 8/21/2020 as 0.854 retracement against ((1)). Above $9.67 low, it extended higher in ((3)), which ended at $51.04 high on 6/01/2021 as ((3)) wave extension. Generally, the third wave is the most common extension in stock market. Thereafter it pullbacks in ((4)), which ended at $39.90 low on 7/19/2021. ((4)) was slightly pass below 0.236 retracement against wave ((3)).
It confirms the higher high sequence in ((5)), which appears as 3 swings move indicating possible diagonal ((5)) is in progress. In short term, it is progressing in (3) of ((5)) as 3 swings move from $44.30 low as (2) & expect to move inside wedge. It can see two more highs before any larger reaction unfolds against impulse up cycle started from March-2020 low. After finishing (3), it should pull back near lower line of wedge before it rise again in final leg up. After diagonal structure ends, it expect to fall with higher momentum.
Source: https://elliottwave-forecast.com/stock-market/elliott-wave-view-oln-expect-short-term-upside/
There is no shortage of Meme stocks these days to trade. Zac Morris is a trader who has a large following on Twitter. Lately, his stock picks have had the "wall street bets" effect where retail floods in to create large surges in price. I decided to take a look at his latest pick, Nextplay Technologies. First, lets take a look at what they do as a company:
"We develop engaging and exciting products and services in over-the-top (OTT) content entertainment, gaming, in-game advertising, travel, and fintech/crypto banking, leveraging AdTech, Artificial Intelligence, and Blockchain solutions. By combining our existing technologies' strengths with the acquisition of new capabilities to fuel growth, we enhance our stakeholder value."
Lets dig into the charts!

Nextplay Daily chart since the low in March 2020 shows the bigger picture at play. The stock is favoured to have rallied in 5 waves higher into Red I. After that, Red II has played out as a flat structure which struck a low in September 2021. It is favoured off the September 2021 lows that this stock will do another 5 waves higher, into a nest for ((1)) and ((2)). In order for this count to remain intact, the September 2021 lows must remain intact.

Nextplay Shorter cycles since September 20, 2021 lows. It is favoured that this stock has advanced from September 2021 low of 1.26 to a peak of 3.68 set on Oct 15/2021 in a 5 waves structure. After that peak, prices are now pulling back to correct that cycle. The price action today suggests that a connector in X is set, and now the stock will be heading lower to the blue box. The next area where buyers may enter for a bounce is the 1.80 to 1.26 area.
In order for this count to remain intact, the 1.26 low must not get violated. After that (2) is set, the next area above after (2) is complete for a target, is the 4.22 to 5.71 area.
Source: https://elliottwave-forecast.com/stock-market/nextplay-technologies-inc-nxtp-priming-move-higher/
"We develop engaging and exciting products and services in over-the-top (OTT) content entertainment, gaming, in-game advertising, travel, and fintech/crypto banking, leveraging AdTech, Artificial Intelligence, and Blockchain solutions. By combining our existing technologies' strengths with the acquisition of new capabilities to fuel growth, we enhance our stakeholder value."
Lets dig into the charts!
Nextplay Technologies Inc Daily Elliottwave View:

Nextplay Daily chart since the low in March 2020 shows the bigger picture at play. The stock is favoured to have rallied in 5 waves higher into Red I. After that, Red II has played out as a flat structure which struck a low in September 2021. It is favoured off the September 2021 lows that this stock will do another 5 waves higher, into a nest for ((1)) and ((2)). In order for this count to remain intact, the September 2021 lows must remain intact.
Nextplay Technologies Inc 1H Elliottwave View:
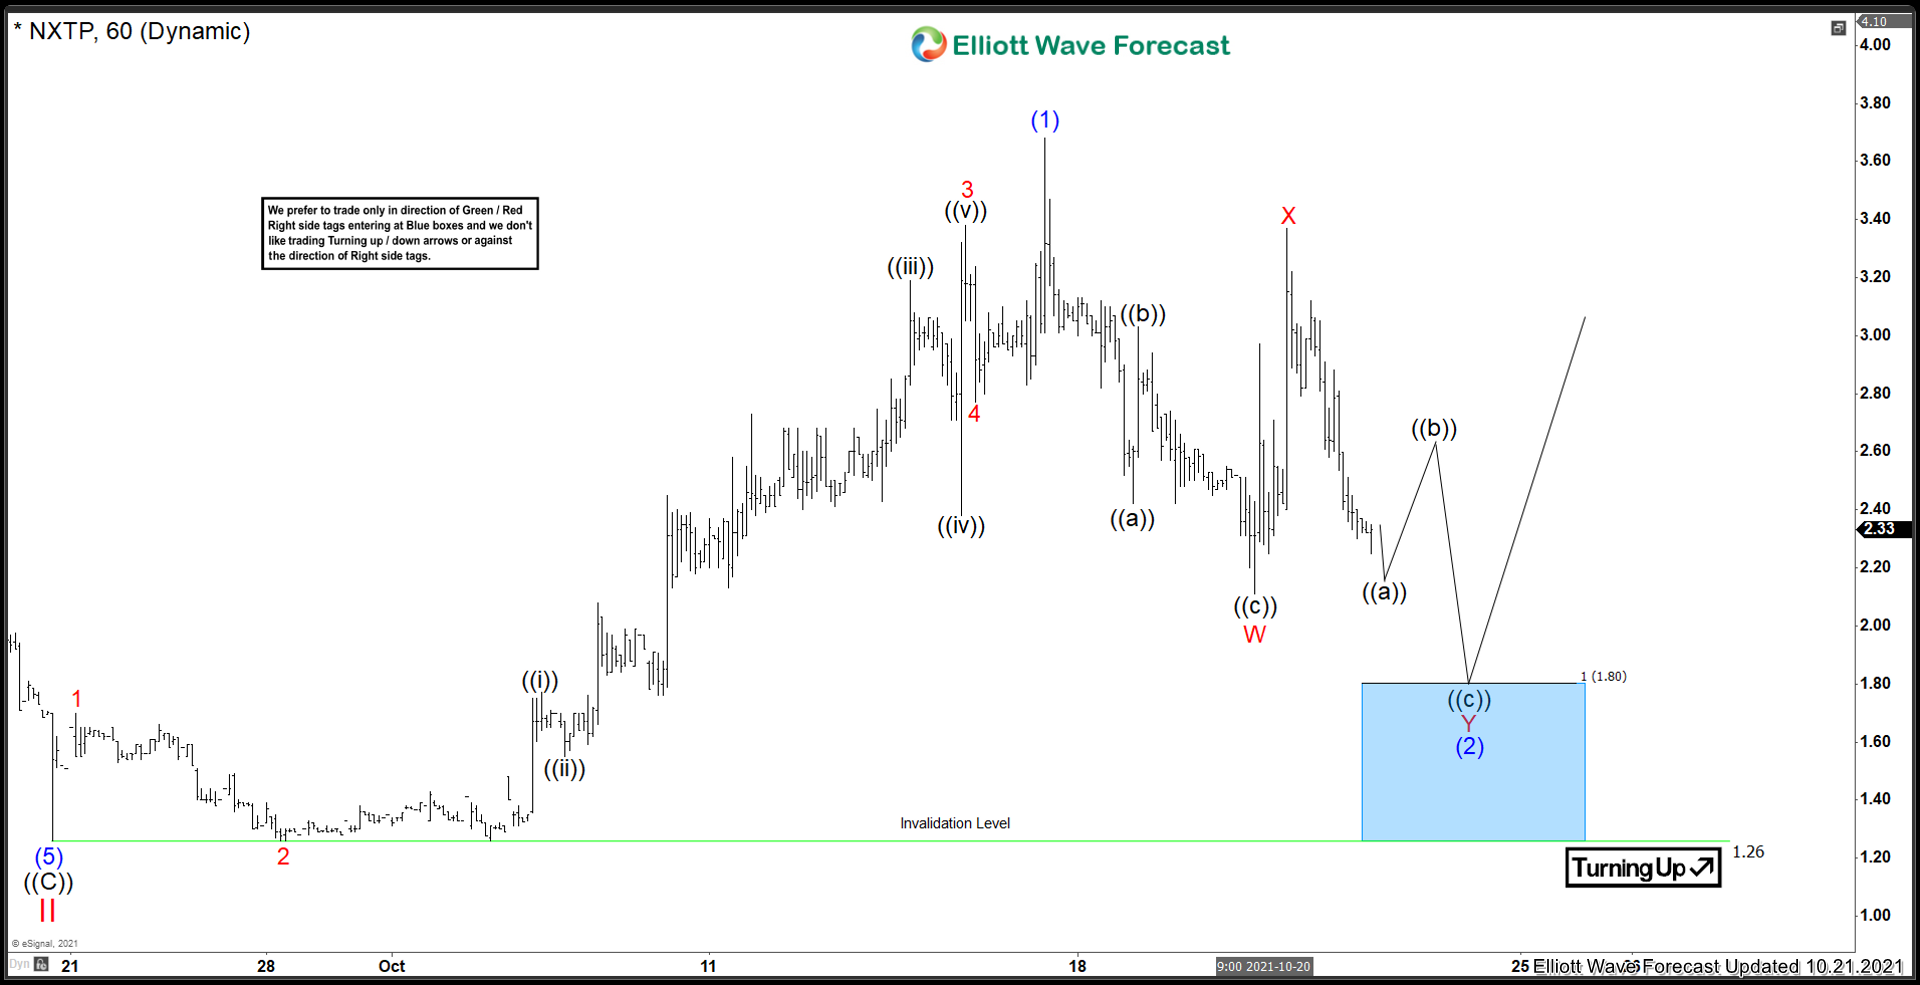
Nextplay Shorter cycles since September 20, 2021 lows. It is favoured that this stock has advanced from September 2021 low of 1.26 to a peak of 3.68 set on Oct 15/2021 in a 5 waves structure. After that peak, prices are now pulling back to correct that cycle. The price action today suggests that a connector in X is set, and now the stock will be heading lower to the blue box. The next area where buyers may enter for a bounce is the 1.80 to 1.26 area.
In order for this count to remain intact, the 1.26 low must not get violated. After that (2) is set, the next area above after (2) is complete for a target, is the 4.22 to 5.71 area.
Source: https://elliottwave-forecast.com/stock-market/nextplay-technologies-inc-nxtp-priming-move-higher/
Hello fellow traders. In this technical blog we’re going to take a quick look at the Elliott Wave charts of Microfost published in members area of the website. As our members know, Microsoft is showing impulsive bullish sequences and we’ve been calling rally in the Stock. $MSFT recently made ((4)) pull back. We expected the Stock to find buyers at the extreme zone from the 306.11 peak. In the further text we are going to explain the Elliott Wave forecast .
As our members know, Blue Boxes are no enemy areas , giving us 85% chance to get a bounce.
You can learn more about Elliott Wave Patterns at our Free Elliott Wave Educational Web Page.


Keep in mind that market is dynamic and presented view could have changed in the mean time. You can check most recent updates in the membership area of the website. Best instruments to trade are those having incomplete bullish or bearish swings sequences. We put them in Sequence Report and best among them are shown in the Live Trading Room. You can check most recent charts in the membership area of the site.

Elliott Wave Forecast
Source: https://elliottwave-forecast.com/stock-market/microsoft-msft-impulsive-bullish/
The Goldman Sachs Group, Inc. (GS) is an American multinational investment bank and financial services company headquartered in New York City. It offers services in investment management, securities, asset management, prime brokerage, and securities underwriting.
Since March 2020 low, GS is moving with a bullish momentum. The structure of this movement in Elliott Theory we call a motive wave or impulse. If you want to learn more about Elliott Wave Theory, please follow this link: Elliott Wave Theory. This impulse needs to build 5 waves before a correction.

In the charts above, we can see the first wave of impulse that we called wave (1) ended at 225.24 dollars. Pullback as wave (2) end at 185.52. Then the stock rally creating 5 swings up in lesser degree to form wave (3) completed at 393.26. Wave (4) correction finished at 348.13 and from here we are still developing wave (5) in 5 waves in lesser degree.
Wave 1 of (5) in red ended at 420.73. Wave 2 correction bounce from 372.50. Wave 3 is building now which one should continue higher to 444.00 to complete wave 3. Then you must see a pullback in wave 4 and a last push to complete wave 5 of (5) and the whole motive wave as wave ((1)). We expected that impulse ((1)) finishes in 444.39 – 465.60. area and we should see a correction in the market.
Source: https://elliottwave-forecast.com/stock-market/gs-still-looking-higher-q3-results/
The Swiss Market Index (SMI) is one of the other Capital Markets worldwide that is building motive wave from the lows of March 2020. We can clearly see that it has already completed 3 waves to the upside and we are correcting on wave 4 now.

Chart from September 16th, Wave ((1)) ends at 10534 as leading diagonal. Wave ((2)) did a ouble correction to complete at 9498. Then the SMI bounce from there developed another impulse as wave ((3)). The wave (1) of ((3)) did another leading diagonal. If you want to learn more about Elliott Wave Theory, please follow this link: Elliott Wave Theory). Then wave (2) of ((3)) was short ending at 10922. Wave (3) of ((3)) impulse ends at 12088 and wave (4) of ((3)) pullback at 11800. Last push to complete wave (5) of ((3)) and wave ((3)) peak at 12582.

The SMI continued dropping as expected ended wave ((4)) at 11381.74, a little below from our buying area. 11844 – 11395. Index bounced nicely and it should complete wave (1) soon. The pullback as wave (2) must stay above of 11381.74 level to validate this view.
With this structure, the last swing should end in 12852 – 13312 area where wave I of upper degree will end and we should correct the whole cycle in wave II.
Source: https://elliottwave-forecast.com/stock-market/smi-ended-wave-4-looking-push-higher/
Microsoft Elliott Wave 4 Hour Chart 09.30.2021
At the chart below we can see ((4)) pull back reached extreme zone Blue Box at 284.8-274.4 area. As the main trend is bullish, we expect buyers to appear at the marked zone for further rally toward new highs ideally. We don’t recommend selling the Stock and favor the long side from the blue box area. Invalidation for potential long trades would be break below 1.618 fib ext: 274.47. As the main trend is bullish, we expect to get a 3 waves bounce at least. Once bounce reaches 50 Fibs against the (B) blue high, buyers should ideally make long position risk free ( put SL at BE).As our members know, Blue Boxes are no enemy areas , giving us 85% chance to get a bounce.
You can learn more about Elliott Wave Patterns at our Free Elliott Wave Educational Web Page.

Microsoft Elliott Wave 4 Hour Chart 10.14.2021
The stock found buyers as we expected. We got nice reaction from the blue box . At this moment rally exceeded 50 fibs against the (B), so any long trades from the blue box should be risk free at this stage. Wave ((4)) pull back is completed at 279.47 low. Now we would like to see break of 08/20 - ((3)) black high, to confirm next leg up in progress. We don't recommend selling the stock, while keep favoring the long side.
Microsoft Elliott Wave 4 Hour Chart 10.21.2021
Eventually the price broke above 10/20 peak, confirming next leg up is in progress. Now the stock is bullish against the 279.47 low. It's expected to keep finding buyers in 3,7,11 swings.Keep in mind that market is dynamic and presented view could have changed in the mean time. You can check most recent updates in the membership area of the website. Best instruments to trade are those having incomplete bullish or bearish swings sequences. We put them in Sequence Report and best among them are shown in the Live Trading Room. You can check most recent charts in the membership area of the site.

Elliott Wave Forecast
Source: https://elliottwave-forecast.com/stock-market/microsoft-msft-impulsive-bullish/
Post automatically merged:
The Goldman Sachs Group, Inc. (GS) is an American multinational investment bank and financial services company headquartered in New York City. It offers services in investment management, securities, asset management, prime brokerage, and securities underwriting.
Since March 2020 low, GS is moving with a bullish momentum. The structure of this movement in Elliott Theory we call a motive wave or impulse. If you want to learn more about Elliott Wave Theory, please follow this link: Elliott Wave Theory. This impulse needs to build 5 waves before a correction.
GS DAILY CHART

In the charts above, we can see the first wave of impulse that we called wave (1) ended at 225.24 dollars. Pullback as wave (2) end at 185.52. Then the stock rally creating 5 swings up in lesser degree to form wave (3) completed at 393.26. Wave (4) correction finished at 348.13 and from here we are still developing wave (5) in 5 waves in lesser degree.
Wave 1 of (5) in red ended at 420.73. Wave 2 correction bounce from 372.50. Wave 3 is building now which one should continue higher to 444.00 to complete wave 3. Then you must see a pullback in wave 4 and a last push to complete wave 5 of (5) and the whole motive wave as wave ((1)). We expected that impulse ((1)) finishes in 444.39 – 465.60. area and we should see a correction in the market.
Source: https://elliottwave-forecast.com/stock-market/gs-still-looking-higher-q3-results/
Post automatically merged:
The Swiss Market Index (SMI) is one of the other Capital Markets worldwide that is building motive wave from the lows of March 2020. We can clearly see that it has already completed 3 waves to the upside and we are correcting on wave 4 now.
SMI Old Daily Chart

Chart from September 16th, Wave ((1)) ends at 10534 as leading diagonal. Wave ((2)) did a ouble correction to complete at 9498. Then the SMI bounce from there developed another impulse as wave ((3)). The wave (1) of ((3)) did another leading diagonal. If you want to learn more about Elliott Wave Theory, please follow this link: Elliott Wave Theory). Then wave (2) of ((3)) was short ending at 10922. Wave (3) of ((3)) impulse ends at 12088 and wave (4) of ((3)) pullback at 11800. Last push to complete wave (5) of ((3)) and wave ((3)) peak at 12582.
SMI Daily Chart

The SMI continued dropping as expected ended wave ((4)) at 11381.74, a little below from our buying area. 11844 – 11395. Index bounced nicely and it should complete wave (1) soon. The pullback as wave (2) must stay above of 11381.74 level to validate this view.
With this structure, the last swing should end in 12852 – 13312 area where wave I of upper degree will end and we should correct the whole cycle in wave II.
Source: https://elliottwave-forecast.com/stock-market/smi-ended-wave-4-looking-push-higher/
$USO United States Oil Fund Long Term Cycles & Elliott Wave Analysis
Firstly the USO instrument inception date was 4/10/2006. CL_F Crude Oil put in an all time high at 147.27 in July 2008. USO put in an all time high at 953.36 in July 2008 noted on the monthly chart. The decline from there into the February 2009 lows was in three swings. An a-b-c in red although it was a very steep pullback.
Further, the bounce from the 2009 lows is a complex double three combination with a triangle “y”. This is w-x-y in red to end the blue wave (x). In either a bullish or bearish market this particular structure always makes a high or low in the initial wave “w”. After a wave “x” correction, structures like this will be followed by a contracting or running triangle. In this case the structure ended in June 2014. The decline from those highs were very sharp again. As can be seen, this was in three swings again a-b-c in red to end the blue wave (y). This completed a three swing correction (w)-(x)-(y) in blue from the July 2008 highs.
The analysis continues below the USO Monthly chart.

Secondly CL_F Crude Oil and the USO instrument as previously mentioned made an all time high back in July 2008. Each of the cycles appears to have declined in three big swings into the February 2016 lows. In the case of USO the price was 61.36. The bounce into the October 2018 highs was three swings again. The analysis continues below the USO Weekly chart.

In conclusion: The USO mirrors CL_F Crude Oil. The bounce from the February 2016 lows into the October 2018 highs appeared to have been a zig zag. Further this is a second (x)(x). As can be seen the decline from the October 2018 highs to the December 2108 lows was five waves and labeled “a”. There was a bounce that failed in April 2019 labeled “b”. Wave “c” made new lows in April 2020. Lastly the bounce from there appears impulsive. While pullbacks remain above the April 2020 lows expect it continuing higher again.
Source: https://elliottwave-forecast.com/st...-fund-long-term-cycles-elliott-wave-analysis/
Firstly the USO instrument inception date was 4/10/2006. CL_F Crude Oil put in an all time high at 147.27 in July 2008. USO put in an all time high at 953.36 in July 2008 noted on the monthly chart. The decline from there into the February 2009 lows was in three swings. An a-b-c in red although it was a very steep pullback.
Further, the bounce from the 2009 lows is a complex double three combination with a triangle “y”. This is w-x-y in red to end the blue wave (x). In either a bullish or bearish market this particular structure always makes a high or low in the initial wave “w”. After a wave “x” correction, structures like this will be followed by a contracting or running triangle. In this case the structure ended in June 2014. The decline from those highs were very sharp again. As can be seen, this was in three swings again a-b-c in red to end the blue wave (y). This completed a three swing correction (w)-(x)-(y) in blue from the July 2008 highs.
The analysis continues below the USO Monthly chart.
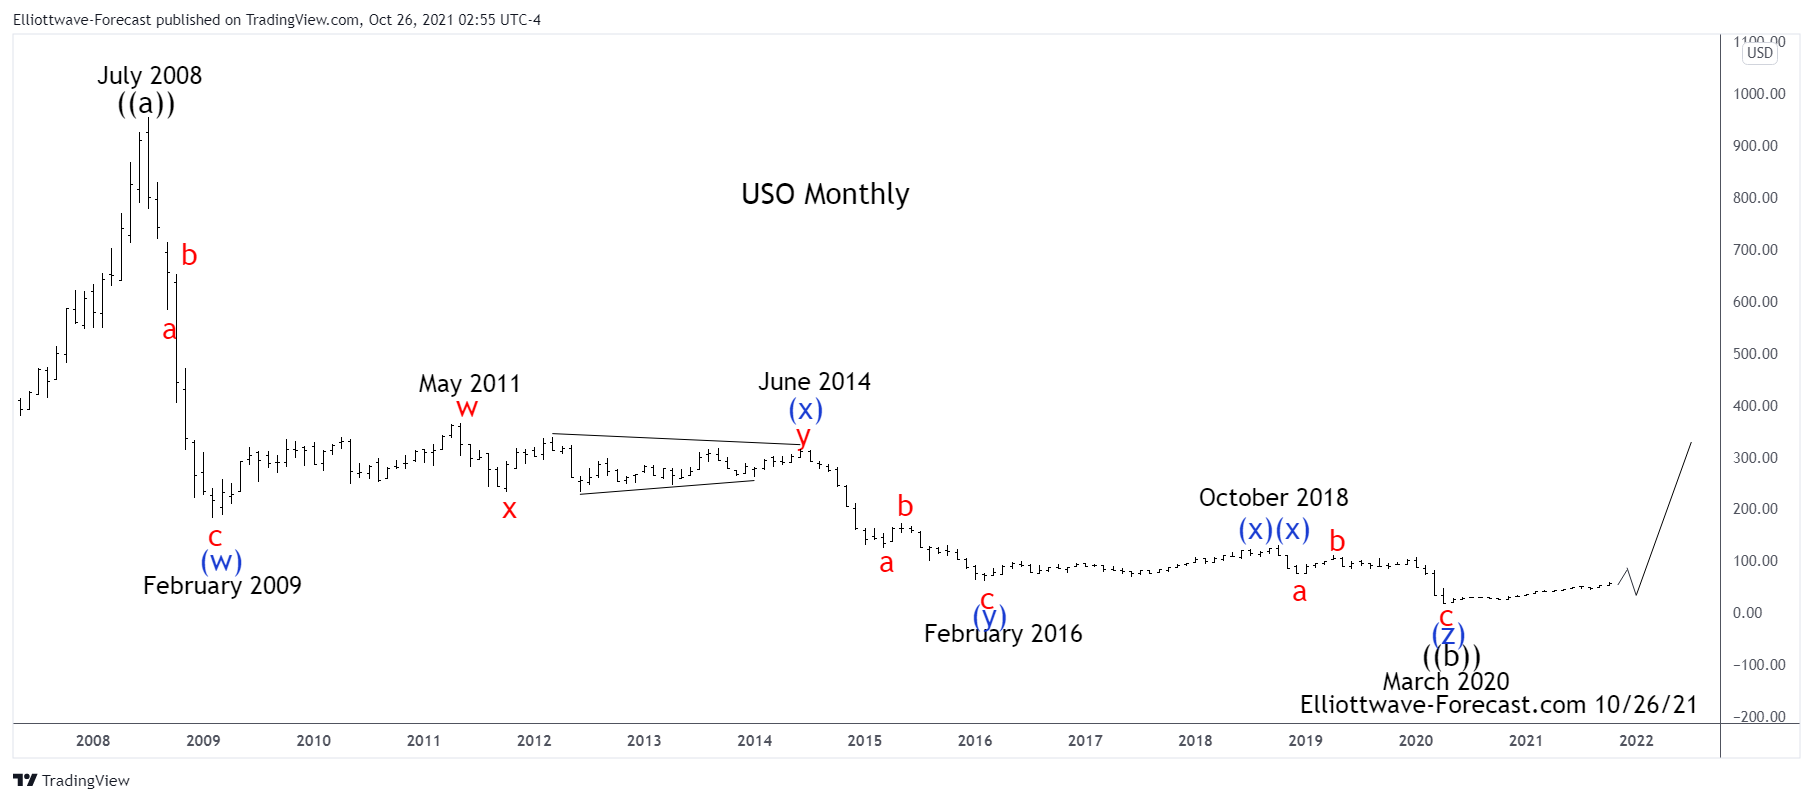
Secondly CL_F Crude Oil and the USO instrument as previously mentioned made an all time high back in July 2008. Each of the cycles appears to have declined in three big swings into the February 2016 lows. In the case of USO the price was 61.36. The bounce into the October 2018 highs was three swings again. The analysis continues below the USO Weekly chart.
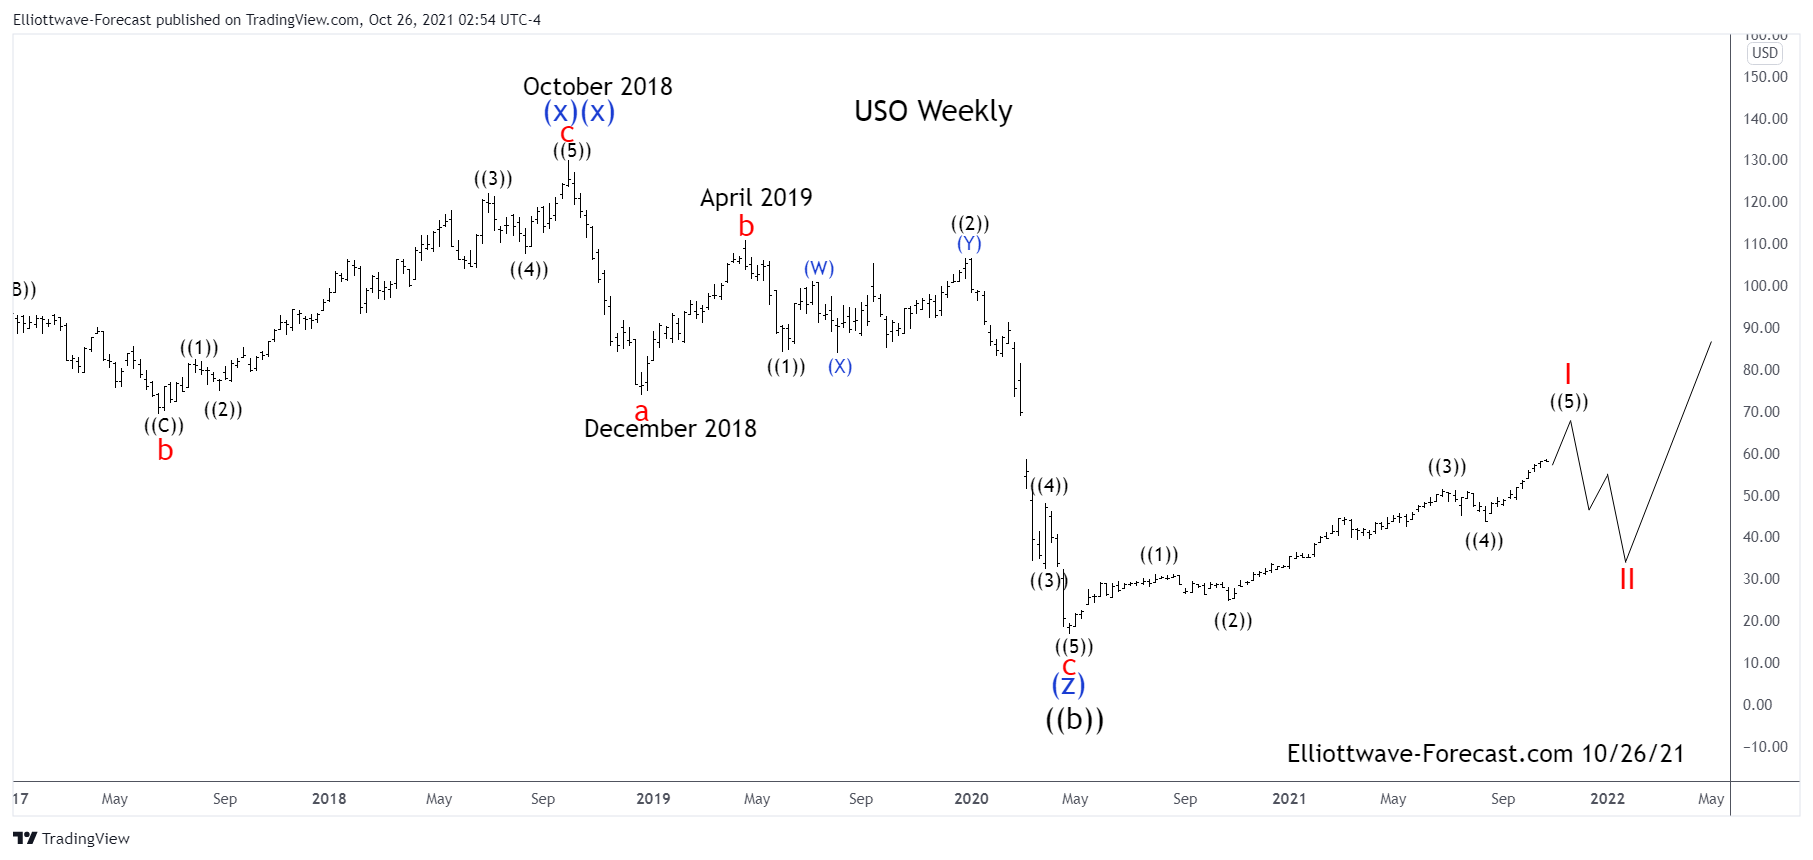
In conclusion: The USO mirrors CL_F Crude Oil. The bounce from the February 2016 lows into the October 2018 highs appeared to have been a zig zag. Further this is a second (x)(x). As can be seen the decline from the October 2018 highs to the December 2108 lows was five waves and labeled “a”. There was a bounce that failed in April 2019 labeled “b”. Wave “c” made new lows in April 2020. Lastly the bounce from there appears impulsive. While pullbacks remain above the April 2020 lows expect it continuing higher again.
Source: https://elliottwave-forecast.com/st...-fund-long-term-cycles-elliott-wave-analysis/
Similar threads
- Replies
- 1
- Views
- 2K
- Replies
- 0
- Views
- 2K
- Replies
- 2
- Views
- 3K