Elliottwave-Forecast

Master Trader
Feb 17, 2017
2,426
9
84
www.elliottwave-forecast.com
Since the crash of March 2020, all stocks have tried to recover what they lost, and Berkshire Hathaway was no exception. BRK.B did not only recover the lost, but It also reached historic highs. Now, it is building an impulse from March 2020 lows with a target to $318 - $342 area. Target measured from wave ((1)) and wave ((2)). We think this target is conservative and as the weeks go by, we will update a better target area.

Berkshire Hathaway Old Daily Chart

Berkshire Hathaway Old Daily Chart

As we see in the daily chart, the wave ((1)) has ended, the structure could be rare for you because it is not quite common, and it is called an expanding leading diagonal. (If you want to learn more about Elliott Wave Theory, please follow this link: Elliott Wave Theory). I think it is better to manage the structure of Berkshire Hathaway in that way instead of a nest, and this is because comparing some cycles in the market has more sense with the current structures of the market. Then we have a clear (A), (B), (C) correction as wave ((2)) and we are developing wave ((3)) in this moment.

Berkshire Hathaway Daily Chart

Berkshire Hathaway Daily Chart

In Berkshire Hathaway, we have returned to the first structure erasing the idea of another nest in wave ((3)) as we did 1 month ago. That is because the pullback from wave (3) of ((3)) was more deeper than expected; therefore, the correction labels as wave (4) is the better option for now.

Short Term wave (4) possibly ended. We will confirm wave (4) when we break the wave (3) high to look for complete wave ((3)). In the next months we should continue higher in the stock to 302.23 – 318.27 area following the uptrend as we could see in the chart.

Source: https://elliottwave-forecast.com/stock-market/berkshire-hathaway-needs-break-295/
Post automatically merged:

BioNTech SE (Nasdaq: BNTX) is a German biotechnology company that develops treatment based on messenger ribonucleic acid (mRNA). The company shot to fame and becomes a household name after becoming one of the first successful companies to develop vaccine for Covid-19. In 2020, partnering with Pfizer, BioNTech developed RNA vaccine BNT162b2 to prevent COVID-19 infection. The vaccine offers 95% efficacy in preventing COVID-19 at least 7 days after the second dose. It was the first ever mRNA vaccine which gets authorization.

Weekly chart for BNTX below shows the company rallies in an incomplete impulse Elliott Wave structure which should see further upside. From the IPO time, wave (I) ended at 105, and pullback in wave (II) ended at 37. From there, it's nesting within wave (III) where wave I of (III) ended at 131 as a diagonal. Pullback in wave II of (III) ended at 80.55. Expect 1 more high to end wave III of (III) as an impulse. Then the stock should pullback in wave IV before 1 more leg higher to end wave V of (III). As far as pivot at 80.55 low remains intact, dips should continue to see buyers in 3, 7, or 11 swing for further upside.

BioNTech (BNTX) Weekly Chart 27 June 2021​

BioNTech (BNTX) Elliott Wave Chart


Source: https://elliottwave-forecast.com/stock-market/biontech-bntx-continues-benefit-pandemic/
Post automatically merged:

Shopify (NYSE: SHOP) is a Canadian multinational e-commerce company headquartered in Ottawa, Ontario. It's also an e-commerce platform for online stores. The stock is up above 28% over the past month, outperforming S&P 500 which has returned just about 2% over the past month. The stock has certainly benefited from the Covid-19 breakout, as the pandemic accelerated the shift to e-commerce. The company provides small and medium businesses the software tools and services they need to go online.

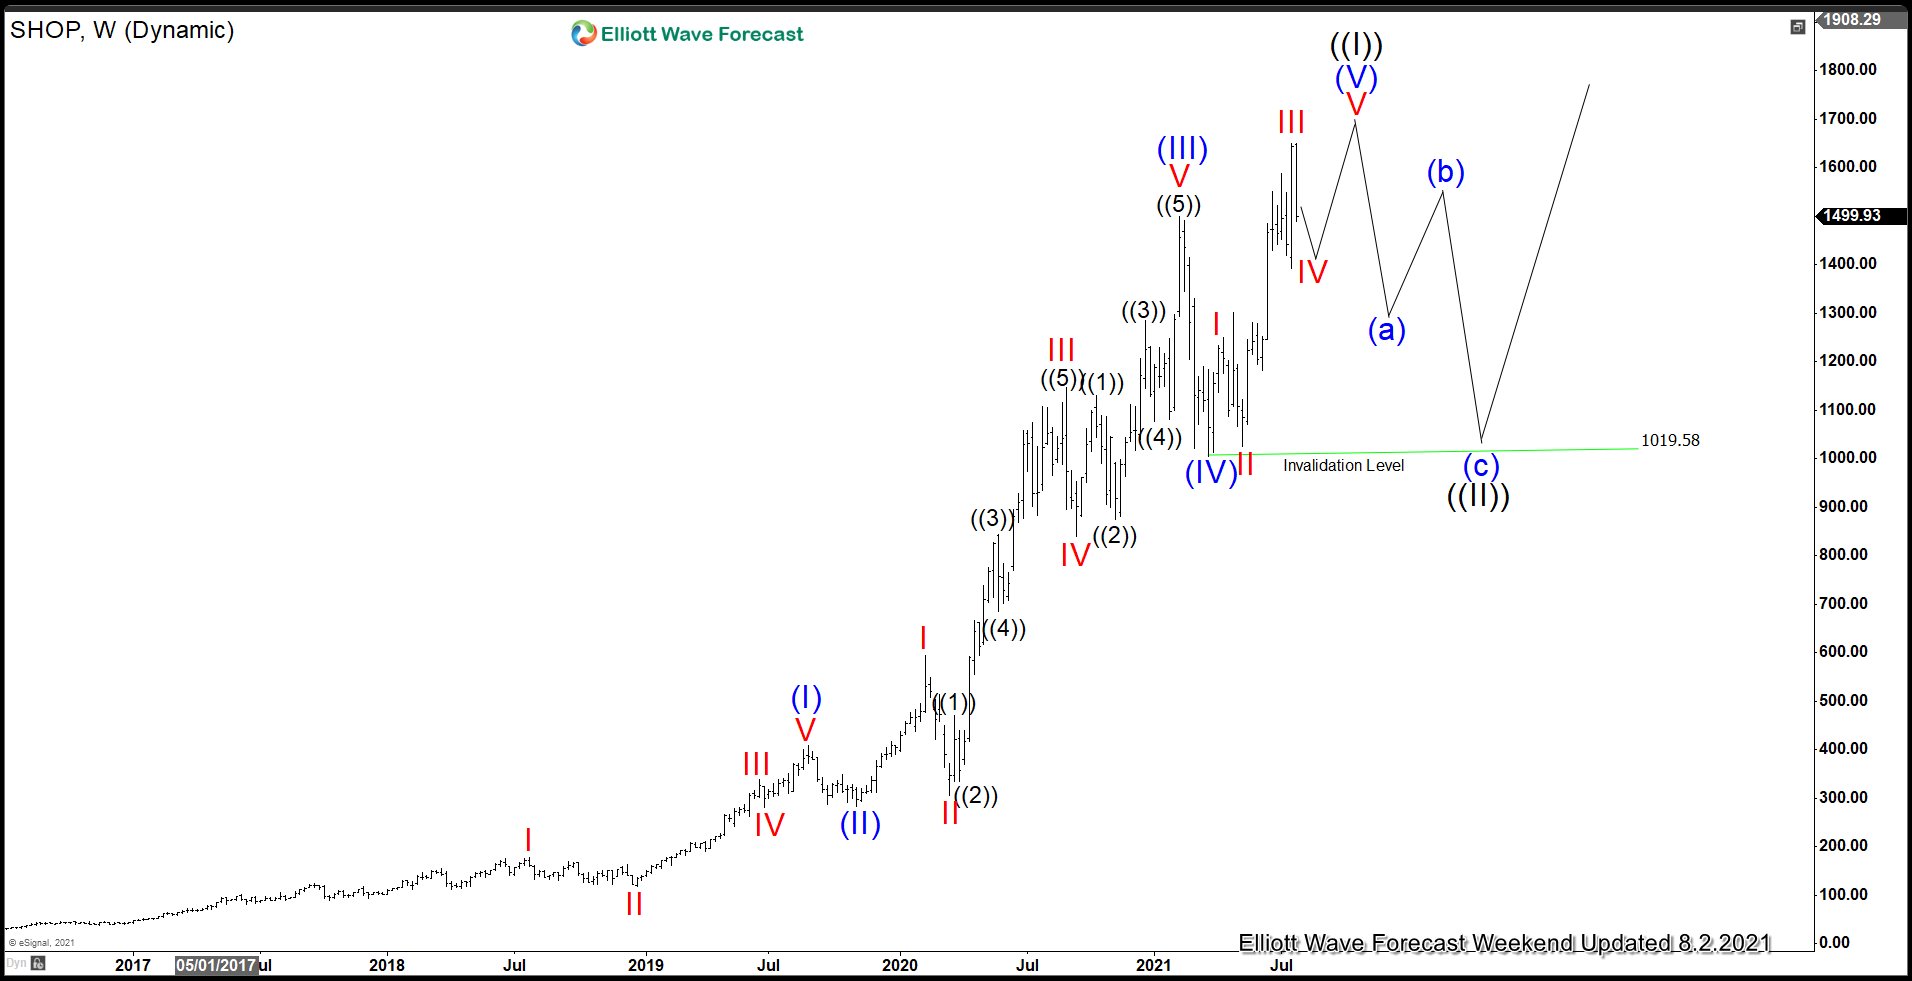
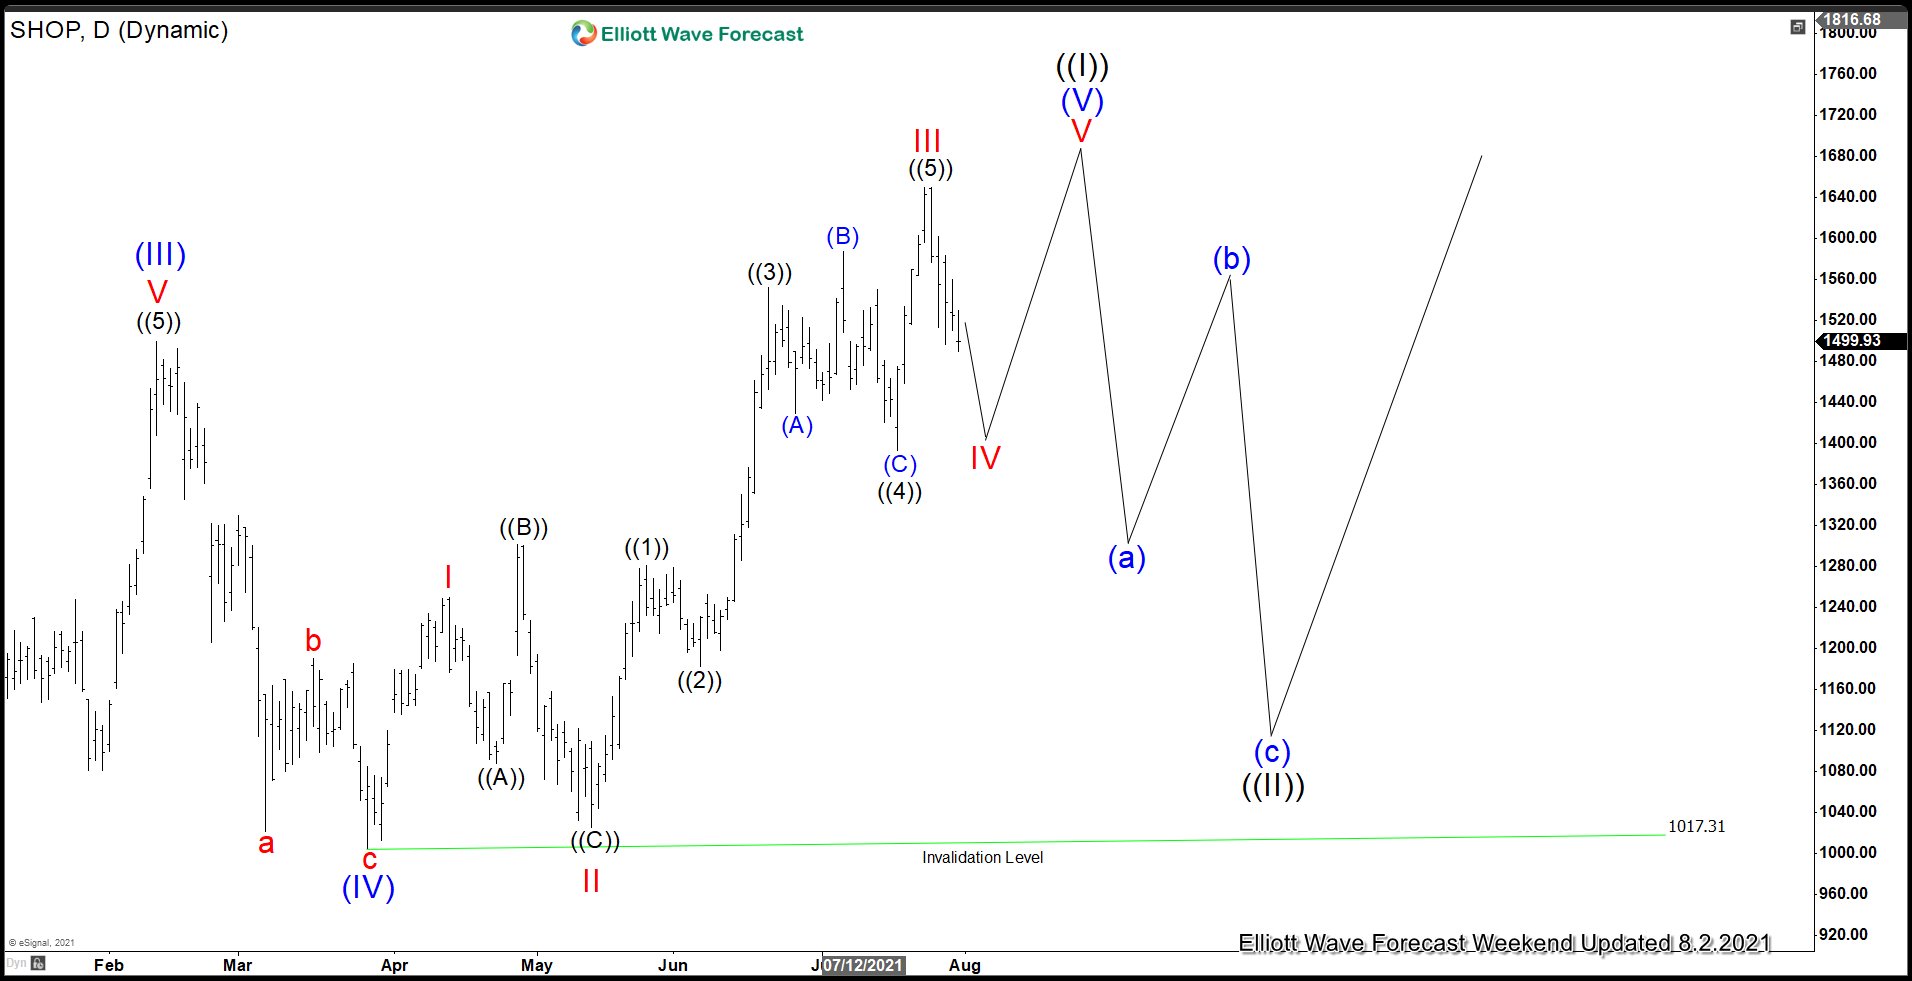
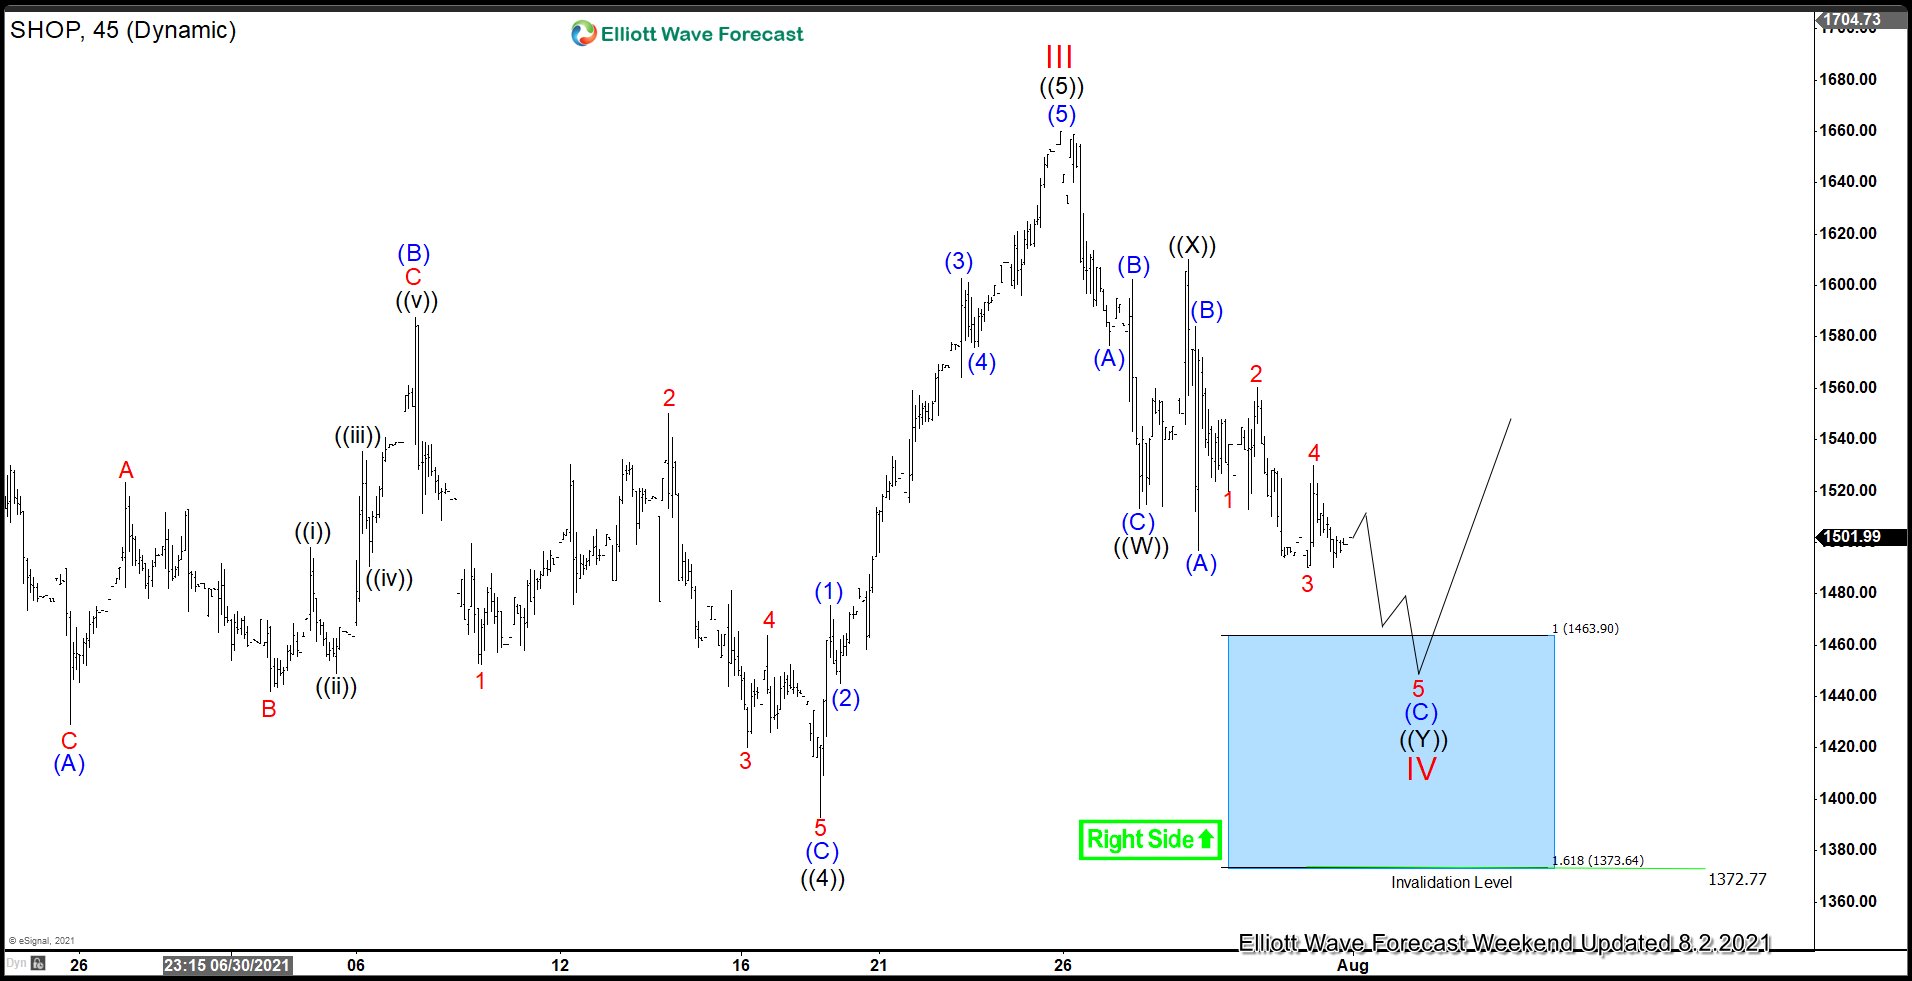
Below is the weekly Elliott Wave chart for Shopify. The entire rally from the IPO time in 2015 is unfolding as a 5 waves impulse Elliott Wave structure. Up from the all-time low, wave (I) ended at 409.61 and wave (II) pullback ended at 282.08. Stock then resumed higher again in wave (III) towards 1499.75 and pullback in wave (IV) ended at 1005.14 on March 2021. The stock has recently made a new all-time high again within wave (V).

Near term, expect the stock to continue higher as far as pullback stays above March 26 low at $1005.14. Once wave IV of (IV) completes, then we can better measure potential target to end wave V of (V) of ((I)).

SHOP Weekly Chart 27 June 2021​

Shopify Elliott Wave Chart


Source: https://elliottwave-forecast.com/stock-market/shopify-nyse-shop-wave-v-progress/
 

Elliottwave-Forecast

Master Trader
Feb 17, 2017
2,426
9
84
www.elliottwave-forecast.com
In this technical article we’re going to take a quick look at the Elliott Wave charts of NZDJPY , published in members area of the website. We’ve been calling rally in the Forex Pair due to impulsive bullish sequences. We recommended members to avoid selling in any proposed pull back and keep buying the dips in 3,7,11 swings. Recently NZDJPY made pull back that has unfolded as Elliott Wave Zig Zag pattern . In the further text we are going to explain the Elliott Wave Pattern and Trading Setup.

Before we take a look at the real market example, let’s explain Elliott Wave Zigzag.

Elliott Wave Zigzag is the most popular corrective pattern in Elliott Wave theory . It’s made of 3 swings which have 5-3-5 inner structure. Inner swings are labeled as A,B,C where A =5 waves, B=3 waves and C=5 waves. That means A and C can be either impulsive waves or diagonals. (Leading Diagonal in case of wave A or Ending in case of wave C) . Waves A and C must meet all conditions of being 5 wave structure, such as: having RSI divergency between wave subdivisions, ideal Fibonacci extensions and ideal retracements.

NZDJPYNow let’s take a look what Elliott Wave Zig Zag looks like in real market example.

NZDJPY Elliott Wave 4 Hour Chart 6.20.2021​

Right side remains in the favor of the NZDJPY. Current view suggests ((4)) black correction is unfolding as Elliott Wave Zig Zag . Inner labeling of the pattern is (A)(B)(C) blue.
At the chart below, we can see that wave (A) shows 5 waves. We got shallow (B) correction and currently (C) red leg is in progress, unfolding as 5 waves. The pair has already reached extremes at 76.7-75.38 area. Although we see potentially more short term weakness, we don't recommend selling the pair. We like the long side from the blue box, looking for further rally toward new highs ideally. As the main trend is bullish, we should get 3 wave bounce at least from the Blue Box buyers zone. Invalidation level for the trade would be break below 1.6148 fib extension (75.38).

You can learn more about Elliott Wave Zig Zag Patterns at our Free Elliott Wave Educational Web Page.

NZDJPY

NZDJPY Elliott Wave 4 Hour Chart 6.27.2021​

NZDJPY completed 5 waves in (C) leg. Buyers appeared at the blue box and we are getting good reaction from there. We believe pull back is completed at 76.2 low. As the bounce has reached and exceeded 50 fibs against the (B) high, long positions from the blue box are Risk Free. As our members know, Blue Boxes are no enemy areas , giving us 85% chance to get a bounce.

Keep in mind that market is dynamic and presented view could have changed in the mean time. You can check most recent charts in the membership area of the site. Best instruments to trade are those having incomplete bullish or bearish swings sequences. We put them in Sequence Report and best among them are shown in the Live Trading Room.

NZDJPY

Elliott Wave Forecast
Source: https://elliottwave-forecast.com/elliottwave/nzdjpy-rally-elliott-wave-zig-zag/
 

Elliottwave-Forecast

Master Trader
Feb 17, 2017
2,426
9
84
www.elliottwave-forecast.com
AMC Entertainment has become the new poster child for the Ape Movement since $GME (GameStop) peaked in January 2021. The rally has been nothing short of breathtaking as traders saw the price move from $11 to $73 in the span of about 10 days. But can the rally continue? Let check out the company history below:

“AMC Entertainment Holdings, Inc. (AMC Theatres, originally an abbreviation for American Multi-Cinema; often referred to simply as AMC and known in some countries as AMC Cinemas or AMC Multi-Cinemas) is an American movie theater chain headquartered in Leawood, Kansas, and the largest movie theater chain in the world. Founded in 1920, AMC has the largest share of the U.S. theater market ahead of Regal and Cinemark Theatres.

After acquiring Odeon Cinemas, UCI Cinemas, and Carmike Cinemas in 2016, it became the largest movie theater chain in the world. It has 2,866 screens in 358 theatres in Europe and 7,967 screens in 620 theatres in the United States.

The company is listed on the New York Stock Exchange; from 2012 to 2018, the Chinese conglomerate Wanda Group owned a majority stake in the company. Private equity firm Silver Lake Partners made a $600 million investment in AMC in September 2018, but the voting power of AMC shares is structured in such a way that Wanda Group still controlled the majority of AMC's board of directors.

Amid financial downturns caused by the COVID-19 pandemic, in January 2021 Wanda's ownership was increasingly diluted due to new financing by AMC, and Silver Lake converting its $600 million debt holding to equity after a short squeeze. In early-February 2021, Wanda converted its Class B shares to Class A shares, thus reducing its voting power. AMC has been able to raise over 1 Billion in capital since January 2021, to put the company in a better position for future growth”


AMC Elliottwave View:

AMC

Medium term term view from the all time low set Jan 2021 @ 1.91. This stock had a very impulsive ((1)) which peaked near the end of January 2021. After that, a fairly sharp ((2)) took place which tool the price from 20.36 peak down to 5.26 low at ((2)). From there, the stock largely drifted sideways for many weeks and months.

In Early May 2021, the stock formed a wave (2) low in the form of a complex flat structure. After that, momentum started to pick up into Red 1, with a short lived pullback into Red 2. After that, the chase was on. A very impulsive wave (3) took hold bring the stock from the (2) low of 8.97 to 72.62 peak. A pullback in (4) is favoured to be set, and the stock appears to be nesting some wave 1s and 2s consolidating for the next leg higher.

As long as the (4) low @ 37.66 remains intact, further upside is favoured. Should that low give up, the next equal leg area where buyers may enter is the 33.63 area. On the upside the next area where a larger pullback can take place is the 80.95 to 94.36 area. The momentum continues to support the idea for further extension higher for now.

Source: https://elliottwave-forecast.com/stock-market/amc-entertainment-amc-momentum-still-strong/
Post automatically merged:

In this technical blog, we will look at the past performance of 4 hour Elliott Wave Charts of XLI, which we presented to members at the elliottwave-forecast. In which, the rally from 23 March 2020 low unfolded as an impulse structure. And showed a higher high sequence favored more upside extension to take place. Therefore, we advised members not to sell the ETF & buy the dips in 3, 7, or 11 swings at the blue box areas. We will explain the structure & forecast below:

XLI 4 Hour Elliott Wave Chart​

XLI Can Resume The Rally From Elliott Wave Blue Box Area

Above is the 4 Hour Elliott wave chart from the 6/20/2021 update. In which, the XLI is showing an impulse rally higher where wave (4) ended at $84.37 low. Up from there, wave (5) ended at $106.81 high and thus completed the bigger wave ((3)). Down from there, the ETF entered in wave ((4)) pullback to correct the cycle from 9/24/2020 low. The internals of that pullback unfolded as Elliott wave zigzag structure where wave (A) ended at $100.46 low. Wave (B) bounce ended at $106.31 high as a flat structure and wave (C) managed to reach $99.99- $96.06 blue box area. From where buyers were expected to appear looking for more upside or for a 3 wave bounce at least.

XLI Latest 4 Hour Elliott Wave Chart​

XLI Can Resume The Rally From Elliott Wave Blue Box Area

Here’s the latest 4hr Elliott wave Chart of XLI from the 6/29/2021 update. In which the stock is showing a reaction higher taking place from the blue box area. Right after ending the zigzag correction within the blue box area. Allowed members to create a risk-free position shortly after taking the long positions at the blue box area. However, a break above $106.81 high still needed to confirm the next extension higher & avoid double correction lower.

Source: https://elliottwave-forecast.com/stock-market/xli-can-resume-rally-blue-box-area/
Post automatically merged:

MOEX Russian Index Bull Trend and Longer Term Cycles

The MOEX Russian index has trended higher with other world indices since inception. The index remained in a long term bullish trend cycle into the December 2007 highs. It made a sharp correction lower in 2008 that lasted until October 2008 similar to other world indices. That is where the index corrected the whole decades long bullish cycle.

Firstly from the October 2008 lows the index rose into the April 2011 highs. Then the index saw an almost 3 year long correction of that cycle into the March 2014 lows. That pullback corrected the whole cycle up from the 2008 lows. From there to the January 2020 highs ended a cycle up from the March 2014 lows.

The analysis continues below the chart.

Monthly Chart


Secondly I would like to mention this overall price movement in the bullish cycles leaves the index in a couple of different scenarios. One way to view it from an Elliott wave perspective is the January 2020 highs was the end of a larger degree third wave. I do not prefer this because it suggests after a few more new highs back above the January 2020 highs the index will suffer a huge correction bigger than ever seen before.

Thirdly in conclusion. The positive progression of mankind is reflected in equity indices. I do believe in the technical indicators that suggests I saw enough pain in the dips into the 2008 as well as the March 2020 lows that should eventually prove to be longer term cycle lows. I think the index has a longer term series of nested wave ones and twos. As suggested on the chart I think the cycle from the March 2020 lows should continue higher in the near term before a pullback corrects that cycle. I expect the index will remain above there for a long time progressing higher.

Source: https://elliottwave-forecast.com/stock-market/moex-russian-index-bull-trend-and-longer-term-cycles/
 

Elliottwave-Forecast

Master Trader
Feb 17, 2017
2,426
9
84
www.elliottwave-forecast.com
Tapestry, Inc. (formerly: Coach, Inc.) is a multinational luxury fashion holding company based in New York City, USA. The parent company owns three brands: Coach New York, Kate Spade New York and Stuart Weitzman. The stock of the company being a component of the S&P500 index can be traded under ticker $TPR at NYSE. Currently, we see cotton turning higher. Also, other soft commodities are moving up. Therefore, Tapestry being a heavy weight in the textile market should be a great opportunity for investors to diversify their portfolio by indirect investement in the rising prices of particularly soft commodities.

Tapestry Monthly Elliott Wave Analysis 07.03.2021​

The Monthly chart below shows the Tapestry shares $TPR traded at NYSE. First, the stock price has developed a leading diagonal higher in blue wave (I) of super cycle degree. It has printed the all-time highs in March of 2012 at 79.70. From the highs, a correction lower in blue wave (II) has unfolded as an Elliott wave double three pattern. It has printed an important bottom in April of 2020 at 10.18. As a matter of fact, the stock price has lost 87% of its value in only 8 years.

From 2020 lows, a new cycle in wave (III) has already started and should extend towards 79.70 highs and beyond. Then, the target for wave (III) will be towards 89.90-139.21 area and even higher.

Tapestry Elliott Wave Monthly

Tapestry Daily Elliott Wave Analysis 07.03.2021​

The daily chart below shows the early stages of the blue wave (III). From April 2020 lows, $TPR has developed a textbook impulse higher in red wave I. It has ended in May 2021 at 49.66. From the highs, consolidation in wave II might have just started. Investors and traders can be looking to buy the pullback in 3, 7 or 11 swings against 10.18 lows targeting 89.90-139.21 area and even higher in the long run.

Tapestry Elliott Wave Daily

Source: https://elliottwave-forecast.com/stock-market/tpr-tapestry/
Post automatically merged:

Hello fellow traders. In this technical blog we’re going to take a quick look at the Elliott Wave charts of Sugar futures , published in members area of the website. As our members know Sugar is showing impulsive bullish sequences in the cycle from the April 2020 low . We expected the commodity to keep finding buyers for further extension higher. We recommended members to avoid selling in any proposed pull back and keep buying the dips in 3,7,11 swings. Recently Sugar made a 3 waves pull back that have given us a good buying opportunity . In the further text we are going to explain the Elliott Wave Pattern Forecast and Trading Strategy.

Sugar SB 1! Elliott Wave 4 Hour Chart 06.16.2021​

Current view suggests the commodity is doing wave (2) correction. Pull back looks incomplete at the moment looking for another leg down toward 16.22-15.16 area. Don’t recommend selling the commodity in any proposed leg down. Strategy is waiting for the extreme zone to be reached at 16.22-15.16 before entering the long side. As the main trend is bullish , we expect buyers to appear at the blue box for a 3 waves bounce at least. As soon as the bounce reaches 50 Fibs against the X red connector high we will make long positions risk free ( put SL at BE). Invalidation for the trade would be break below 1.618 fib ext:15.16.

Reminder: You can learn about Elliott Wave Patterns at our Free Elliott Wave Educational Web Page.

Sugar

Sugar SB 1! Elliott Wave 4 Hour Chart 06.28.2021​

Eventually Sugar made proposed leg down toward the blue box (16.22-15.16 ) as we expected. Buyers appeared right at the equal legs 16.22 and we got nice reaction. At this moment rally has already reached 50 Fibs against the X red connector, so members who took long trades are enjoying profits within risk free positions. At this stage we see chance that commodity still might see another leg down due to Dollar strength. Anyway we don't recommend selling the commodity against the main bullish trend and favor staying in long positions from the Blue Box area. We are aware that Wave ((2)) pull back does not have to made proposed leg down. We already got clear 3 waves down and pull back ((2)) can be already completed.


SB


Sugar SB 1! Elliott Wave 4 Hour Chart 07.01.2021​

In the meantime Sugar keeps getting strong. It made break above previous 18.26 peak confirming next leg up is already in progress. The commodity remains bullish against the 16.45 low in first degree. We expect it to keep finding buyers in 3,7,11 swings.

Keep in mind that market is dynamic and presented view could have changed in the mean time. Best instruments to trade are those having incomplete bullish or bearish swings sequences. We put them in Sequence Report and best among them are shown in the Live Trading Room. You can check most recent charts in the membership area of the site.

SUGAR

Elliott Wave Forecast
Source: https://elliottwave-forecast.com/elliottwave/sugar-sb_f-buying-dips-elliott-wave/
Post automatically merged:

Since March 2020 crash, Alcoa (AA) has risen in share value around 800% and with the high prices of the Aluminum it must continue rising its value. Moreover, AA has built an incomplete impulse and it needs to keep the rally to develop the whole structure. We are considering a target above $47.00 dollars in first instance and in the future we are going to recalculate that because the price should be more higher.

Alcoa (AA) Daily Chart

Alcoa (AA) Daily Chart

As we see in the daily chart, the wave ((1)) ended in 5 swings and the pullback as wave ((2)) bounced from $10.95. With the break of the price of wave ((1)) we confirmed that wave ((2)) has done. Currently, we are developing the wave ((3)) that needs one high to complete 5 swings up. The wave (3) of ((3)) reached $44.49 and wave (4) of ((3)) ends at $31.90 dollars. With that data, it give us an area of $47.44 – 52.23 as possible target to end the wave ((3)). If you want to learn more about Impulse and Elliott Wave Theory, please follow this link: Elliott Wave Theory).

Short Term the bounce from wave (4) of ((3)) looks like as wave 1 of (5) that could be done and the next week, we should see a pullback in 3 swings as wave 2 of (5) that will give us a nice opportunity to enter in the market against $31.90 level. Therefore, we should continue higher in the stock to look for break wave (3) peak following the uptrend as we could see in the chart.

Source: https://elliottwave-forecast.com/stock-market/aluminum-rocket-alcoa-knows/
Post automatically merged:

Peabody Energy, Inc. is the largest private sector coal company in the world. It mines, sales and distributes coal to such major markets like electricity generation and steel making. Founded in 1883, the company has its headquarters in St. Louis, Missouri, USA. Being part of the Russel2000 index, one can trade it under the ticker $BTU at the New York Stock Exchange. Currently, we see the ongoing price appreciation within the energy commodities like oil, gas, uranium, coal and others. Consequently, coal mining companies are expected to turn higher as well. Therefore, investors in the energy sector obtain a good diversification opportunity by investing in the largest private coal miner in the world.

Peabody Energy Weekly Elliott Wave Analysis 07.03.2021​

The weekly chart below shows the Peabody Eneregy shares $BTU traded at NYSE. First, the stock price has developed a cycle higher in blue wave (I) of super cycle degree. It has printed the all-time highs in June 2018 at 47.84. From the highs, a correction lower in blue wave (II) has unfolded as an Elliott wave zigzag pattern. It has printed an important bottom in November 2020 at 0.80. As a matter of fact, the stock price has lost 98% of its value in only 2.5 years.

From November 2020 lows, a new cycle in wave (III) has already started and should extend towards 47.84 highs and beyond. Then, the target for wave (III) will be towards 48.53-78.07 area and even higher.

Peabody Elliott Wave Weekly

Peabody Energy Daily Elliott Wave Analysis 07.03.2021​

The Daily chart below shows the $BTU shares price action in more detail. The stock can be in the early stages of the red wave I of the blue wave (III). Right now, one can see a nesting action. Indeed, black waves ((1)) and ((2)) have ended. While above 2.61, wave ((3)) is in progress. Hereby, blue wave (1) is now being corrected within wave (2) lower. Then, expect more upside in wave (3) of ((3)).

At current prices, Peabody Energy presents a great opportunity for investors to enter the coal mining market. One should be looking to buy pullbacks from extremes in 3, 7, 11 swings expecting the stock to reach towards 48.53-78.07 area and even higher in the long view.

Peabody Elliott Wave Daily

Source: https://elliottwave-forecast.com/stock-market/peabody-energy-turns-higher/
 

Elliottwave-Forecast

Master Trader
Feb 17, 2017
2,426
9
84
www.elliottwave-forecast.com
Resonant, like so many other stocks, has enjoyed a large rally off the March 2020 low. However, this stock has already corrected that cycle, and may be ready to move higher. Lets take a look at the company profile:

"Resonant (NASDAQ: RESN) is transforming the market for RF front-ends (RFFE) and disrupting the RFFE supply chain by enabling customers and partners to deliver 5G filters designed using its WaveX™ software tools platform. WaveX™ allows Resonant’s customers to capitalize on the company’s robust IP portfolio and extensive services offerings. In a market that is critically constrained by limited designers, tools, and capacity, Resonant addresses these critical problems by providing customers with ever-increasing design efficiency, reduced time to market, and lower unit costs. Customers leverage Resonant’s disruptive capabilities to design cutting-edge filters and modules, while capitalizing on the added stability of a diverse supply chain through the Resonant Foundry Program fabless ecosystem. Working with Resonant, customers enhance the connectivity of current mobile devices, while preparing for the demands of emerging 5G applications."

Now that we know what the company is about, lets dig into the charts!

Resonant Elliottwave View:

Resonant

Elliottwave view from the all time low set in December 2018. From that low the stock rallied into a ((1)) which peaked in Feb 2019 @ 4.00. After ((1)) peaked, the stock had a very lengthy wave ((2)) correction. This correction took place as a double zig zag. ((2)) found a low at $0.95 on March 12/2020. From there the stock enjoyed an impulsive rally which peaked on Feb 9/2021 at $8.33. After that, a sharp correction has taken place which has overlapped on the previous ((1)) wave. This means the stock is taking shape as a leading diagonal structure within Red I degree. ((4)) found a low at $2.35 on May 13/2020.

In Conclusion, as long as the ((4)) low at 2.35 remains intact, the favoured view is this stock will move higher in extension for one more high before correcting the cycle from the 2018 low.

Source: https://elliottwave-forecast.com/stock-market/resonant-inc-resn-bottoming-higher/
 

Elliottwave-Forecast

Master Trader
Feb 17, 2017
2,426
9
84
www.elliottwave-forecast.com
In this technical blog, we will look at the past performance of 1 hour Elliott Wave Charts of Google, which we presented to members at the elliottwave-forecast. In which, the rally from 13 May 2021 low unfolded as an impulse structure. And showed a higher high sequence favored more upside extension to take place. Therefore, we advised members not to sell the stock & buy the dips in 3, 7, or 11 swings at the blue box areas. We will explain the structure & forecast below:

Google 1 Hour Elliott Wave Chart​

Google Elliott Wave View: Made New Highs From Blue Box Area

Above is the 1hr Elliott wave chart of Google from the 6/30/2021 Pre-Market update. In which, the rally to $2455.51 high ended wave (1) and wave (2) pullback ended $2389.25 low. Up from there, the stock made a new high in wave 1 above $2455.51 high & made a pullback in wave 2. The internals of that pullback was expected to unfold as a flat structure where wave ((a)) ended at $2431.30 low, wave ((b)) ended at $2460.42 high, and wave ((c)) was expected to reach $2426.81- $2405.89 blue box area. From there, buyers were expected to appear looking for further upside ideally or for a 3 wave bounce at least.

Google 1 Hour Elliott Wave Chart​

Google Elliott Wave View: Made New Highs From Blue Box Area

Here’s the 1hr Elliott wave chart of Google from the 7/04/2021 Weekend update. The stock is showing a strong reaction higher taking place from the blue box area after ending the double three correction at a $120.61 low. Allowed members to create a risk-free position shortly after taking the long positions at the blue box area. (It’s important to note that with further data we were able to downgrade the degree & a pullback to a double three instead of a flat correction lower).

Source: https://elliottwave-forecast.com/stock-market/google-made-new-highs-blue-box-area/
Post automatically merged:

Enphase Energy (NASDAQ: ENPH) is a technology company with headquarter in Fremont, California. Enphase designs and manufactures software-driven home energy solutions for the solar industry. It designs, develops, manufactures, and sells home energy solution that connect solar generation, energy storage, and management on one intelligent platform. Over the past 3 years, ENPH increases sales 42.4% on average. In the last quarter, gross margin came at a healthy 44.6%. Below we will look at the Elliott Wave outlook for the company.

ENPH Weekly Elliott Wave Chart​


From the all-time low, Enphase Energy ended a 5 waves move with Grand Super Cycle wave ((I)) at 229.04 on February 2021 high. The stock then pullback in Grand Super Cycle wave ((II)) which ended at 108.88. The stock has since rallied higher again in a new Grand Super Cycle wave ((III)). However, it needs to break above wave ((I)) at 229.04 to validate this view and rules out a larger double correction in wave ((II)). The rally from wave ((II)) low should end in 5 wave soon as wave (I). Then the stock should pullback in wave (II) to correct cycle from May 11, 2011 low before the rally resumes.

ENPH Daily Elliott Wave Chart​

Enphase Energy (ENPH) Elliott Wave Chart

Daily Chart above shows the rally from wave ((II)) low unfolding as a 5 waves impulse Elliott Wave structure. Up from wave ((II)), wave I ended at 146.76 and pullback in wave II ended at 130.65. The stock then resumes the rally higher in wave III towards 196.02. Pullback in wave IV is in progress to correct rally in wave III before potentially 1 more push higher in wave V to end wave (I). As far as pullback stays above 108.88, expect the stock to continue higher.

Source: https://elliottwave-forecast.com/stock-market/enphase-energy-enph-looking-end-5-waves-rally/
 

Elliottwave-Forecast

Master Trader
Feb 17, 2017
2,426
9
84
www.elliottwave-forecast.com
Hello fellow traders. In this technical blog we’re going to take a quick look at the Elliott Wave charts of OIL Futures ( $CL_F) , published in members area of the website. As our members know, we’ve been calling rally in the commodity due to impulsive bullish sequences. We recommended members to avoid selling in any proposed pull back and keep buying the dips in 3,7,11 swings. Recently OIL made pull back that has unfolded as Elliott Wave Zig Zag pattern . In the further text we are going to explain the Elliott Wave Pattern and trading strategy.

Before we take a look at the real market example, let’s explain Elliott Wave Zigzag.

Elliott Wave Zigzag is the most popular corrective pattern in Elliott Wave theory . It’s made of 3 swings which have 5-3-5 inner structure. Inner swings are labeled as A,B,C where A =5 waves, B=3 waves and C=5 waves. That means A and C can be either impulsive waves or diagonals. (Leading Diagonal in case of wave A or Ending in case of wave C) . Waves A and C must meet all conditions of being 5 wave structure, such as: having RSI divergency between wave subdivisions, ideal Fibonacci extensions and ideal retracements.

OIL


OIL Elliott Wave 1 Hour Chart 7.8.2021​

Current view suggests the commodity is doing 4 red correction that is unfolding as Elliott Wave Zig Zag Pattern. First leg ((a)) was very sharp decline, if we downgrade it we can see clear 5 waves. Then we got clear 3 waves bounce in ((b)), after which we got 5 waves down in ((c)). The price has already reached extremes from the peak. Equal legs ((a))-((b)) is marked as the blue box on the chart: 70.81-68.3 which is entry area for the buyers. As the main trend is bullish we expect buyers to appear for 3 waves bounce at least. Once bounce reaches 50 Fibs against the ((b)) black high, we will make long position risk free ( put SL at BE)
As our members know, Blue Boxes are no enemy areas , giving us 85% chance to get a bounce.

You can learn more about Elliott Wave Zig Zag Patterns at our Free Elliott Wave Educational Web Page.

OIL

OIL Elliott Wave 1 Hour Chart 7.12.2021​

Buyers appeared right at the equal legs area and we got decent reaction. Members who took long trades should have made positions risk free. Current view suggests 4 red pull back is done at the 70.79 low. Short term cycle from the mentioned low, looks completed as 5 waves rally- ((i)) black. After 3 waves pull back in ((ii)) , we expect to see further strength in commodity toward new highs ideally. If the price breaks 70.79 deeper correction would be in progress, as 7 swings pattern which should ideally provide us with new trading opportunities.

Keep in mind that market is dynamic and presented view could have changed in the mean time. Not every chart is trading recommendation. You can check most recent charts in the membership area of the site. Best instruments to trade are those having incomplete bullish or bearish swings sequences. We put them in Sequence Report and best among them are shown in the Live Trading Room.


Elliott Wave Forecast
Source: https://elliottwave-forecast.com/trading/oil-cl_f-buying-elliott-wave-zig-zag/
Post automatically merged:

Since the crash of March 2020, all stocks have tried to recover what they lost and P&G was no exception. P&G did not only recover the lost, but It also reached historic highs. Now, we are going to try to build an impulse from wave II with a first target to $154.00 next $167.50 and $174.00, depending how the structure is developing.

P&G Old Daily Chart

P&G Daily Chart As we see in the daily chart, P&G built an impulse ((1)), ((2)), ((3)), ((4)), and ((5)) that we call I in red and it ended at 146.92. Then, the stock dropped in 7 swings down ((W)), ((X)) and ((Y)) forming a double correction as wave II. This wave II bounced from 121.54 dollars missing our ideal level for a few cents at 120.68. (If you want to learn more about Elliott Wave Theory, please follow this link: Elliott Wave Theory).

P&G Daily Chart

P&G Daily Chart

P&G rallied, and it completed wave ((1)) at 138.63 dollars. Also, we have seen a pullback that bounced at 130.19 dollars, Fibonacci 50% retracement, ending for us the wave ((2)). Last month, the stock has been in ranging mode. Wave (1) ends at 139.18 and wave (2) made a double correction to complete at 131.93. As we stay above this level, we should continue higher to build a new impulse as wave ((3)) as you could see in the chart above. Short term we are expecting a small pullback, at the beginning of the week, to correct wave 1 before continuer higher.

Source: https://elliottwave-forecast.com/stock-market/pg-ranging-mode-july-rally-month/
 

Elliottwave-Forecast

Master Trader
Feb 17, 2017
2,426
9
84
www.elliottwave-forecast.com
The British Pound ETF $FXB Longer Term Cycles and Elliott Wave

Firstly the British Pound Sterling tracking ETF fund FXB inception date was 6/21/2006. The bearish cycle lower from the November 2007 highs in FXB is favored ended in this analysis. The British Pound Sterling has been the currency of the Bank of England since 1694. Considering that date was back before there was a US Dollar to compare with and data readily available suggests price was at 2.6440 in 1972. Spot price in the GBPUSD foreign exchange was 1.0520 in 1995. Price was at 2.1161 in 2007 where it peaked and turned lower. This is where we will shift the focus to the FXB highs at 211.44 in November 2007.

Secondly the bearish cycle from the November 2007 into the January 2009 lows was clearly an Elliott Wave impulse in 5 waves. From there into the August 2009 highs appeared to be three waves. From there into the May 2010 lows appeared best as an impulse wave. From there into the July 2014 highs appeared to be an Elliott Wave flat correction. The analysis continues below the monthly chart.


Thirdly the turn lower from the July 2014 highs appears to be an impulse lower into the January 2017 lows. Price appeared to print a double three into the April 2018 highs. From there it appears another impulse completed in March 2020.

In conclusion : The instrument is currently correcting the cycle up from the March 2020 lows. While above there the currency can continue a longer term trend higher against the dollar.

Source: https://elliottwave-forecast.com/st...d-etf-fxb-longer-term-cycles-and-elliottwave/
Post automatically merged:

The Brazilian Bovespa Index Long Term Bullish Trend and Cycles

The Bovespa Index has been trending higher with other world indices. Since inception the cycles have shown a bullish trend. In early years not seen on this chart it rallied with other world indices trending higher into the May 2008 highs. It then corrected the whole bullish cycle from the beginning. That was while most other world indices were in a pullback lower. The index ended that larger degree correction in October 2008. At this point is where the index corrected the whole decades long bullish cycle. Thus the October 2008 lows is from where this bullish cycle and swing analysis will begin.

First from the October 2008 lows the index rose into the November 2010 highs in what appears as an Elliott Wave impulse. From there the index endured an almost 6 year long correction of that cycle into the January 2016 lows.

The analysis continues below the chart.


Secondly I want mention the blue box area that was reached in the cycle up into the January 2020 highs. This is Fibonacci extension measured from zero up to the May 2008 highs then back down to the October 2008 lows. This is a typical place for the next cycle higher in any degree to reach as it did in January 2020.

Thirdly and in conclusion. The pullback into the March 2020 lows was enough to suggest it was correcting the cycle from the 2008 lows. This was shared by other world indices and many others have already made new yearly highs in their bullish cycles. This emerging market index was no different and eventually did get back above the January 2020 highs. From the March 2020 lows the index appears to be an impulse when looked at in the lower time frames. The index should ideally see another couple of highs in the 140000 area before it corrects the cycle up from the March 2020 lows. This is pretty much in line with other correlated world indices. There should be a bright future bullish outcome in the index while above the March 2020 lows.

Source: https://elliottwave-forecast.com/st...spa-index-long-term-bullish-trend-and-cycles/
 

Elliottwave-Forecast

Master Trader
Feb 17, 2017
2,426
9
84
www.elliottwave-forecast.com
Franco Nevada (ticker: FNV) is a leading gold royalty and stream company with one of the largest and most diversified portfolio of cash flow-producing assets. The company’s business model provides investors with gold price and exploration optionality while limiting exposure to many of the risks of operating companies. Franco-Nevada is debt free and uses the company’s free cash flow to expand Franco-Nevada’s portfolio and pay dividends.

Franco Nevada (FNV) Monthly Elliott Wave Chart​


FNV rally from all-time low is in progress as 5 waves impulse Elliott Wave structure. Wave (I) ended at 86.06 and pullback in wave (II) ended at 58.26. The stock then resumed higher in wave (III) towards 166.11 and wave (IV) pullback ended at 105.62. Wave (V) is currently in progress and subdivide into another 5 waves in lesser degree. Up from wave (IV) low on 3/1/2021 low, wave I ended at 155.89. The stock is now correcting cycle from 3/1 low in 3, 7, or 11 swing before the rally resumes.

FNV Daily Elliott Wave Chart​

FNV Elliott Wave Chart

FNV is currently within wave (V) from all-time low. Up from wave (IV), wave ((1)) ended at 123 and pullback in wave ((2)) ended at 121.2. Wave ((3)) ended at 154.15, wave ((4)) pullback ended at 145.71, and wave ((5)) ended at 155.89. This completed wave I of (V). Wave II pullback is in progress to correct cycle from wave (IV) low on 3/1/2021 low before the rally resumes. Down from wave I, wave ((A)) ended at 142.01, and wave ((B)) can still fail while below wave I at 155.89. Afterwards, it should turn lower 1 more time in wave ((C)) before wave II completes and the stock resumes higher.

Source: https://elliottwave-forecast.com/stock-market/franco-nevada-fnv-correcting-cycle-march-2021-low/
 

Elliottwave-Forecast

Master Trader
Feb 17, 2017
2,426
9
84
www.elliottwave-forecast.com
Lets revisit Arcimoto and see what the Elliottwave analysis presents. When I previously analyzed this stock, I was expecting one final leg higher before a sizable correction took place. In summary, Arcimoto is an electric vehicle company headquartered in Eugene, Oregon. Arcimoto manufactures and sells the Fun Utility Vehicle, or FUV, a tandem two-seat, three-wheeled electric vehicle. They also sell van-variations on the design “Rapid Responder” for emergency services, and “Deliverator” for last-mile deliveries.

Lets take a look at the previous Elliottwave view done in December 2020:

Arcimoto

As you can see, I was expecting a final peak to take place before a larger Red II correction. What I wasn't expecting however, was a powerful extended wave ((5)) to take place. Sometimes wave 1s extend, sometimes 3s, and sometimes 5s. That is the nature of impulsive waves. Typically, wave 3 is the extended wave, but this is not always the case.

Lets take a look at the current view and see what the instrument ended up doing.

Arcimoto Elliottwave View July 2021

Arcimoto

Medium term term view from the peak set in Feb 2021. It is currently favoured that the peak was a larger degree peak. After that, the correction in Red II unfolded in an ABC correction. The Red II low failed to reach the ideal 100% area. The depth of the 100% was too deep to be realistic before a larger reaction was bound to take place.

The reaction from the 7.27 low has enough momentum to signal the end to the cycle from the Feb 2021 peak. Currently, as long as the recent low at 7.27 remains intact, further upside is favoured to take place.

Source: https://elliottwave-forecast.com/stock-market/arcimoto-inc-fuv-long-term-low-place/
 

Elliottwave-Forecast

Master Trader
Feb 17, 2017
2,426
9
84
www.elliottwave-forecast.com
In this technical blog we’re going to take a quick look at the Elliott Wave charts of EURNZD Forex Pair published in members area of the Elliottwave-Forecast . As our members know, EURNZD is correcting the cycle from the 1.8228 peak. Recovery looks incomplete at the moment. The pair is showing higher high sequences from the February low, suggesting further strength toward 1.7269 as far as 1.6604 pivot holds. Recently we got pull back that has given us opportunity to enter long trade. In further text we’re going to explain the forecast and trading strategy.

EURNZD 4 Hour Elliott Wave Analysis 7.4.2021​

Current view suggests EURNZD ended 5th swing in the February cycle as Double Three W red. Now doing X rec connector that still looks incomplete. We believe the pair still could give us another leg down as proposed on the chart. Although calling for more short term weakness, we recommended members to avoid selling at this stage. Strategy is waiting for extremes from W red peak to be reached before entering long trades again. Extreme zone comes at the equal legs ((w))-((x)) at 1.6755-1.6686 ( buyers zone). As the pair shows higher high sequences from the February low, we expect to see at least 3 waves bounce from there.Once the price reaches 50 Fibs against the ((x)) black peak, we will make long positions risk free ( put SL at BE).

Reminder: You can learn about Elliott Wave Patterns at our Free Elliott Wave Educational Web Page.

EURNZD

EURNZD 4 Hour Elliott Wave Analysis 7.6.2021​

Eventually EURNZD made extension down toward blue box area 1.6755-1.6686 and found buyers as we expected. We got nice reaction from the blue box, which reached 50 fibs against the connector, so member who opened long positions are risk free at this stage . X red ended at 1.6693 , proposed short term pull back should ideally hold above that low in order to keep this forecast in place.

Keep in mind that market is dynamic and presented view could have changed in the mean time. Best instruments to trade are those having incomplete bullish or bearish swings sequences. We put them in Sequence Report and best among them are shown in the Live Trading Room. You can check most recent charts in the membership area of the site.

EURNZD

EURNZD 4 Hour Elliott Wave Analysis 7.6.2021​

The price held above 1.6693 low and we got further rally as expected. Rally from the 1.6693 low looks like 5 waves. ((b)) black pull back is expected to give us 3 waves against the mentioned low, before further rally resumes ideally. We would like to see break above W red peak to confirm next leg up is in progress.

Keep in mind that market is dynamic and presented view could have changed in the mean time. You can check most recent charts in the membership area of the site. Best instruments to trade are those having incomplete bullish or bearish swings sequences. We put them in Sequence Report and best among them are shown in the Live Trading Room.

EURNZD

Elliott Wave Forecast
Source: https://elliottwave-forecast.com/trading/eurnzd-buying-dips-blue-box/
 

Elliottwave-Forecast

Master Trader
Feb 17, 2017
2,426
9
84
www.elliottwave-forecast.com
Hello fellow traders. As our members know Indexes have been giving us a lot of good trading opportunities recently. Another instruments that we have been trading lately is NIFTY from India. In this technical blog we’re going to take a quick look at the Elliott Wave charts of NIFTY published in members area of the website. The index is showing impulsive bullish sequences in the cycle from the March 2020 low. Consequently we are calling for more strength in the Index, suggesting members to avoid selling it and keep on buying the dips in 3,7,11 swings. In further text we’re going to explain Elliott Wave Forecast and how we traded the instrument.

NIFTY 1 Hour Elliott Wave Analysis 7.1.2021​

NIFTY is bullish against the 15454.4 low in first degree. The Index ended cycle from that low as 5 waves. Currently we are doing 3 waves pull back in ((ii)) intraday pull back. Correction looks incomplete at the moment suggesting more downside toward 15644.6-15525.5 area. Strategy is buying the dips at blue box area. As the main trading is bullish , we expect to see 3 waves bounce at least from the blue box. As soon as the price reach 50 Fibonacci Retracement against the (b) blue peak, we should make long positions Risk Free. We will put SL at BE and book partial profits.

NIFTY

NIFTY 1 Hour Elliott Wave Analysis 7.5.2021​

NIFTY found buyers at the blue box zone as expected. As the price already reached and exceeded 50 fibs against the (b) high, we made long positions risk free and took the partial profits. We already got clear 3 waves so wave ((ii)) pull back can be completed at 15635 low. We need to see break above ((ii)) black high to confirm next leg up is in progress. Alternatively pull back still can turn out as a double or flat. In that case our long trades would be stopped at BE ( no loss) , and we will enter again at the next set of equal legs.

NIFTY

NIFTY 1 Hour Elliott Wave Analysis 7.8.2021​

We got nice rally from the blue box, however it didn't break previous ((i)) high. In the mean time pivot at 15635 low has given up. Current view suggests ((ii)) can be still in progress toward 15634.16-15461.3 area. Longs from previous blue box are still active as far as the price holds above last low. If we reach new blog box, we will get chance to enter the long side again. Don't recommend selling in proposed push down and favor the long side ,buying the dips at the next extremes against the 15452.5 low.

NIFTY

NIFTY 1 Hour Elliott Wave Analysis 7.16.2021​

Eventually NIFTY made extension down toward blue box area 15634.16-15461.3. The index found buyers again. We got nice reaction from the blue box, breaking toward new highs. Members who are long from the blue box are enjoying profits in risk free trades. NIFTY remains bullish against the 15634.9 low in first degree. It's expected to keep finding buyers in intraday pull backs in 3,7,11 swings.

Keep in mind that market is dynamic and presented view could have changed in the mean time. Best instruments to trade are those having incomplete bullish or bearish swings sequences. We put them in Sequence Report and best among them are shown in the Live Trading Room. You can check most recent charts in the membership area of the site.

NIFTY

Source: https://elliottwave-forecast.com/trading/nifty-buying-opportunity-blue-box/
Post automatically merged:

Goodyear Tire and Rubber Company is a multinational tire manufacturing company based in Akron, Ohio, USA. The stock being a component of the S&P MidCap 400 index can be traded under ticker $GT at NASDAQ. As a matter of fact, Goodyear manufactures tires for automobiles, commercial trucks, light trucks, motorcycles, SUVs, race cars, airplanes, farm equipment and heavy earth-moving machinery. Currently, we can see commodities like oil, rubber, cotton turning higher against weakining US dollar. Hereby, Goodyear being one of the top four tire manufacturers worldwide should be a great opportunity for investors to diversify their portfolio by indirect investement in the rising commodity prices.

Goodyear Quarterly Elliott Wave Analysis 07.17.2021​

The Quartely chart below shows the Goodyear shares $GT traded at NASDAQ. First, the stock price has developed a leading diagonal higher in black wave ((I)) of a grand super cycle degree. It has printed the all-time highs in the first quarter of 1998 at 76.75. From the highs, a correction lower in black wave ((II)) has unfolded as an Elliott wave zigzag pattern with a truncated (c) wave. Frequently, lack of space to the downside makes many stocks truncate in the last swing without reaching the usual extension of 100%. Goodyear has printed an important bottom on the first quarter of 2009 at 3.17. As a matter of fact, the stock price has lost 96% of its value within 11 years.

From 2009 lows, a new cycle in wave ((III)) has already started and should extend towards 76.75 highs and beyond. Then, the target for wave ((III)) will be towards 80.05-127.53 area and even higher.

In shorter cycles, from 2009 lows a cycle higher in blue wave (I) has ended in the last quarter of 2015 at 35.30. From the highs, a correction lower in blue wave (II) has developed an expanded flat pattern. It has found a bottom in March 2020 at 4.09. From there, a new cycle in blue wave (III) of black wave wave ((III)) has started and should extend higher.

Goodyear Elliott Wave Quearterly

Goodyear Daily Elliott Wave Analysis 07.17.2021​

The daily chart below shows in more detail the first stages of the advance higher in blue wave (III). From the March 2020 lows, red wave I has developed so far waves ((1))-((3)). From the June 2021 highs, a correction lower in wave ((4)) is currently in progress. Now, it should find support in 7 or 11 swings above 5.73 lows. Currently, while below 17.83, a double three correction may reach into 13.81-11.33 blue box area. From there, a rally to new highs within wave ((5)) of red wave I or a bounce in 3 waves as minimum should take place.

Medium-term, investors and traders can be looking to buy $GT in a pullback in red wave II against 4.09 lows in 3, 7 or 11 swings targeting 80.05-127.53 area in a long run.

Goodyear Elliott Wave Daily

Source: https://elliottwave-forecast.com/stock-market/goodyear-tire-ramping/
 

Elliottwave-Forecast

Master Trader
Feb 17, 2017
2,426
9
84
www.elliottwave-forecast.com
$CPER Copper Long Term Bullish Cycles

Firstly the CPER Copper Index Tracking instrument has an inception date of 11/15/2011. There is data in the HG_F copper futures before this going back many years. That shows copper made an all time high on February 15th, 2011 at 4.649. Translated into this instrument, it is mentioned on the monthly chart. The decline from there into the January 2016 lows appeared to have been a double three in the commodity HG_F. Thus I will work with that idea in this CPER instrument.

The analysis continues below the CPER monthly chart.

Secondly the CPER Copper Index Tracking instrument from the all time highs made what is favored to be a double three correction lower. This ended at the 12.97 lows in January 2016. From the January 2016 lows up into the December 2017 highs appeared to be another double three structure. The bounce was strong enough on momentum indicators to suggest it had ended the cycle lower from the all time highs.

Thirdly, the CPER Copper Index Tracking instrument decline from the December 2017 highs is very ambiguous. This means it is open to more than one interpretation as is most any chart by an Elliott wave analyst. The key points here are as follows. From the 12.87 low from March 20th 2020 created a bearish sequence by taking out the lows from January 2016. This means it could have been a 5th swing lower from the all time highs. The bounce from there in our trend system looks strong and impulsive as well as again suggesting it ended the cycle lower from the all time highs.

In conclusion: Copper HG_F has not made another low under the January 2016 lows as did CPER. Each have went well past the December 2017 highs. The price action has denied the usual 7th swing lower in CPER. In the current pullback this instrument should hold well above the March 2020 lows & ideally turn higher from the blue box area shown as it currently corrects the cycle up from there.

Source: https://elliottwave-forecast.com/stock-market/cper-copper-long-term-bullish-cycles/
 

Elliottwave-Forecast

Master Trader
Feb 17, 2017
2,426
9
84
www.elliottwave-forecast.com
The last time I analyzed DataDog was in August of 2020. At the time, I was favouring further upside to take place before possibly experiencing a large pullback to correct the cycle from 2019 low. Real quick, lets refresh on what Data Dog does:

“Datadog helps developers and operations teams see their full infrastructure – cloud, servers, apps, services, metrics, and more – all in one place. This includes real-time interactive dashboards that can be customized to a team’s specific needs, full-text search capabilities for metrics and events, sharing and discussion tools so teams can collaborate using the insights they surface, targeted alerts for critical issues, and API access to accommodate unique infrastructures.

Datadog also integrates with various cloud, enterprise, and developer software tools out of the box, so established team workflows will be unchanged and uninterrupted when adopting Datadog’s service.”


Lets take a look at the Elliottwave view I presented nearly a year ago:

Data Dog 2020

At the time, I was favouring one more high to take place in the cycle from 2019 low. It was getting higher risk to be adding new long term positions into this stock at the time. Fast forward to today:

DataDog Elliottwave Daily View July 2021:

DataDog

As you can see, the correction took place as anticipated. After peaking in October of 2020, the correction has unfolded as an expanded flat correction. After setting a low in May of 2021, the stock has shown an impulsive structure.

From the Red II low set at 69.73 on May 6 2021, the structure has unfolded as an impulsive advance. Right now, one more high is needed at least, before the sequence can be complete. It is favoured that ((1)) is likely to peak in the weeks to come for a ((2)) pullback. Before moving higher again.

Source: https://elliottwave-forecast.com/stock-market/datadog-ddog-ready-move-higher/
Post automatically merged:

Since the crash of March 2020, all stocks have tried to recover what they lost and JNJ was no exception. Johnson & Johnson did not only recover the lost, but It also reached historic highs. Now, we are going to try to build a wedge from the March 2020 lows with a target above $176.

JNJ Old Daily Chart

JNJ Daily Chart

In the last chart we can clearly see that after the fall of March 2020, JNJ had a strong and rapid recovery in 3 swings. The wave ((3)) had its highest point at 173.69 where JNJ was rejected by the market. This rejection did another double correction structure and overlaps the wave ((1)) zone to end the wave ((4)) and from here it should continue higher to complete wave ((5)) as a diagonal. (If you want to learn more about Elliott Wave Theory, please follow this link: Elliott Wave Theory).

JNJ Daily Chart

JNJ Daily Chart

The share price continued to rise until reaching 172.79, which we call wave (1) and you can see the structure is a Leading Diagonal. From there, we have a clear correction in a zig zag as wave (2) missing our ideal entry for a few cents. Short term, we already have completed the wave 1 of (3) at 171.20 and wave 2 of (3) correction at 165.25. JNJ is moving forward with the rally and needs to break 171.20 to confirm the Elliott structure. We cannot rule out yet the possibility of a flat correction as wave 2. That means it could reach 164.94 before continue higher. That count is valid as we stay above 161.70 and the possible target to complete wave ((5)) comes in 178.97 – 187.48 area.

Source: https://elliottwave-forecast.com/stock-market/jnj-continue-rally-missed-entry/
 

Elliottwave-Forecast

Master Trader
Feb 17, 2017
2,426
9
84
www.elliottwave-forecast.com
Hello fellow traders. In this technical blog we’re going to take a quick look at the Elliott Wave charts of NIKKEI published in members area of the Elliottwave-Forecast . As our members know, NIKKEI is showing lower low sequences in the cycle from the February 16th peak. Recently we got recovery that has unfolded as Elliott Wave Double Three pattern that has given us opportunity to enter short trades. In further text we’re going to explain the forecast and Elliott Wave Pattern and trading strategy.

Before we take a look at the real market example, let’s explain Elliott Wave Double Three pattern.

Elliott Wave Double Three Pattern​

Double three is the common pattern in the market , also known as 7 swing structure. It’s a reliable pattern which is giving us good trading entries with clearly defined invalidation levels.
The picture below presents what Elliott Wave Double Three pattern looks like. It has (W),(X),(Y) labeling and 3,3,3 inner structure, which means all of these 3 legs are corrective sequences. Each (W) and (Y) are made of 3 swings , they’re having A,B,C structure in lower degree, or alternatively they can have W,X,Y labeling.

Nikkei

NIKKEI 1 Hour Elliott Wave Analysis 7.22.2021​

NIKKEI ended 5 waves down from the 28854 high. Currently the index is giving us ((b)) recovery against the mentioned peak. Correction is unfolding as Elliott Wave Double Three Pattern with (w) (x) (y) inner labeling. Wave ((b)) black recovery looks incomplete at the moment. It shows higher high structure, suggesting another leg up once short term pull back b red completes. The Index is looking for 28236-28733 area, to complete Double Three correction.

NIKKEI

NIKKEI 1 Hour Elliott Wave Analysis 7.23.2021​

NIKKEI made rally as we expected. Price reached the extremes at 28234-28730 ( sellers zone). Minimum requirements are there. Recovery can complete any moment. We like to be sellers at the blue box zone, looking for further drop toward new lows ideally or in 3 waves pull back at least. Invalidation level for the trade is break above 1.618 fib extension (28730).

As our members know, Blue Boxes are no enemy areas , giving us 85% chance to get a reaction. Once the price reaches 50 Fibs against the (x) blue low, we will make long positions risk free ( put SL at BE).


NIKKEI 1 Hour Elliott Wave Analysis 7.27.2021​

Sellers appeared at the blue box and we are getting good reaction from there. The decline from the blue box reached 50 fibs against the (x) connector, as a result short positions from the blue box are Risk Free. As far as the price stays below 28247, wave ((b)) recovery can be counted completed as Double Three. Once short term (ii) completes further drop should follow. We would like to see break below ((a)) black , 07/19 low to confirm next leg down is in progress.

Keep in mind that market is dynamic and presented view could have changed in the mean time. You can check most recent charts in the membership area of the site. Best instruments to trade are those having incomplete bullish or bearish swings sequences. We put them in Sequence Report and best among them are shown in the Live Trading Room.


Elliott Wave Forecast
Source: https://elliottwave-forecast.com/elliottwave/nikkei-found-sellers-elliott-wave-double-three-pattern/
 

Elliottwave-Forecast

Master Trader
Feb 17, 2017
2,426
9
84
www.elliottwave-forecast.com
Nikkei Futures (NKD) shows a lower low bearish sequence from February 16, 2021 peak. The Index also shows a 5 swing bearish sequence from June 15, 2021 peak. Both of these sequence suggest Nikkei likely see further downside. Below is the chart showing a 5 swing sequence from June 15, 2021 peak.

Nikkei (NKD) 5 Swing Sequence from June peak​


The chart above shows a 5 swing sequence from June 15, 2021 peak. Please note this is not an Elliott Wave label, rather it's just a swing count. A 5 swing is an incomplete sequence as corrective sequence always ends in 3, 7, or 11 swing. We can label this move in 2 ways, but both with the same conclusion that it is likely to see further downside. The first way to label is to treat the 5 swing as part of a 7 swing WXY double three structure. Below is the WXY 7 swing general structure

Double Three (7 swing WXY) Elliott Wave Structure​


If the 5 swing move lower is labelled as double three WXY, then Nikkei should continue lower in 7th swing to end the WXY pattern. The 100% - 123.6% Fibonacci extension target in 7 swing comes at 26309 - 26797.

A second way to look at the move lower from June 15 peak is to label it as a 5 waves diagonal which ends wave A at the low as the chart below shows:


In the chart above, the Index can see a 3 waves rally to correct the decline from June 15, 2021 peak before it turns lower. Either way, more downside is expected in the Index.

Source: https://elliottwave-forecast.com/st...kei-5-swing-sequence-favors-further-downside/
Post automatically merged:

In this technical blog, we will look at the past performance of Elliott Wave Charts of General Electric stock ticker symbol: $GE, which we presented to members at the elliottwave-forecast. In which, the rally from 13 May 2020 low unfolded in 3 wave structure with extended 3rd wave. Therefore, we knew that the structure is taking a form of an impulse sequence & it should see another new high to complete the 5 waves rally. So, we advised members not to sell it & buy the dips in 3, 7, or 11 swings at the blue box areas. We will explain the structure & forecast below:

General Electric Elliott Wave Chart​

General Electric ($GE) Longs Are Risk Free

Here's Daily Elliott wave Chart from the 7/18/2021 weekend update. In which, the stock is showing an impulse rally higher from 5.13.2020 low where wave ((1)) ended at $8.57 high. Wave ((2)) ended at $5.93 low, wave ((3)) ended at $14.42 high and made a pullback in wave ((4)). The internals of that pullback unfolded as Elliott wave double three structure where wave (W) ended at $11.95 low. Wave (X) ended at $14.40 high and wave (Y) was expected to reach $11.92- $10.39 blue box area from where reaction higher was expected to take place.

General Electric Elliott Wave Chart​

General Electric ($GE) Longs Are Risk Free

Here’s the Daily Elliott wave Chart from the 7/25/2021 update. In which the stock is showing a reaction higher from the blue box area. Right after ending the double three correction within the blue box area. Allowed members to create a risk-free position shortly after taking the long positions at the blue box area. However, a break above $14.42 high is still needed to confirm the next extension higher & avoid double correction lower.

Source: https://elliottwave-forecast.com/stock-market/general-electric-longs-risk-free/
 

Elliottwave-Forecast

Master Trader
Feb 17, 2017
2,426
9
84
www.elliottwave-forecast.com
GBPJPY is another pair that has given us nice trading opportunity lately . The pair has been showing impulsive bullish sequences in the cycle from the March 2020 low (124.27). Recently it made clear 3 waves pull back and found buyers as we were expecting . Pull back unfolded as Elliott Wave Double Three Pattern. In this technical blog we’re going to take a quick look at the charts of GBPJPY published in members area of the website and explain the Elliott Wave structure and trading strategy.

Before we take a look at the real market example, let’s explain Elliott Wave Double Three pattern.

Elliott Wave Double Three Pattern​

Double three is the common pattern in the market , also known as 7 swing structure. It’s a reliable pattern which is giving us good trading entries with clearly defined invalidation levels.
The picture below presents what Elliott Wave Double Three pattern looks like. It has (W),(X),(Y) labeling and 3,3,3 inner structure, which means all of these 3 legs are corrective sequences. Each (W) and (Y) are made of 3 swings , they’re having A,B,C structure in lower degree, or alternatively they can have W,X,Y labeling.

GBPJPY

GBPJPY Elliott Wave 4 Hour Chart 7.15.2021​

Current view suggests the pair is doing ((4)) black correction that is unfolding as Elliott Wave Double Three Pattern with (W)(X)(Y) inner labeling. First leg (A) is showing corrective sequences ABC red. Then we got 3 waves bounce in (X) and finally doing (Y) blue that also should have corrective sequences. Pull back looks incomplete at this stage. Suggesting we should see another leg down toward extreme zone : 150.39 -147.71 area. As the main trend is bullish we expect buyers to appear at the blue box for 3 waves bounce at least. Once bounce reaches 50 Fibs against the (X) blue high, we will make long position risk free ( put SL at BE). Invalidation for the trade would be break below 1.618 fibs extension: 147.71
As our members know, Blue Boxes are no enemy areas , giving us 85% chance to get a bounce.

You can learn more about Elliott Wave Double Three Patterns at our Free Elliott Wave Educational Web Page.

GBPJPY

GBPJPY Elliott Wave 4 Hour Chart 7.31.2021​

Buyers appeared at the blue box and we are getting good reaction from there. The rally from the blue box reached 50 fibs against the (X) connector, as a result members who took long positions are enjoying profits in a risk free positions. As far as the price stays above current low : 148.43, we can consider ((4)) pull back done as Elliott Wave Double Three Pattern. Keep in mind that market is dynamic and presented view could have changed in the mean time. You can check most recent charts in the membership area of the site. Best instruments to trade are those having incomplete bullish or bearish swings sequences. We put them in Sequence Report and best among them are shown in the Live Trading Room.


Elliott Wave Forecast
Source: https://elliottwave-forecast.com/trading/gbpjpy-buying-elliott-wave-double-three/
Post automatically merged:

This blog provides an Elliott Wave update to our previous blog here --> Shopify (NYSE: SHOP) Wave V in progress Shopify has extended higher to end wave III as the previous blog suggests. Now it is in wave IV correction and still has chance to extend higher again later.

SHOP Weekly Chart August 2, 2021​


Weekly Chart of Shopify above shows that the stock continues to make all-time high and currently looking for wave IV of (V) pullback. Potential target for wave IV is 23.6 - 50% fibonacci retracement of wave III at 1339 - 1500. It has currently pulled back to 23.6% Fibonacci retracement but short term can still see further extension lower before ending wave IV. Afterwards, the stock has scope to extend 1 more leg higher to complete wave V of (V). This should also complete wave ((I)) and end cycle from all-time low. Stock should then correct in a large wave ((II)) pullback to correct the entire rally from all-time low in 3, 7, or 11 swing.

SHOP Daily Chart August 2, 2021​


The Daily Elliott Wave chart of Shopify above shows wave IV in progress to correct cycle from May 13 low. The pullback should unfold in 3, 7, or 11 swing with 1 more possible push higher. As far as pivot at 1017.31 low stays intact, expect dips to find buyers for further upside.

SHOP 1 Hour Chart August 2, 2021​


1 hour Elliott Wave Chart for Shopify above shows that wave IV pullback is in progress as a double three Elliott Wave structure. Down from wave III, wave ((W)) ended at 1513.04 and bounce in wave ((X)) ended at 1610. Wave ((Y)) lower is in progress as a zigzag and can see further downside to reach 1373 - 1463 area. Buyers can appear from this blue box area for more upside or 3 waves rally at least.

Source: https://elliottwave-forecast.com/stock-market/shopify-nyse-shop-pulling-back-wave-iv/
Post automatically merged:

After 9 months, we present here an updated view on the Swiss Market Index (SMI). SMI represents a capitalization-weighted measure of the 20 most significant stocks on the SIX Swiss Exchange in Zurich; the ticker is $SMI. In the initial blog article from November 2020, we were calling the “COVID-19” drop in February-March 2020 to become a significant low in world indices. We were right. Now, SMI is trading at the all-time highs. Here we will discuss the updated monthly but also the more detailed daily views.

SMI Monthly Elliott Wave Analysis 08.01.2021​

The monthly chart below shows the SMI index $SMI listed at SIX Swiss. From the all-time lows, the index price has developed a cycle higher in wave (I) of a super cycle degree. It has ended by printing a high in July 1998 at 8491. From the highs, a correction lower in wave (II) has retraced during following 10 years a half of the of the motive cycle higher towards March 2009 lows at 4216. Technically speaking, the decline can be seen as an Elliott Wave running flat pattern.

From the lows at 4216, another cycle higher in wave (III) has been confirmed by breaking 8491 highs. Later on in February 2020, it has printed a top at 11272. From the highs, a sharp decline in wave (IV) has unfolded as a straight down correction. It has found its bottom in March 2020 at 7648.5. While above there, SMI is trading already within wave (V). Indeed, this has been confirmed by breaking above 11272 to the new all-time highs.

SMI Elliott Wave Monthly

SMI Daily Elliott Wave Analysis 08.01.2021​

The daily chart below shows in more detail the advance higher in wave I of (V). From the March 2020 lows, wave I demonstrates three nests: ((1))-((2)), (1)-(2), 1-2. Recently, we saw an accelration higher in red 3 of blue (3) of black ((3)). Even though the main acceleration might be already over, we anticipate a series of 5th waves which should provide the new all-time highs. The short-term pullbacks should remain supported in 3, 7, 11 swings for more upside to complete the impulsive structure within wave I.

Later, we expect a pullback in wave II to take place which should correct the cycle in wave I from March 2020 lows. It should find support in 3, 7, 11 swings above 7648.5 lows for an extension higher in wave III of (V). Therefore, investors can be waiting end 2021 - start 2022 to buy SMI against 7648.5 lows for an extension higher in waves III-V of (V).

SMI Elliott Wave Daily

Source: https://elliottwave-forecast.com/stock-market/smi-swiss-market-index-2021/
Post automatically merged:

Électricité de France S.A. (literally, Electricity of France), commonly known as EDF, is a French multinational electric utility company. The operations include electricity generation and distribution, power plant design, construction and dismantling, energy trading and transport. Founded in 1946 and headquartered in Paris, France, the company is largely owned by the French state. EDF is a part of CAC Next 20 index. Even though the energy stock demonstrates a high attraction like that of E.ON from Germany, the stock price has strongly depreciated in 12,5 years. As a matter of fact, it has lost 93% of its value from November 2007 to March 2020.

Today, we see energy sector strongly turning up. Commodities like oil, gas, uranium are trading higher. In consequence, utility company like EDF should also catch up the overall bullish market. Therefore, investors can be looking to buy the french giant EDF in order to diversify their portfolio by indirect investment in rising commodity prices.

EDF Monthly Elliott Wave Analysis 08.01.2021​

The monthly chart below shows the EDF stock $EDF traded at Euronext. From the all-time lows, the stock price has developed a cycle higher in black wave ((I)) of grand super cycle degree towards the all-time highs on November 2007 at 81.36. From the highs, a correction lower in black wave ((II)) has unfolded as an Elliott wave zigzag pattern. It has printed an important bottom on March 2020 at 5.97. From March 2020 lows, a new cycle in wave ((III)) has already started and should extend towards 81.36 highs and even higher.

EDF Elliott Wave Monthly

EDF Daily Elliott Wave Analysis 08.01.2020​

The daily chart below shows in more detail the first stages of the advance higher in wave ((III)). From the March 2020 lows at 5.97, the initial impulsive advance in black wave ((1)) has ended at 13.57 in January 2021. From there, a correction in wave ((2)) has started and should find support above 5.97 lows in 3, 7 or 11 swings for more upside.

Without any doubt, current stock price at 10.26 Euro does possess a high attractivity for investors. While above 5.97 lows, investors can anticipate EDF to extend higher. In a long run, EDF should break to the new all-time highs above 81.36.

EDF Elliott Wave Daily

Source: https://elliottwave-forecast.com/stock-market/edf-electric-utility-giant-higher/
 

Elliottwave-Forecast

Master Trader
Feb 17, 2017
2,426
9
84
www.elliottwave-forecast.com
With Bitcoin having rallied over 40K from the March 2020 low, Crypto and Blockchain markets continue to show potential. Bit Digital is a company that experienced a large vertical rally in late 2020. After that, it has been correcting the whole rally in a large wave II.

Bit Digital touts itself as one of the world’s largest publicly-listed bitcoin mining companies. Bit Digital is a sustainability-focused generator of digital assets with large-scale, global mining operations representing a currently-owned maximum hash rate of 1,920 PH/S.

After ralling from 28 cents to a peak of 33.00, and then correcting back down to 3.97, traders should be aware of the extreme volatility inherent in the Bitcoin Mining sector.

Bit Digital Elliottwave View:

Bit Digital

Medium term term view from the all time low in March 2020. In Summary, there was a 5 waves advance with a very extended 5th wave. This impulse peaked in January 4/2021 at a price of 33.00. After that, a long pullback has taken place. This pullback found support within the blue box extreme area where buyers have begun to enter for a bounce. Right now, it is favoured that the instrument is in the middle of an initial wave (1) advance. It is important that we do not chase, and only trade clear structure pullbacks to blue box extremes in 3, 7 or 11 swing. The next area above where above pullback can take place is the 14.56 area.

Source: https://elliottwave-forecast.com/stock-market/bit-digital-inc-btbt-next-cycle-higher-commenced/
 

Elliottwave-Forecast

Master Trader
Feb 17, 2017
2,426
9
84
www.elliottwave-forecast.com
Volkswagen AG is a German multinational automotive manufacturing corporation. It designs, manufactures, and distributes passenger and commercial vehicles, motorcycles, engines, and turbomachinery. Today, it is the largest automaker in the world in terms of sales. Founded in 1937 and headquartered in Wolfsburg, Germany, the company is largely owned by Porsche and Piëch family. Volkswagen is a part of DAX30 and Eurostoxx 50 indices. One can trade it under the tickers $VOW3 and $VOW at XETRA.

Volkswagen Monthly Elliott Wave Analysis 08.08.2021​

The monthly chart below shows the Volkswagen stock $VOW3 traded at XETRA. From all-time lows, the stock price has developed an Elliott wave motive wave pattern. The cycle up in black wave ((I)) being of grand super cycle degree has ended by printing its top at all-time highs on March 2015 at 262.45. Within the grand super cycle ((I)), the blue waves (I), (III) and (V) of super cycle degree are impulsive waves. Moreover, wave (III) shows an extension. Between wave (V) and wave (III), one can see a divergence in RSI. All these characteristics supported the maturity of the grand super cycle in wave ((I)). After 5 waves up, according to Elliott wave principle, the price needs to retrace in 3 waves lower. Only then another advance higher can start.

Indeed, a correction lower in black wave ((II)) has developped a zigzag pattern. It has ended on March 2020 at 79.38. From there, a new cycle in black wave ((III)) has started and should break above 262.45 high. The target will be 342.17-504.45 area and possibly higher.

Volkswagen Elliott Wave Monthly

Volkswagen Daily Elliott Wave Analysis 08.08.2021​

The daily chart below shows in more detail the advance higher in blue wave (I) of black wave ((III)). First, red wave I of blue wave (I) has developed a leading diagonal pattern ended in June 2020 at 155.54. From there, a pullback in wave II has found a bottom at 122.96. Then, wave III has reached 252.20 in March 2021. A pullback, hereafter, in red wave IV saw a low at 198.18 in July 2021. While above there, expect more upside within wave V. Medium-term, Volkswagen can reach 265.02-285.77 area. Then a larger pullback in wave (II) should retrace a part of the advance in wave (I) before acceleration in wave (III) of ((III)) should take place.

Long-term Investors should not chase the BMW stock at current prices. Since the world indices might be ending their cycles from March 2020 in the second half of 2021, it is reasonable to wait for a pullback in the Volkswagen stock as well. Investors and traders can be looking to buy $VOW3 in a pullback against 79.38 lows in 3, 7 or 11 swings targeting 342.17-504.45 area in a long run.

Volkswagen Elliott Wave Daily

Source: https://elliottwave-forecast.com/stock-market/buy-largest-automaker-volkswagen/
Post automatically merged:

In this technical blog, we will look at the past performance of 1 hour Elliott Wave Charts of Facebook, which we presented to members at the elliottwave-forecast. In which, the rally from 07 July 2021 low unfolded as an impulse structure. And showed a bullish sequence from January lows favored more upside extension to take place. Therefore, we advised members not to sell the stock & buy the dips in 3, 7, or 11 swings at the blue box areas. We will explain the structure & forecast below:

Facebook 1 Hour Elliott Wave Chart​

Facebook Starts Reacting Higher From Blue Box Area

Here's 1hr Elliott wave chart from 7/31/2021 weekend update. In which, the rally from 7/20/2021 low ($334.50) unfolded in 5 wave impulse sequence & completed wave (1) at $377.55 high. Down from there, the stock made a pullback in wave (2). The internals of that pullback unfolded as Elliott wave double three structure where wave W ended at $354 low. Wave X ended at $373.28 high and wave Y was expected to reach $349.80- $335.17 blue box area. From there, buyers were expected to appear looking for the next leg higher or for a 3 wave bounce at least.

Facebook Latest 1 Hour Elliott Wave Chart​

Facebook Starts Reacting Higher From Blue Box Area

Here's the Latest 1hr Elliott wave chart from the weekend update. In which the stock is showing a reaction higher from the blue box area. Right after ending the double three correction within the blue box area. Allowed members to create a risk-free position shortly after taking the long positions at the blue box area. However, a break above $377.55 high is still needed to confirm the next extension higher & avoid double correction lower.

Source: https://elliottwave-forecast.com/stock-market/facebook-starts-reacting-higher-blue-box/
Post automatically merged:

Hello fellow traders. In this technical blog we’re going to take a quick look at the Elliott Wave charts of NIFTY , published in members area of the website. As our members know, we’ve been calling rally in the Index due to impulsive bullish sequences. We recommended members to avoid selling in any proposed pull back and keep buying the dips in 3,7,11 swings. Recently NIFTY made pull back that has unfolded as Elliott Wave ZigZag pattern . In the further text we are going to explain the Elliott Wave Pattern and trading strategy.

Before we take a look at the real market example, let’s explain Elliott Wave Zigzag.

Elliott Wave Zigzag is the most popular corrective pattern in Elliott Wave theory . It’s made of 3 swings which have 5-3-5 inner structure. Inner swings are labeled as A,B,C where A =5 waves, B=3 waves and C=5 waves. That means A and C can be either impulsive waves or diagonals. (Leading Diagonal in case of wave A or Ending in case of wave C) . Waves A and C must meet all conditions of being 5 wave structure, such as: having RSI divergency between wave subdivisions, ideal Fibonacci extensions and ideal retracements.

NIFTY

NIFTY Elliott Wave 1 Hour Chart 7.28.2021​

At the chart below we can see what Elliott Wave ZigZag looks like in real market. Wave 4 red correction reached equal legs at 15514.48 (buyers zone). First leg of the 4 red pull back - ((a)) black, has subdivision in 5 waves. Then we got 3 waves bounce -((b)) black, after which we got 5 waves down in ((c)). As the main trend is bullish we favor the long side from the blue box. At this moment bounce has already reached 50 Fibs against the ((b)) black high. So any long positions from the blue box should be risk free. As far as the price stays above 15513.8 next leg up should be ideally in progress, however we would like to see break above 3 red peak to confirm.
You can learn more about Elliott Wave ZigZag Patterns at our Free Elliott Wave Educational Web Page.

NIFTY

NIFTY Elliott Wave 1 Hour Chart 8.4.2021​

15513.8 low held nicely and we got further extension when the price broke above previous 3 red peak. Index is now bullish against the 15513.8 low and expected to keep finding buyers in pull backs in 3,7,11 swings. We don't recommend selling it and keep favoring the long side.Keep in mind that market is dynamic and presented view could have changed in the mean time. Not every chart is trading recommendation. You can check most recent charts in the membership area of the site. Best instruments to trade are those having incomplete bullish or bearish swings sequences. We put them in Sequence Report and best among them are shown in the Live Trading Room.

Nifty

Elliott Wave Forecast
Source: https://elliottwave-forecast.com/elliottwave/nifty-buyers-elliott-wave-zigzag/
 

Elliottwave-Forecast

Master Trader
Feb 17, 2017
2,426
9
84
www.elliottwave-forecast.com
In this technical blog, we will look at the past performance of 1 hour Elliott Wave Charts of XLP. We presented to members at the elliottwave-forecast. In which, the rally from 21 June 2021 low unfolded as an impulse structure. And showed a higher high sequence favored more upside extension to take place. Therefore, we advised members not to sell the ETF & buy the dips in 3, 7, or 11 swings at the blue box areas. We will explain the structure & forecast below:

XLP 1 Hour Elliott Wave Chart​

XLP Starting To Bounce Higher From Blue Box Area

Here's 1hr Elliott wave chart from the 8/04/2021 Midday update. In which, the cycle from 6/21/2021 low ended in wave 1 as an impulse structure at $71.98 high. Down from there, the ETF made a pullback in wave 2 to correct that cycle. The internals of that pullback unfolded as Elliott wave double three structure where wave ((w)) at $70.89 low. Wave ((x)) ended at $71.88 high and wave ((y)) managed to reach the blue box area at $70.79- $70.12 area. From there, buyers were expected to appear looking for the next leg higher or for a 3 wave bounce minimum.

XLP Latest 1 Hour Elliott Wave Chart​

XLP Starting To Bounce Higher From Blue Box Area

Here’s the Latest 1hr Elliott wave chart from the Post-Market update. In which the ETF is showing a reaction higher from the blue box area. Allowed members to create a risk-free position shortly after taking the long positions at the blue box area. However, a break above $71.98 high is still needed to confirm the next extension higher & avoid double correction lower. Note: later on with more data, we were able to adjust the structure of the pullback into a flat structure.

Source: https://elliottwave-forecast.com/stock-market/xlp-starting-bounce-higher-blue-box-area/
Post automatically merged:

Gold ETF $GLD Elliott Wave Analysis and Long Term Cycles

Firstly the GLD ETF fund is one of the largest as well as one of the oldest Gold tracking funds out there since it’s inception date of November 18, 2004. From there on up into the September 2011 highs it ended a larger bullish cycle as did the Gold commodity in terms of US dollars. From the September 2011 highs the price decline was pretty steep however does appear corrective as a double three (a)-(b)-(c) (in blue color) into the December 2015 lows.

Secondly I would like to mention that the bounce from the December 2015 lows at 100.23 into the July 2016 wave I highs is clearly an Elliott Wave impulse. The bounce was strong enough to suggest it ended the cycle lower from the September 2011 highs as well thus at this point it is very much suspected to be resuming a long term bullish trend from the December 2015 lows. As shown above from there the metal made a wave (I) high in August 2020. From there it appears to be in a double three correction of the cycle up from the 2020 lows.

The analysis continues below the monthly chart.


Thirdly in conclusion: The market moves in sequences of 5-9-13 swings in an impulse. It also moves in 3-7-11 swings when it corrects the prevailing trend. The bounce higher from the December 2015 lows appears to have a complete bullish sequence of five waves up. This is within an Elliott Wave impulse. This bounce continued into the August 2020 highs. Currently the metal instrument appears that while below 178.85 it can see weakness continue toward the 118.47 area before a turn back higher.

Source: https://elliottwave-forecast.com/st...d-elliott-wave-analysis-and-long-term-cycles/
Post automatically merged:

Silver ETF $SLV Larger Cycles and Elliott Wave

Firstly there is data back to when the ETF fund began in 2006 as seen on the weekly chart shown below. The fund made a low in 2008 at 8.45 that has not since been taken out in price. It could have been up until The point of the spike higher in July 2020. You should be able to assume from the October 2008 lows to the April 2011 highs was a larger degree impulse ending from all time Silver lows either way.

Secondly, the decline from the April 2011 highs down to the May 2011 lows was five waves. Price held below the April 2011 highs during the bounce from the May 2011 lows to the August 2011 high.

The analysis continues below the weekly chart.


Thirdly, the cycle from the August 2011 high now appears complete. The red I , II & III decline to the December 2015 lows best looks as two Elliott Wave impulses. The bounce to the August 2016 high was strong enough to suggest it had corrected the cycle from the red wave II highs in February 2012. From the August 2016 high the decline appears to be an Elliott Wave triangle structure that ended the wave “E” at the February 2020 highs. From this point in time the instrument printed a clean Elliott wave impulse lower into the March 2020 lows at 10.87.

In conclusion. Down from the April 2011 highs SLV exhibits all qualities of an Elliott Wave zig zag structure that now appears complete at this point. This is partially due to the bounce from the March 2020 lows. It was strong enough and apparently in five waves. This suggests the correction of the cycle up from the all time lows has completed. Near term while below 26.00 more weakness can be seen before a turn higher again.

Source: https://elliottwave-forecast.com/stock-market/silver-etf-slv-larger-cycles-and-elliott-wave/