The last time I looked at this name was in June 2021. You can view this article here. At the time, I was expecting another swing down to take place in a larger wave II correction. Lets take a look at the chart from June.
Zoom Elliottwave June 2021 View:
At the time, the structure was supporting further upside within ((X)) before another swing down was to take place. Fast forward today, and lets see how the forecast turned out.
Zoom Elliottwave View Dec 2021:
Medium term view from the ((X)) peak set in July 2021 @ 406.48. The stock didn't bounce as high as I was expecting before again turning back down. The ((X)) wave turned out to be a sharp reaction and has already confirmed the next leg lower after taking out the ((W)) low. Zoom has already favoured to have set the (W) (X) connector in blue, and now declining in the final swing before Red II can be set.
The area to watch for buyers to enter is the 90.10 100% area. This is a very deep correction. Any violation of the all time lows and this stock is able to sink further down in extension. At this time, I do not favour that to happen. The 90.10 area should give a bounce in 3 waves at least.
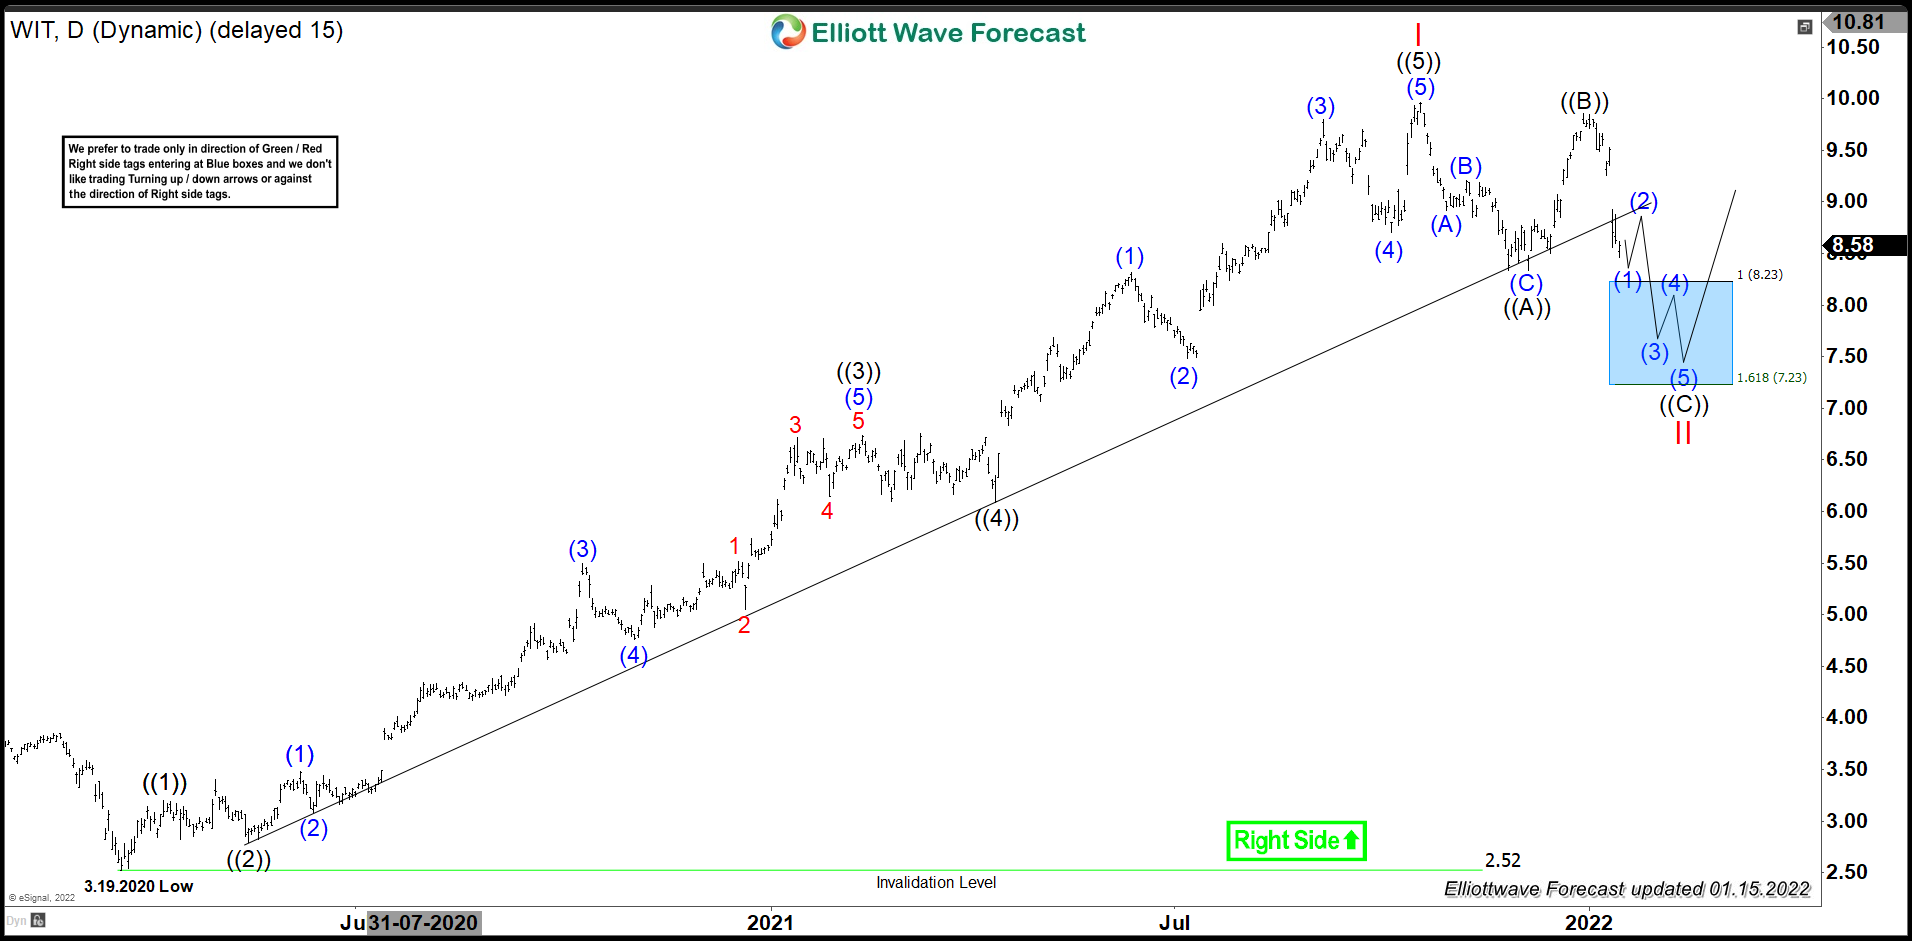
Wipro Limited (WIT) operates as Information technology, Consulting & Business process services company globally. It operates through three main segments, IT Services, IT Products & India State Run Enterprise Services. The company is based in Bengaluru, India (ADR stock) & trades under $WIT ticker at NYSE. It comes under Technology sector as Information Technology services Industry.
WIT - Elliott Wave Daily View:
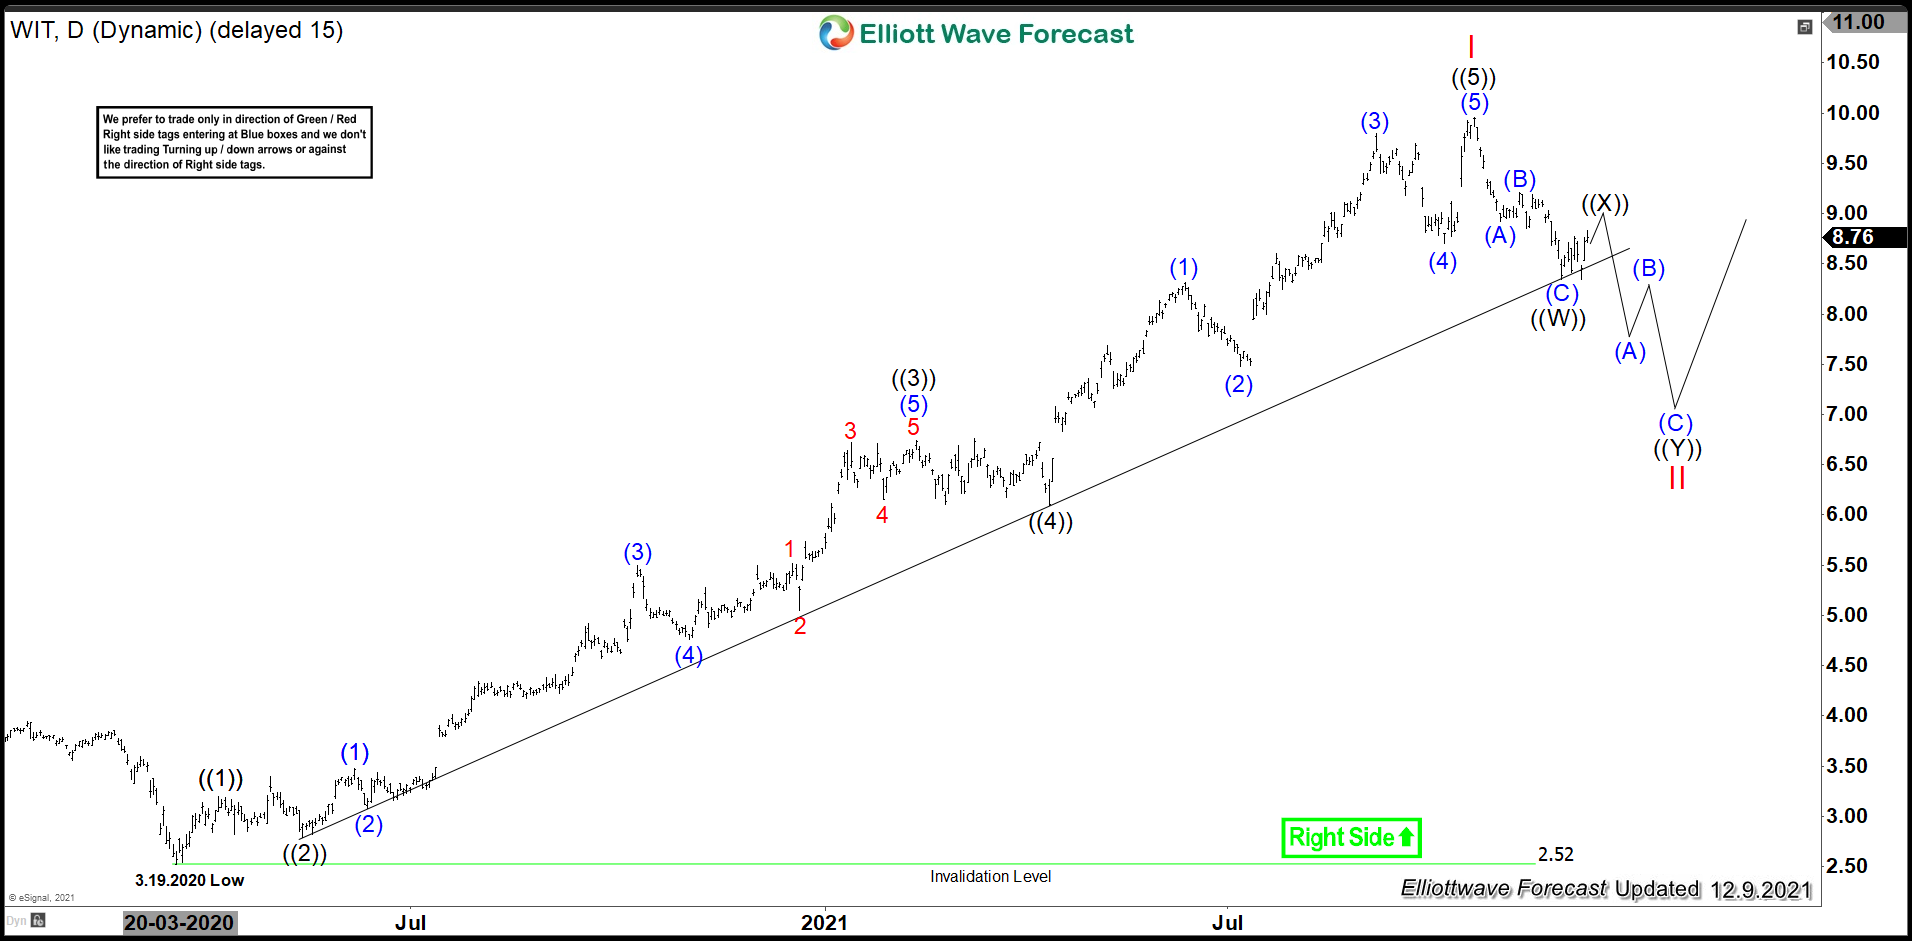
WIT consolidates since October-2010 high to March-2020 low between $5.69 - $2.52 range. But after global sell off ends in early last year during Covid Pandemic, it started the impulse sequence higher & rise almost 4X from the bottom. It appears like ended the sequence at $9.96 high on 10/19/2021 & starts correcting lower against the cycle from March-2020 low.
It made a low at $2.52 on 3/19/2020 after long consolidation from October-2010 high & started new cycle higher. It favored ended ((1)) at $3.20 high on 4/07/2020. It placed ((2)) at $2.79 low on 5/14/2020 as expanded flat retraced 0.618 of previous cycle. The wave ((3)) favored ended at $6.74 high on 2/12/2021 as third wave extension. Wave ((4)) was a shallow correction favored ended at $6.09 low on 4/14/2021. While above there, it placed ((5)) at $ 9.96 high on 10/19/2021 to end the cycle as I red started from March-2020 low.
In short term cycle, it favored ended ((W)) at $8.34 low, while above there it correcting higher in ((X)). It expect to end ((X)) soon between $8.77 - $9.04 area & turn lower again in ((Y)) within the double correction lower as II. We don't like selling it & would like to buy the equal leg area lower for next cycle up or at least 3 swing upside.
USDSGD is another instrument that has given us trading opportunity lately . Break of 07/20 peak, has made incomplete bullish sequences in the cycle from the January low. The price structure is suggesting further rally within that cycle. We recommended members to avoid selling the pair and favoring the long side. Recently the pair made clear 3 waves pull back and found buyers at the blue box as we expected. In this technical blog we’re going to take a quick look at the charts of USDSGD published in members area of the website and explain the Elliott Wave structure and trading strategy.
USDSGD Elliott Wave 1 Hour Chart 10.24.2021
Current view suggests USDSGD is doing (X) blue connector. Pull back is reaching equal legs 1.3614-1.3544. The price structure already has enough number of swings, and we can see turn higher any moment. As the main trend is bullish we expect buyers to appear at the blue box for 3 waves bounce at least. Once bounce reaches 50 Fibs against the B red high, we will make long position risk free ( put SL at BE). Invalidation for the trade would be break below 1.618 fibs extension: 1.3544.
As our members know, Blue Boxes are no enemy areas , giving us 85% chance to get a bounce.
You can learn more about Elliott Wave Double Patterns at our Free Elliott Wave Educational Web Page.
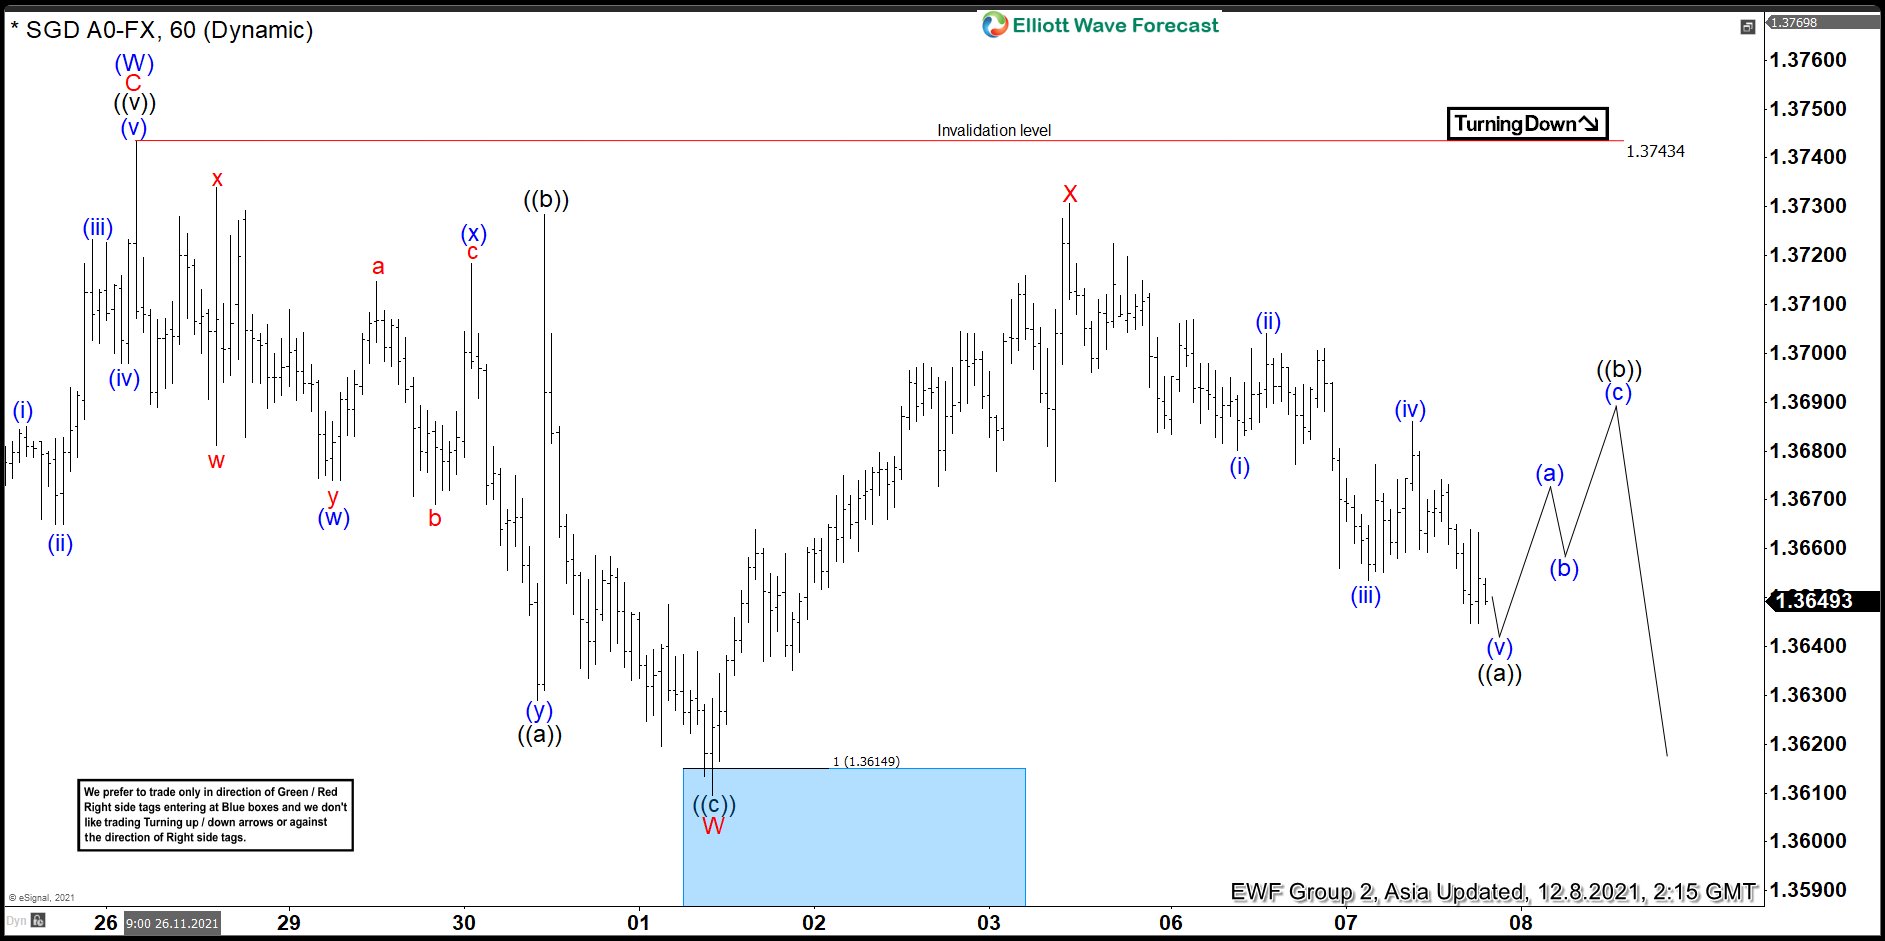
USDSGD Elliott Wave 1 Hour Chart 12.8.2021
The pair has found buyers at the blue box as expected. We got nice rally from the buying zone. The rally from the blue box reached and exceeded 50 fibs against the ((b)) black connector. As a result members who took long positions should make them risk free ( move stop loss at the entry point) and also took partial profits. In the mean time pivot at W red low has given up. We are calling for a potential double in (X) blue connector. Current view suggests another leg down ideally toward 1.3596-1.3512 which will be next good area for buyers to appear.
Keep in mind that market is dynamic and presented view could have changed in the mean time. You can check most recent charts in the membership area of the site. Best instruments to trade are those having incomplete bullish or bearish swings sequences. We put them in Sequence Report and best among them are shown in the Live Trading Room.
Did $UUP Begin A Bearish Sequence In The Longer Term Cycles
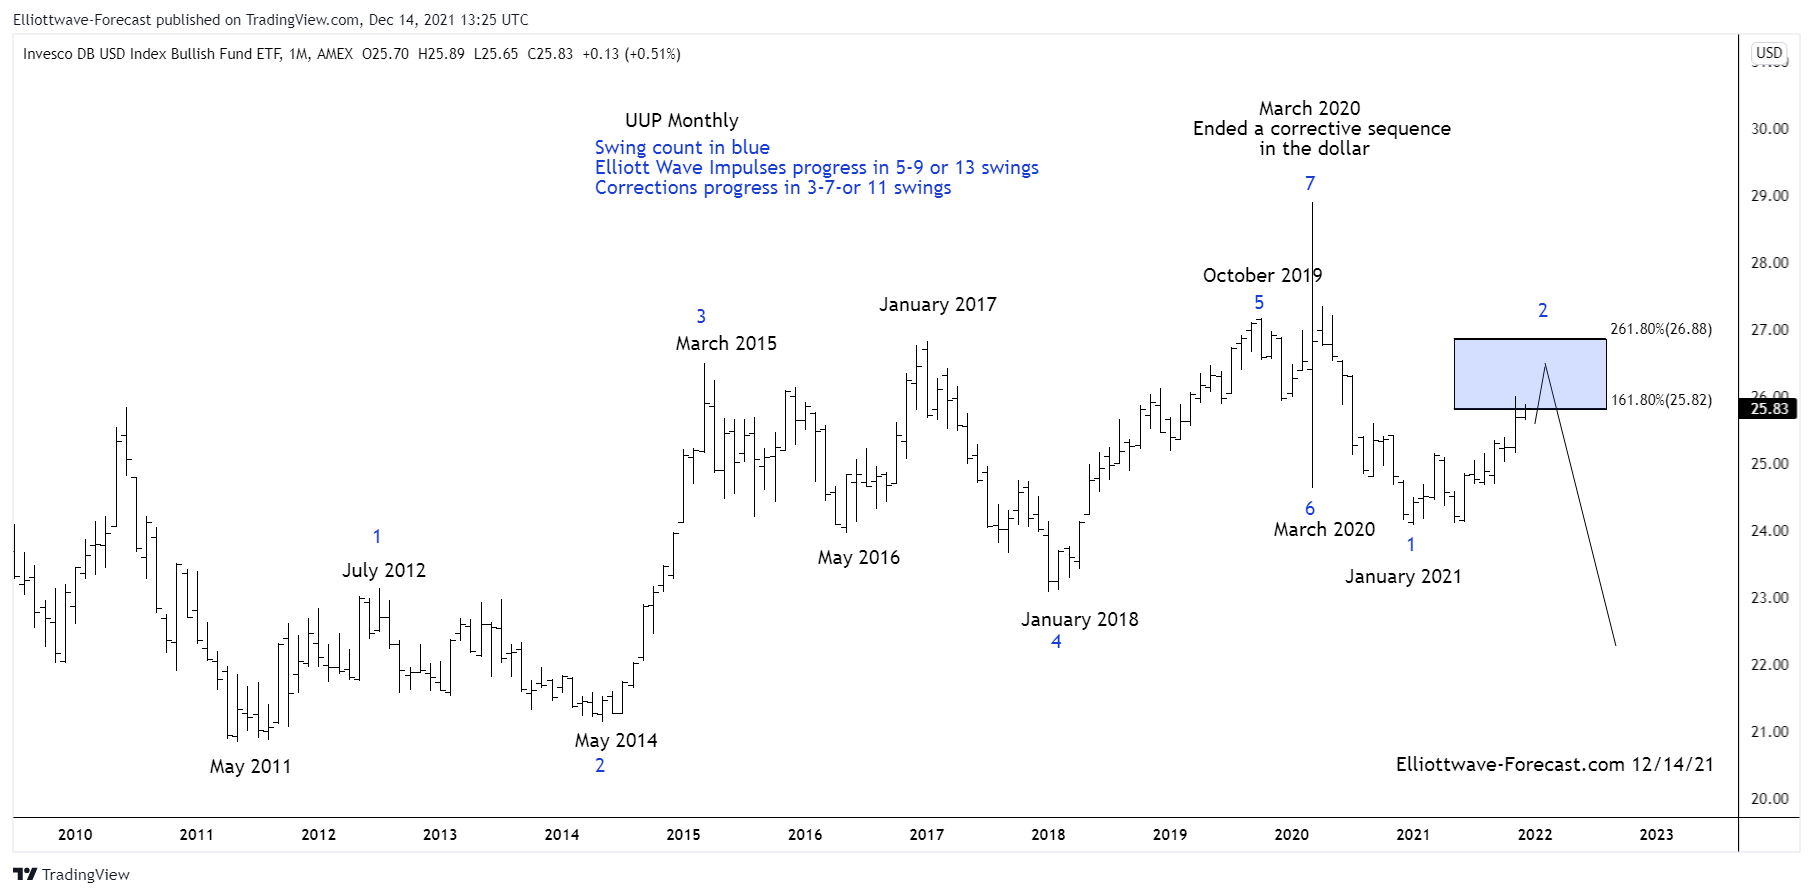
Firstly the dollar tracking ETF fund UUP inception date was 2/20/2007. Interestingly the dollar index has a low in March 2008. The UUP ETF fund shows a low in May 2011. The dollar index did make a pullback cycle low in May 2011 however it was well above the March 2008 lows. The cycle up from the May 2011 lows in UUP is the focus of this analysis where it begins on the monthly chart. It should see some further downside relatively soon before any more larger bounces higher in the longer term cycles.
The analysis continues below the $UUP monthly chart.
Secondly the cycle up from the May 2011 lows in UUP appears to have advanced higher with some overlap in the cycles. From the May 2011 lows the dollar instrument appears to have 7 swings in place to the March 2020 highs. This cycle from the May 2011 lows to the March 2020 highs is a corrective sequence.
Thirdly and in conclusion. The bearish corrective sequence plus the decline from the March 2020 highs suggests further downside in the dollar for some time to come. March 2020 saw some fast 6th & 7th swings. The best reading of the cycles suggest the decline from there in to the January 2021 lows was an impulsive five waves of larger degree. The price decline to the January 2021 lows also caused our trend system pivot to give up. This suggests the cycle from May 2011 was over. In this case that would be the fourth swing low from January 2018. The cycle from the January 2021 lows is mature however the dollar can see another high in the blue box extension area before resuming a larger downtrend.
The last time I analyzed this company was September 2021 (article can be found here), it was close to completing the cycle from the 2020 low, and then pulling back in a larger degree correction. Before I get into the charts, lets check out the company profile again:
“Matador Resources Company is an independent energy company engaged in the exploration, development, production and acquisition of oil and natural gas resources in the United States, with an emphasis on oil and natural gas shale and other unconventional plays. Our current operations are focused primarily on the oil and liquids-rich portion of the Wolfcamp and Bone Spring plays in the Delaware Basin in Southeast New Mexico and West Texas. We also operate in the Eagle Ford shale play in South Texas and the Haynesville shale and Cotton Valley plays in Northwest Louisiana.”
This stock has been acting very technical, and has been counting Elliott Waves very clean. Lets take a look at the previous Elliottwave September 2021:
Matador Resources Elliottwave View September 2021:
I had noted in the previous article, that the stock was in the final swings before possible pulling back in a larger cycle from 2020 low. The 41.31 to 46.39 was the area I was noting, that can possible produce a peak before a larger pullback. Lets take a look at the current Data:
Matador Resources Elliottwave View December 2021:
Prices acted as anticpated. They rallied into the 1.236 to 1.618 fib area where a peak could happen. In the end, the stock peaked a little above the 1.618 at a high of 47.23. From there, the stock has been fairly choppy, and it is favoured to have already set a 3 waves lower. ((W)) is favoured set, with a bounce into the connector ((X)) already in place. Right now prices are in the middle area, an area that we consider a no trade zone. We only like trading the extreme (blue box) areas where proper risk mangement is clear and defined. A violation of 33.82 ((W)) low will confirm the next leg lower is underway. Until then, it can't be ruled out that another rally higher into ((X)) is possible before again turning lower.
In conclusion, there is a blue box at 28.28 to 19.96 where buyers may enter for a bounce in 3 waves at least. We don't prefer selling short this stock, but the blue box can provide a hedge trade opportunity where a bounce can happen.
MTU Aero Engines AG is a German aircraft engine manufacturer. It develops, manufactures and provides service support for civil and military aircraft engines. Founded in 1934 and headquartered in Munich, Germany, it can be traded under the ticker $MTX at XETRA in Frankfurt. MTU is a part of DAX40 index. In the initial article back in April 2021, we have forecasted a new cycle higher. Now, the nest might be in place and acceleration higher should take place. Here, we provide an update.
MTU Monthly Elliott Wave Analysis 12.13.2021
The monthly chart below shows the MTU stock $MTX traded at XETRA in Frankfurt. From the all-time lows, the stock price has developed a cycle higher in blue wave (I) of a super cycle degree. MTU has printed the all-time highs in January 2020 at 289.30. Without any doubt, the advance is a textbook quality impulsive move up in 5 waves. From January 2020 highs, a sharp straightdown correction in the blue wave (II) has retraced 2/3 of the price. An important bottom has been printed in March 2020 at 97.76 low. From there, a new cycle in wave (III) might have started. Investors can be expecting MTU stock to reach into the new all-time highs. The target will be 388-568 area.
MTU Daily Elliott Wave Analysis 12.13.2021
The daily chart below shows in more detail the nest in red waves I-II of blue wave (III) from the March 2020 lows at 97.76. First, wave I has developed clearly 5 waves. Then, a pullback in wave II is demonstrating a double three structure. Based on black waves (W) and (X), black wave (Y) of red II is expected to end within 166.25-140.96 area. As a matter of fact, wave II might be already in place. Soon, an acceleration higher within wave III or a bounce in 3 waves as minimum should take place.
Cocoa (or cocoa bean) is one of soft commodities, along with sugar, coffee, orange juice and cotton. The bean is the fully dried and fermented seed, wherefrom cocoa solids and cocoa butter can be extracted. Cocoa beans are the basis of the chocolate. One can trade Cocoa futures at ICE owned New York Board of Trade in contracts of 10 metric tons each under the ticker CC #F. Also, there are similar contracts at CME owned NYMEX under the ticker CJ #F.
Currently, we see other soft commodities like coffee and sugar extending strongly higher after a long period of depressed prices. Based on the correlation within group of softs, the cocoa seed is expected to accelerate higher as well. However, the prices are still lagging those of coffee. In the initial article on CC #F from March 2021 we have provided the main idea. Now, we see 2 new nests in place. As a consequence, an acceleration higher should take place. Here, we present the updated view.
Cocoa Monthly Elliott Wave Analysis 12.13.2021
The monthly chart below shows the cocoa seed front contract CC #F at NYBOT. From the important low in November 2000, the prices have developed a cycle higher in blue wave (I) of a super cycle degree. Hereby, wave (I) has demonstrated a leading diagonal pattern and has ended in March 2011 at 3775. From the all-time highs, a correction lower in wave (II) has unfolded as an Elliott Wave zigzag pattern. In 6 years, CC #F has become cheaper by more than 50% reaching 1756 level. It is the preferred view that an important bottom on April 2017 has been set and the correction has ended. From the lows, a new rally in prices within blue wave (III) may have started.
For 2022-2030, the expectations are to break to the new all-time highs. The target for wave (III) will be 4842-6753 area. From current levels, the cocoa seed can, therefore, double in price.
From the April 2017 lows, the advance higher is showing red waves I and II. Then, a higher high within a new cycle in red wave III, so far in black wave ((3)), has not reached yet the equal legs extension area towards 3165-3898. Therefore, while the price remains above 1982, the bullish sequence will push the price higher.
In shorter cycles, waves ((1)) and ((2)) have ended. Currently, wave ((3)) of III may be already in progress.
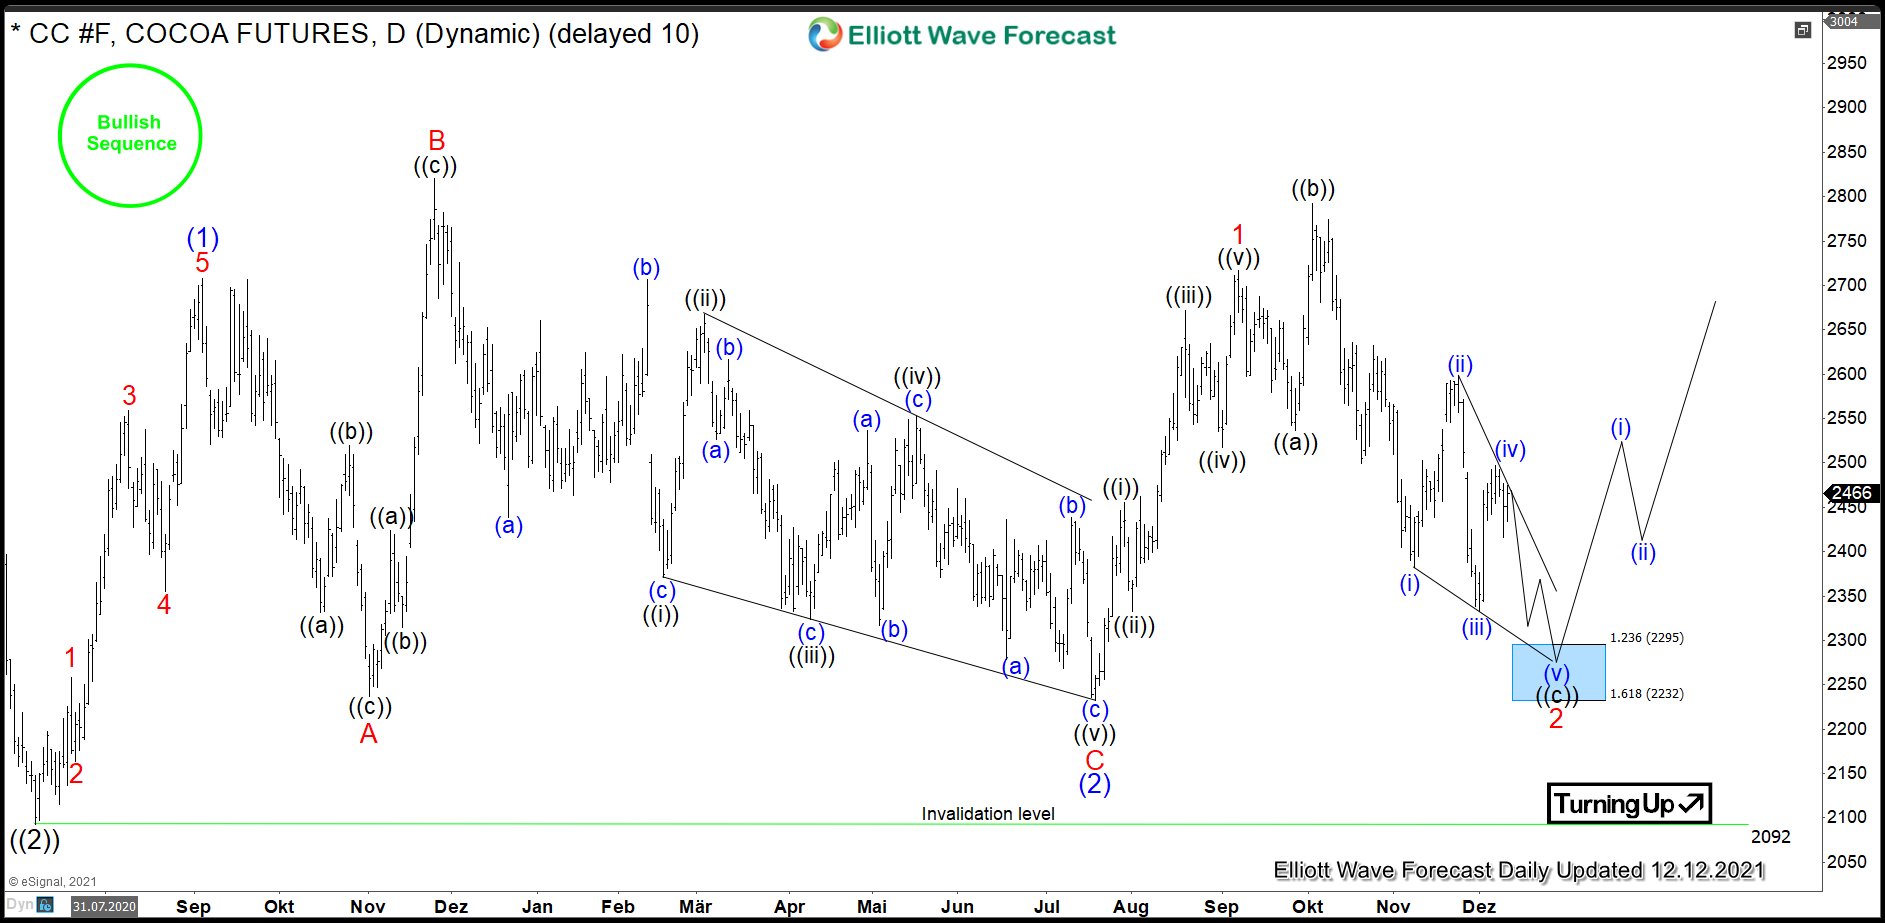
Cocoa Daily Elliott Wave Analysis 12.13.2021
The daily chart below shows in more detail the advance from the July 2020 lows where wave ((2)) has ended. From the bottom at 2092, one can obeserve two nests higher. First, waves (1)-(2) have ended in July 2021. From 2232 lows, another nest in waves 1-2 of (3) should end soon. Then acceleration higher in wave 3 of (3) should bring prices considerably higher.
Investors and traders can be, therefore, looking to buy pullbacks in 3, 7 or 11 swings from the extremes. The targets are 2848-3229 in short term, 3165-3898 in medium term and 4842-6753 in a long run.
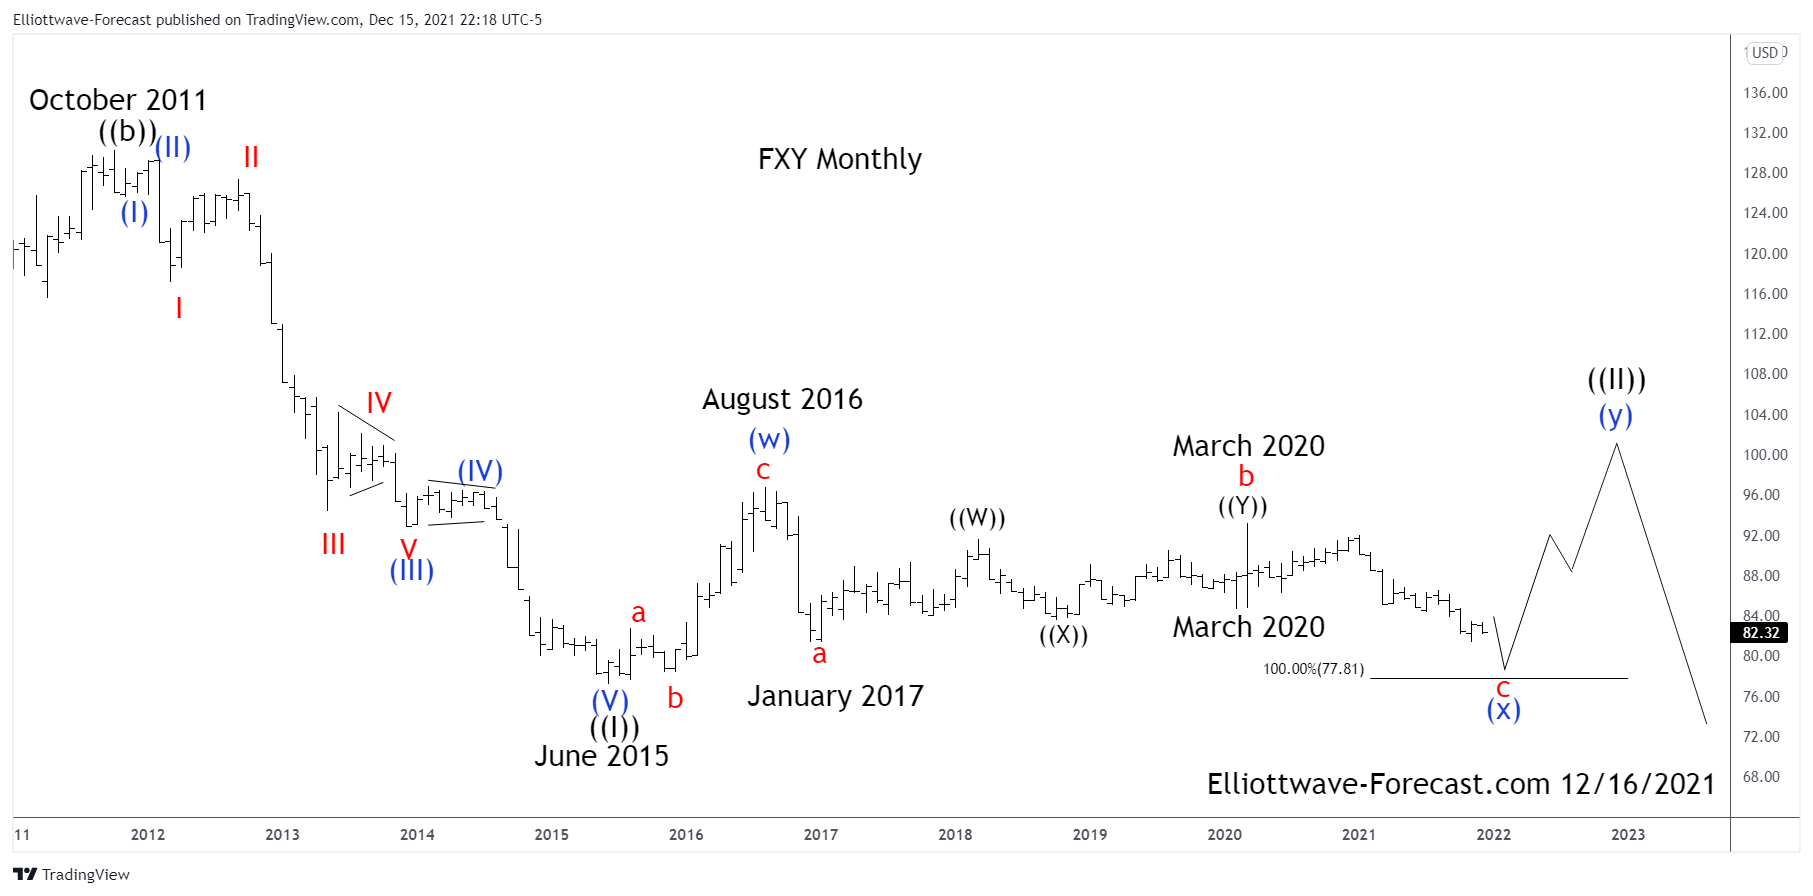
Firstly the $FXY instrument inception date was 2/12/2007. The instrument tracks changes of the value of the Japanese Yen versus the US Dollar. There is plenty of data going back into the longer term 1970’s time frame available for the currency cross rate in the USDJPY. The foreign exchange pair shows a larger degree time frame low is in place October 2011 at 75.57. Comparatively, the FXY instrument reflects a price high at 130.22 in October 2011.
The analysis continues below the FXY Monthly chart.
Secondly the FXY instrument mirrors USDJPY price highs and lows inversely as the initial above paragraph suggests. In the FXY instrument the decline from the October 2011 high into the June 2015 lows is an Elliott wave impulse. Internally there are a couple of degrees shown there in the red & blue colors that finished the black wave ((I)). From the June 2015 lows the bounce higher in both price and momentum indicators suggested the cycle lower had ended there.
In conclusion: As the FXY weekly chart suggests the instrument ended a larger degree cycle in an Elliott wave impulse of five waves lower in June 2015. The bounce from there appears to be three swings in the wave (w) in blue that ended August 2016. From there a double three wave (x) remains in progress before turning higher again in the blue (y) of ((II)). While this plays out with price remaining above the June 2015 lows the FXY can see a turn higher. This larger degree ((II)) is a typical double three Elliott Wave structure. It can reach the 100 to 109 area before the larger degree time frame bearish cycle takes over again taking prices substantially lower.
In this technical blog we’re going to take a look at the Elliott Wave charts charts of NIFTY index published in members area of the website. Recently the Index corrected the cycle from the 18600 ( October ) peak. Recovery unfolded as Elliott Wave Flat structure. Once target area was reached, the index found sellers as expected and we got turn lower. In further text we’re going to explain the forecast and Elliott Wave Pattern.
Before we take a look at the real market example of Expanded Flat, let’s explain the pattern in a few words.
Elliott Wave Expanded Flat Theory
Elliott Wave Flat is a 3 wave corrective pattern which could often be seen in the market nowadays. Inner subdivision is labeled as A,B,C , with inner 3,3,5 structure. Waves A and B have forms of corrective structures like zigzag, flat, double three or triple three. Third wave C is always 5 waves structure, either motive impulse or ending diagonal pattern. It’s important to notice that in Flat Pattern wave B is very deep, but completes above the start point of wave A. Wave C ends above the ending point of wave A . Wave C of Flat completes usually between 1.00 to 1.236 Fibonacci extension of A related to B, but sometimes it could go up to 1.618 fibs ext.
At the graphic below, we can see what Expanded Flat structure looks like
Now, let’s take a look what Elliott Wave Flat Pattern looks like in the real market
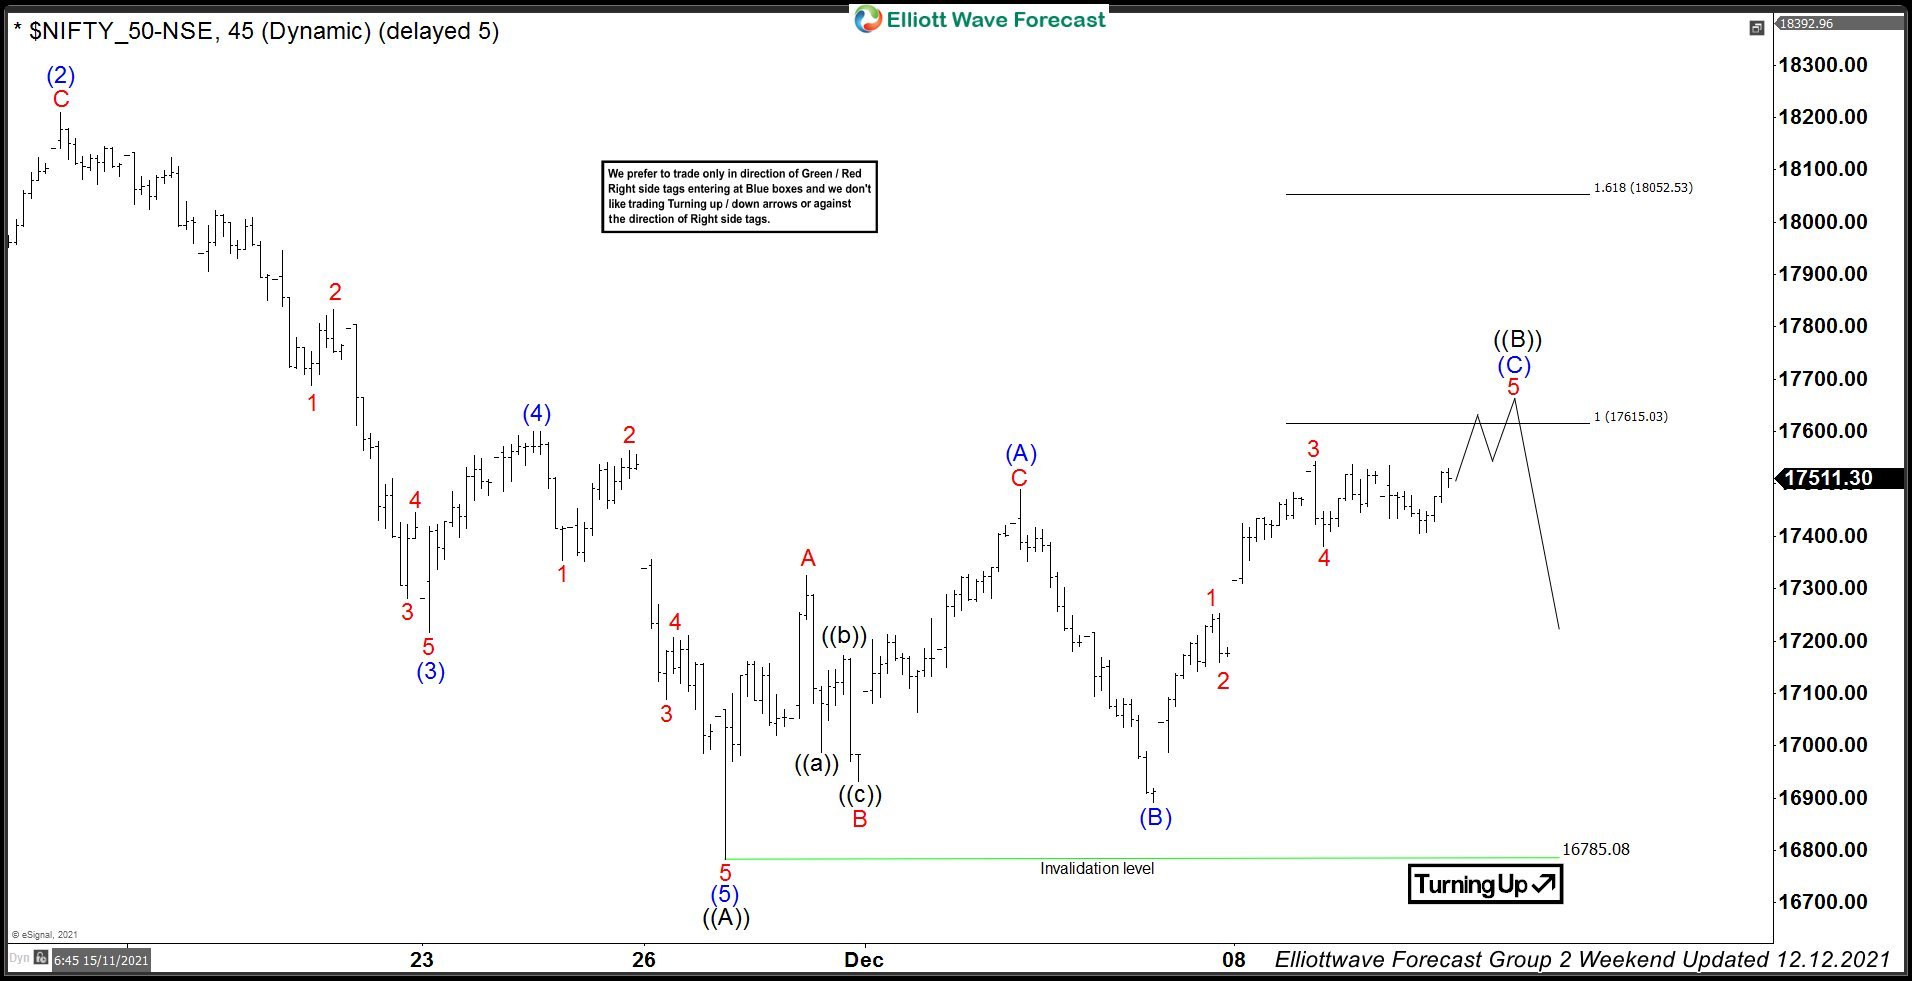
NIFTY 1 Hour Elliott Wave Analysis 12.12.2021.
NIFTY is giving us correction of the cycle from the October peak. Wave ((B)) correction looks to be unfolding as Elliott Wave Flat Pattern and still look incomplete at the moment. Waves (A) and (B) are showing corrective sequences. At this stage we expect to see more short term strength to complete 5 waves up from the recent low which would be (C) leg of ((B)) black Flat recovery. Another leg up should ideally see 17615.03-18052.5 area before sellers appear again for proposed decline toward new lows ideally.
You can learn more about Elliott Wave FLAT Patterns at our Free Elliott Wave Educational Web Page
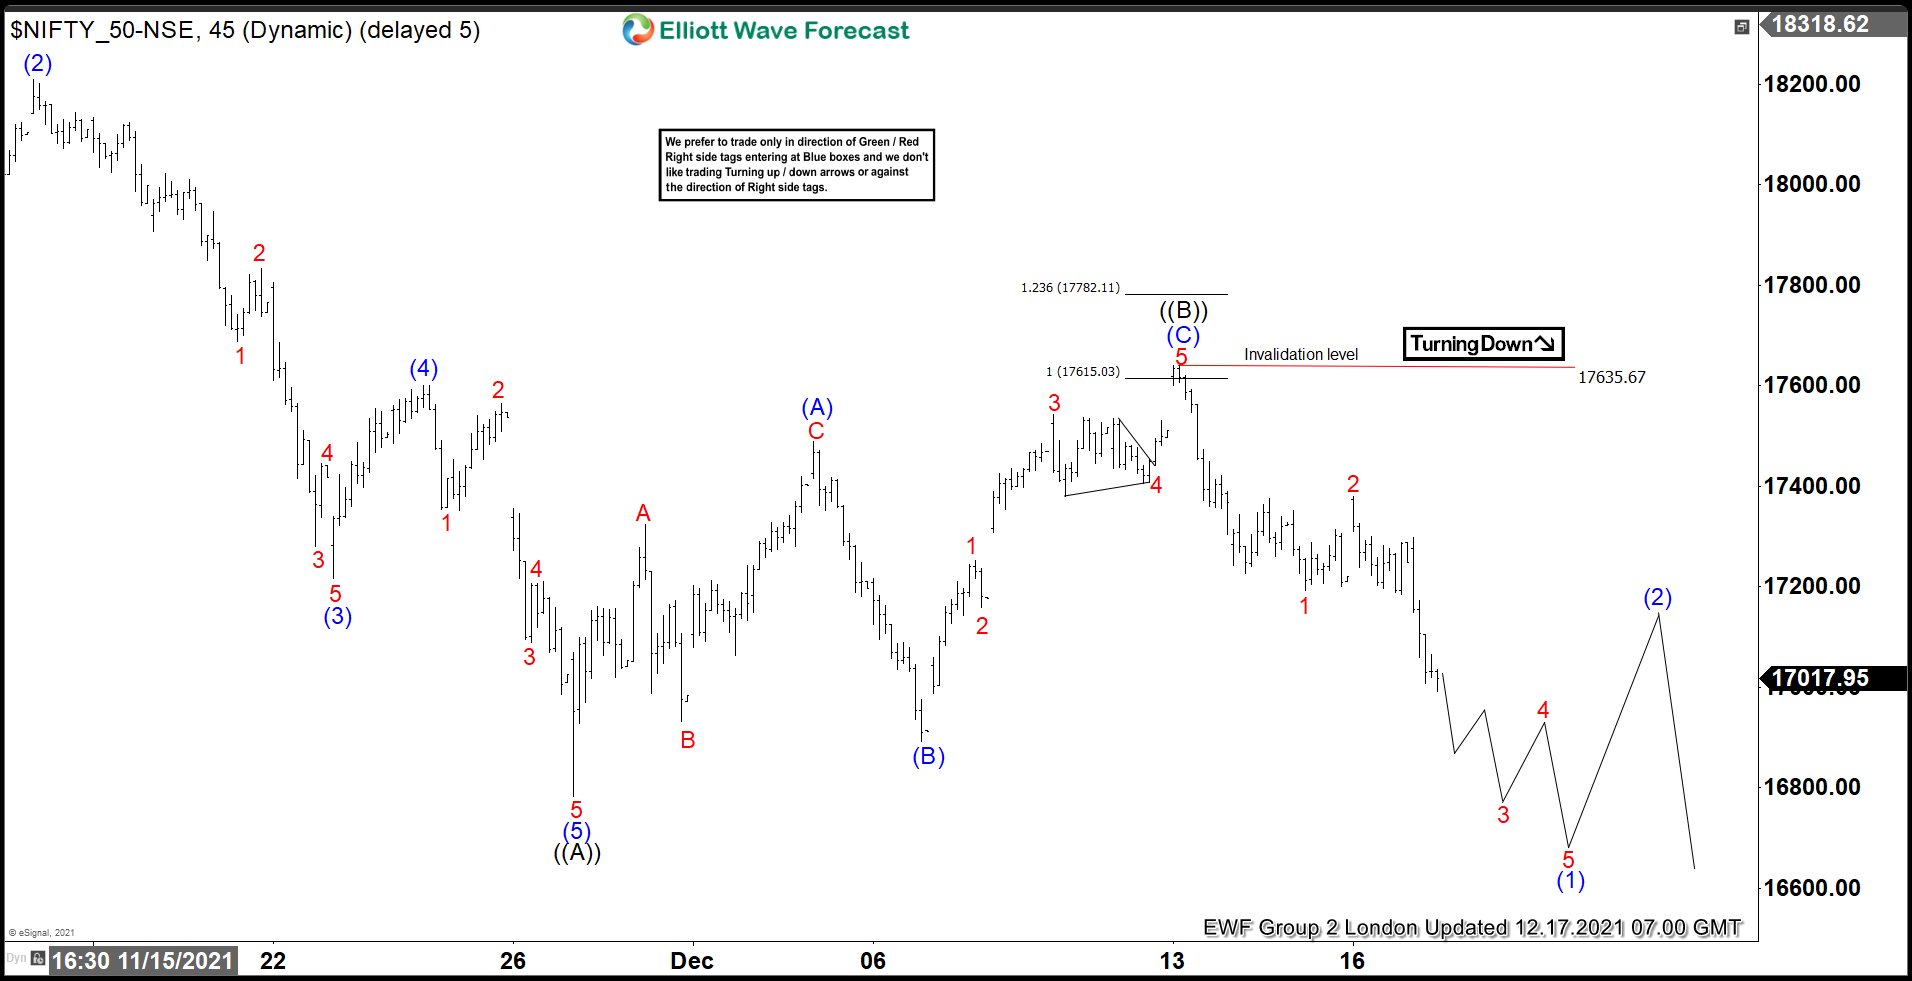
NIFTY 1 Hour Elliott Wave Analysis 12.17.2021.
Recovery made another leg up toward 17615 area and completed 5 waves in (C) leg as we expected. NIFTY completed Elliott Wave Flat Structure at 17635.6 high. As far as the price stays below that high, NIFTY can be giving us next leg down. We would like to see break of 11/29 low which will confirm next leg down is in progress.
Keep in mind that market is dynamic and presented view could have changed in the mean time. You can check most recent charts in the membership area of the site. Best instruments to trade are those having incomplete bullish or bearish swings sequences. We put them in Sequence Report and best among them are shown in the Live Trading Room.
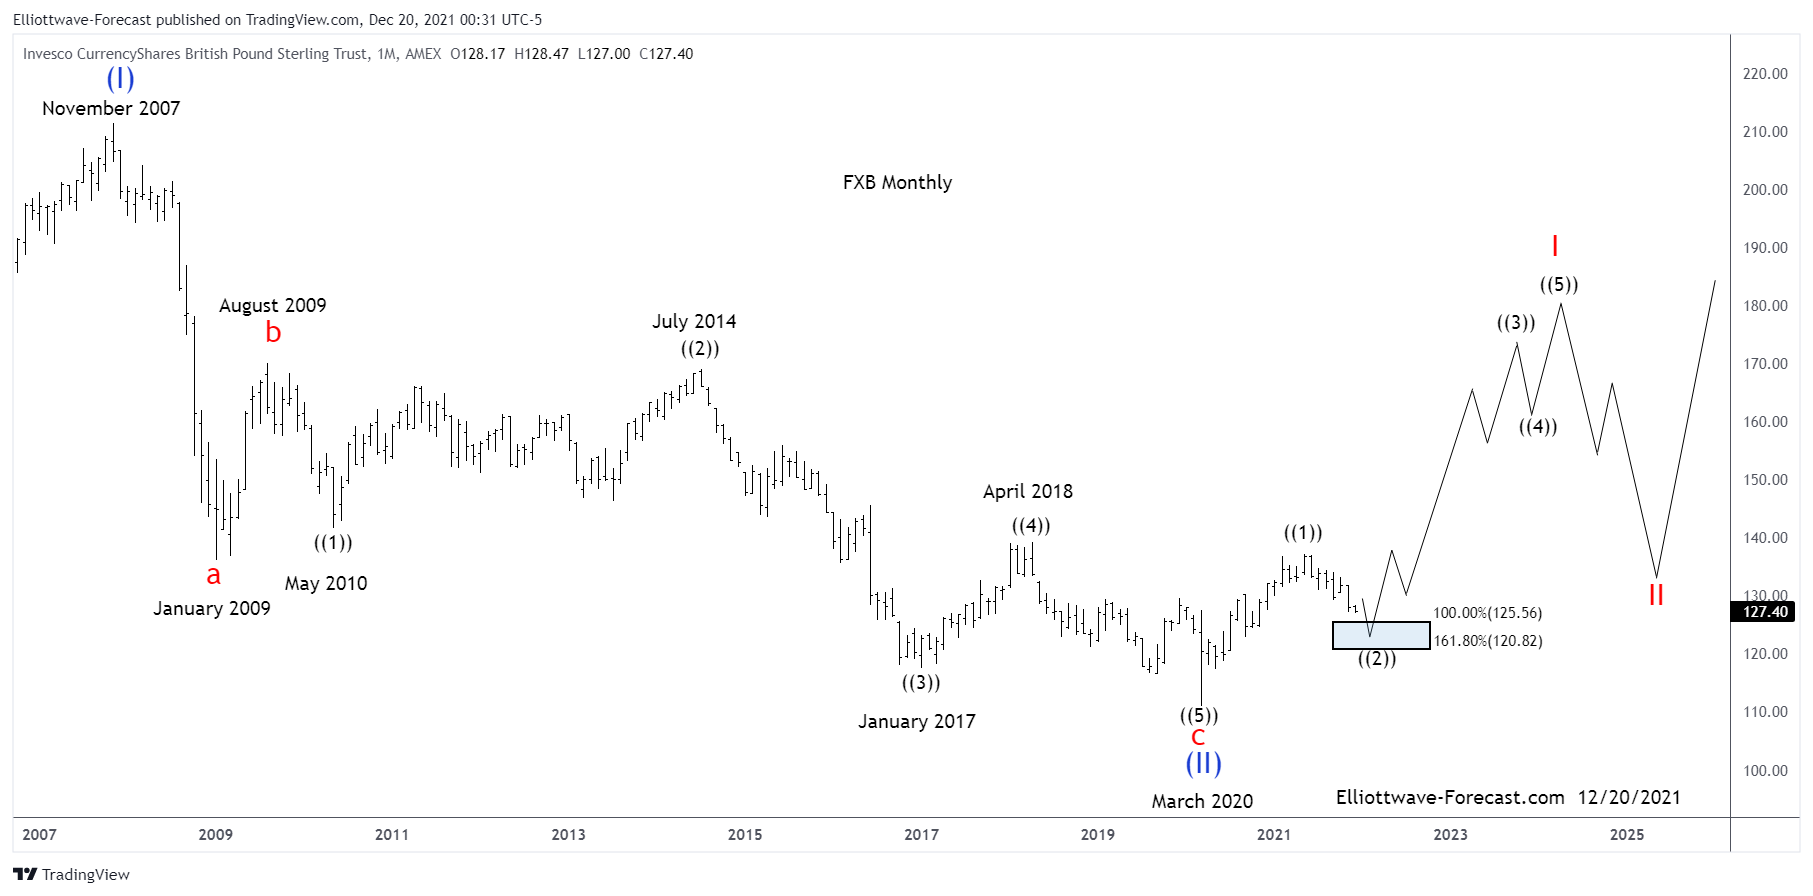
Firstly the British Pound Sterling tracking ETF fund FXB inception date was 6/21/2006. The bearish cycle lower from the November 2007 highs in FXB is favored ended in this analysis. The British Pound Sterling has been the currency of the Bank of England since 1694. Considering that date was back before there was a US Dollar to compare with and data readily available suggests price was at 2.6440 in 1972. Spot price in the GBPUSD foreign exchange was 1.0520 in 1995. Price was at 2.1161 in 2007 where it peaked and turned lower. This is where we will shift the focus to the FXB highs at 211.44 in November 2007.
Secondly the bearish cycle from the November 2007 into the January 2009 lows was clearly an Elliott Wave impulse in 5 waves. From there into the August 2009 highs appeared to be three waves. There into the May 2010 lows appeared best as an impulse wave. From there into the July 2014 highs appeared to be an Elliott Wave flat correction. The analysis continues below the monthly chart.
Thirdly the turn lower from the July 2014 highs appears to be an impulse lower into the January 2017 lows. Price appeared to print a double three into the April 2018 highs. From there it appears another impulse completed in March 2020.
In conclusion : As it appears right now the instrument completed a five wave cycle up from the March 2020 lows in May of 2021. Ideally while below the October 2021 highs the instrument can see the blue box area highlighted while correcting the cycle up from the March 2020 lows. While above there the currency instrument can continue a longer term trend higher against the dollar.
Since the crash of March 2020, all stocks have tried to recover what they lost, and Disney was no exception. Disney did not only recover the lost, but It also reached historic highs. Now, we are going to try to build an impulse from the March 2020 lows with a target around $230. Target measured from 0 to 2019’s high projected from March’s low, equal legs. Since we begin with this analysis on February 13th, we bought the share in 160.97 then the market broke to a new historical high and reached the first target at 190.88 after hours. The target gave us a return of +18.58% in 12 days.
Disney October Daily Chart
We relabeled Disney impulse building a leading diagonal from March 2020 low ending at 137.34 as wave ((1)). Then a zig zag correction as wave ((2)) finishing at 117.19. Wave ((3)) is a clearly impulse ended at 183.54 and wave ((4)) pullback ended at 160.57. The last push to the upside to complete wave ((5)) and Wave I topped at 203.01. From there, the stock did 3 swings down gave us the idea that we need one more rally to complete the impulse to $230.00 target, but the lagging in time from last months were too long to think about that rally and it was better to think that we were already in wave II correction.
Disney November Daily Chart
Therefore, Disney stock began to build a double correction. Down from the peak 3 swings completed wave (W) at 167.10. Then, we had 7 swings higher to complete wave (X) at 187.58 and we were looking 3 swings more to complete wave (Y) and the first leg of ((W)) in 156.50 - 149.34 area. (If you want to learn more about Elliott Wave Theory, please follow these links: Elliott Wave Education and Elliott Wave Theory).
Disney December Daily Chart
Market continued dropping and Disney found support at 142.04 where we believe wave (Y) and wave ((W)) finished. Then we should bounce in 3 swings that should fail to complete the connector ((X)) and further downside should take place. Wave (A) of ((X)) ended at 154.66 and we are looking a correction as wave (B) to end in 142.82 – 144.63 and see a last rally to complete (C) of ((X)).
The last phase should have the same structure of the first one, that is a double correction (W), (X), (Y) to complete wave ((Y)) and also wave II. We will look to buy when wave II is done.
All stocks tried to recover what they lost and Berkshire Hathaway was not exception since the crash of March 2020. BRK.B did not only recover the lost, but It also reached historic highs. Now, it is building an impulse from March 2020 lows and we are going to follow to determinate the best area to complete the impulse.
Berkshire Hathaway April Daily Chart
As we see in this daily chart from April, The wave ((1)) ended and the structure could be weird for you because it is not quite common, and it is called an expanding leading diagonal. (If you want to learn more about Elliott Wave Theory, please follow these links: Elliott Wave Education and Elliott Wave Theory). I think it is better to manage the structure of Berkshire Hathaway in that way instead of a nest, and this is because comparing some cycles in the market has more sense with the current structures of the market. Then we have a clear (A), (B), (C) correction as wave ((2)) and we called the continuation of wave ((3)) to the upside.
Berkshire Hathaway September Daily Chart
In this daily chart from beginning of September, we were calling one more high to complete wave ((3)); but after a month, the Berkshire Hathaway’s shares entered in a ranging stage and it has consumed a lot of time to think that the structure from wave (3) in blue peak it is more likely that is the wave ((4)) of the impulse and we changed the labelling of the chart.
Berkshire Hathaway October Daily Chart
Then we restructure the impulse and wave ((3)) ended at 295.08. Wave ((4)) pullback ended at 270.73 and we should continue with the bullish momentum. We began the last impulse to complete wave ((5)). In lesser degree wave (1) ended at 291.82 and wave (2) correction ended at 271.36 and wave (3) was building. We were calling at least 310.00 dollars as minimum target.
Berkshire Hathaway December Daily Chart
The wave (3) of ((5)) ended at 296.65. The pullback as wave (4) was very deep almost invalidated the count ending at 274.79. Now, we have broken the last peak of wave (3) validating an ending diagonal structure to complete wave (5) of ((5)). The last high hit 301.58 and the impulse from March low could be done and a big correction could be started. However, we are proposing a continuation higher to reach target area of 305.00 - 310.00 given some market conditions. A break of 274.79 will confirm the pullback is already here.
I wanted to review DataDog again, and take a look at how the current chart is shaping out. I took a look at this stock about a month ago, you can see the article here. In that blog I was explaining the scenario for a minor pullback, then further upside. Lets take a look at the chart I was presenting.
Datadog Elliottwave November 17/2021 view:
At the time, the evidence supported the idea that this stock was in a wave III advance. I was looking for the 1.618 extension as a possible target area for where Red III could possibly peak. Lets fast forward a month later and see how things turned out.
DataDog Elliotwave December 21/2021 view:
One thing is clear right now, this stock is correcting the cycle from May 2021 low right now. The only question at this time is; Is this a wave IV correction against that low, or a nest?
I would like to suggest that a nest in ((2)) is taking place. This is actually very similar to my original analysis that I blogged about back in July 2021 (you can see the blog here). In July, I was looking for a rally from the May 2021, to create a Nest before advancing higher. With current price action, the wave didn't extend high enough for a Red III, and failed to reach the 1.618 extension where a Red III could peak. The momentum is suggesting that a correction against that May 2021 low is taking place. So instead of a wave III peak, I favour nesting before a wave 3 of 3 advance takes place in the months to come.
Where can DataDog head from here in the shorter cycles? The area for Blue (X) can peak is the 187 area equal leg. Never sell (short) a 3 waves decline down. Right now, DataDog has complete 3 waves back from the ((1)) peak. A double correction is favoured as the Indices and Technology $NQ_F have not reached ideal areas to strike a low, so for now, further downside is favoured.
Once (X) is set, we can get an idea area for where ((2)) can stike a low. Without an equal leg to measure, I can point to the 50% to 61.8% retrace of the Red II to ((1)) leg. This comes at 134.82 to 119.48. This would be the ideal area for ((2)) to bottom.
Hello fellow traders. In this technical blog we’re going to take a quick look at the Elliott Wave charts of Eurostoxx $ SX5E published in members area of the website. As our members know, we were calling the decline after 3 waves recovery against the 4416.08 peak.
In further text we’re going to explain Elliott Wave Forecast.
Eurostoxx 1 Hour Elliott Wave Analysis 12.8.2021
Eurostoxx is giving us recovery ((B)) back 4against the 4416.08 Recovery seems to be unfolding as Elliott Wave Flat pattern. We got 3 waves up in (A) leg and 3 waves down in (B) wave. Currently we are about to complete 5 waves up in (C) blue leg, which is last leg of proposed flat pattern. Recovery can be ending soon at 4221.3-4321.1 area. We expect sellers to appear there for further decline or 3 waves pull back at least. Don't recommend buying the index at this stage.
You can learn more about Elliott Wave FLAT Patterns at our Free Elliott Wave Educational Web Page
The index found sellers right at the proposed area : 4221.3-4321.1. We got nice decline Eurostoxx , calling correction completed at 4288 peak. Break of 30/11 low is needed to confirm next leg down is in progress. Otherwise double in (B) blue cannot be ruled out. We expect to see further decline ideally.
The indexes keep trading sideways to lower and we got further separation against the 4288 peak as expected. However the price hold above previous 11/30 low. Sellers were not strong enough to make break of that low and in the meantime we got strong rally from the 4046.4 low that looks impulsive. Current view suggests (B) blue recovery still can be in progress as Elliott Wave Flat pattern, looking for 4308.5-4370. At that area we can see sellers again for decline toward new lows or for a larger 3 waves pull back.
Keep in mind that market is dynamic and presented view could have changed in the mean time. You can check most recent charts in the membership area of the site. Best instruments to trade are those having incomplete bullish or bearish swings sequences. We put them in Sequence Report and best among them are shown in the Live Trading Room.
Centennial Resource Development, Inc., (CDEV) is an independent Oil & Natural gas company, focuses on the development of unconventional oil & associated liquid rich natural gas reserves in US. It trades as CDEV ticker at Nasdaq under Energy sector.
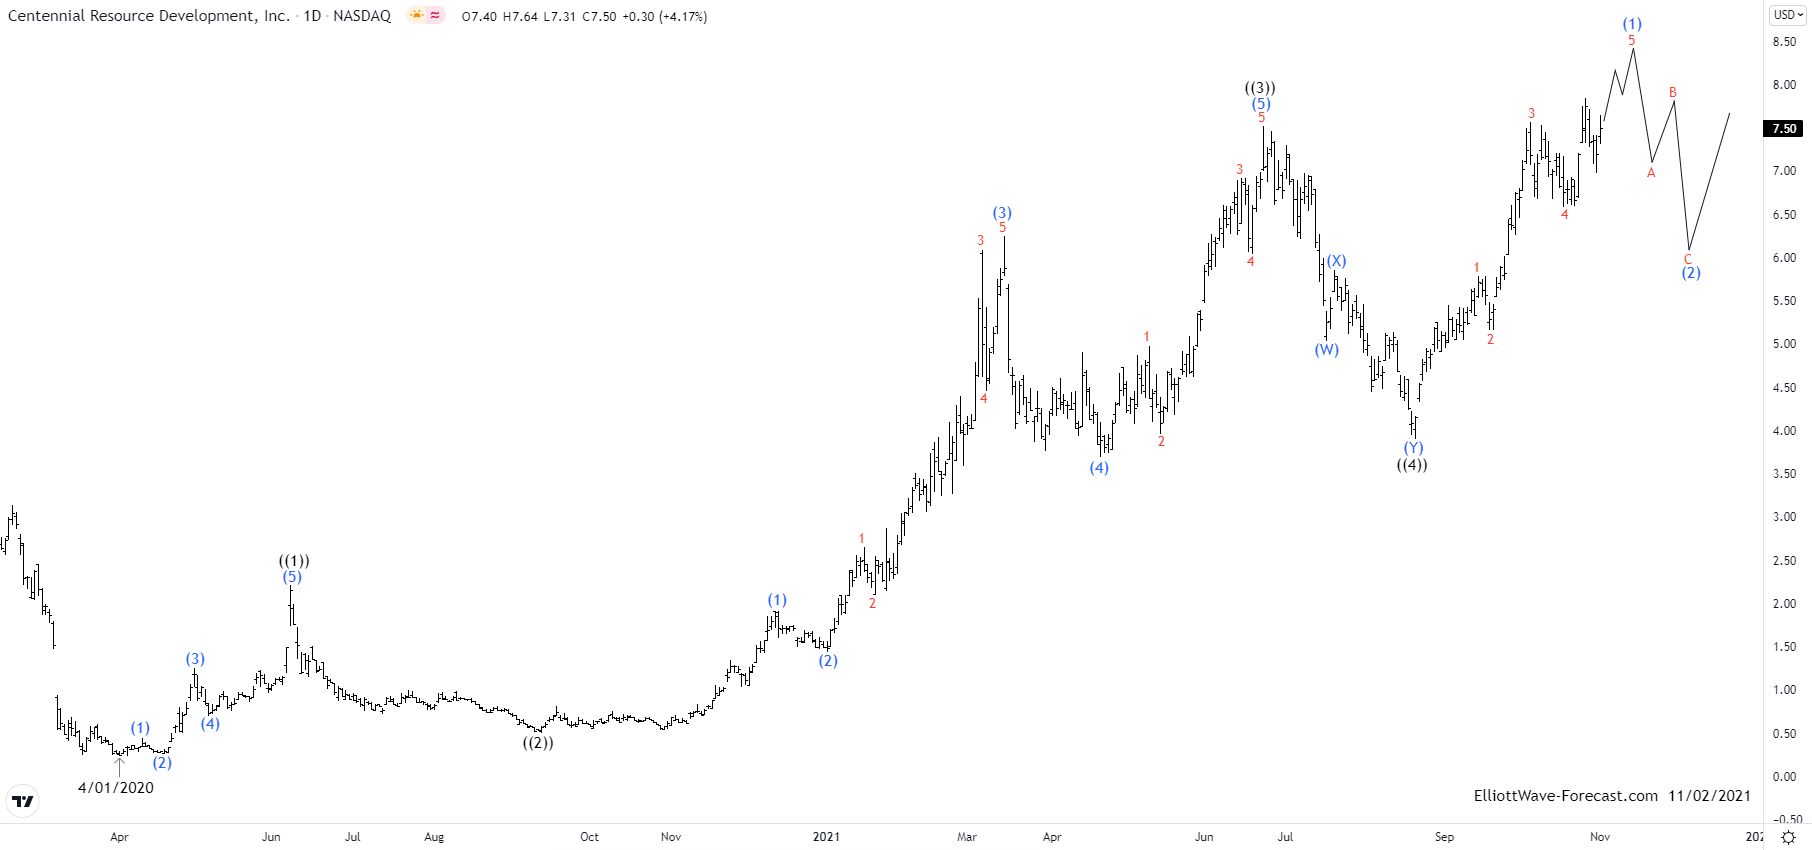
In previous blog of CDEV dated 11/02/2021, it expected to end the impulse cycle within sequence from 8/20/2021 low as (1) of ((5)), which is in fact whole ((5)) wave instead. So below $8.29 high, it expect to correct lower. In daily, it favored ended impulse as I red at $8.29 high on 11/04/2021 in the cycle started from 4/01/2020 low. While below $8.29 high, it expect to pullback in 3, 7 or 11 swings to correct as II before it resume the next leg higher.
CDEV - Elliott Wave Daily View from 11/02/2021:
It favored ended ((1)) at $2.21 high on 6/08/2020 from $0.24 ATL in daily. Below $2.21 high, it placed ((2)) at $0.51 low on 9/10/2020 low. Wave ((2)) was retraced 0.854 against previous cycle. It favored ended ((3)) at $7.51 high on 6/23/2021 as third wave extension within third wave extension. Third wave extension is very common in stock market. ((4)) favored ended at $3.90 low on 8/20/2021 as double correction. Above $3.90 low, it finally ended ((5)) at $8.29 high on 11/04/2021 high as expected in earlier blog. It currently favoring correction in 3 or 7 swings lower as II.
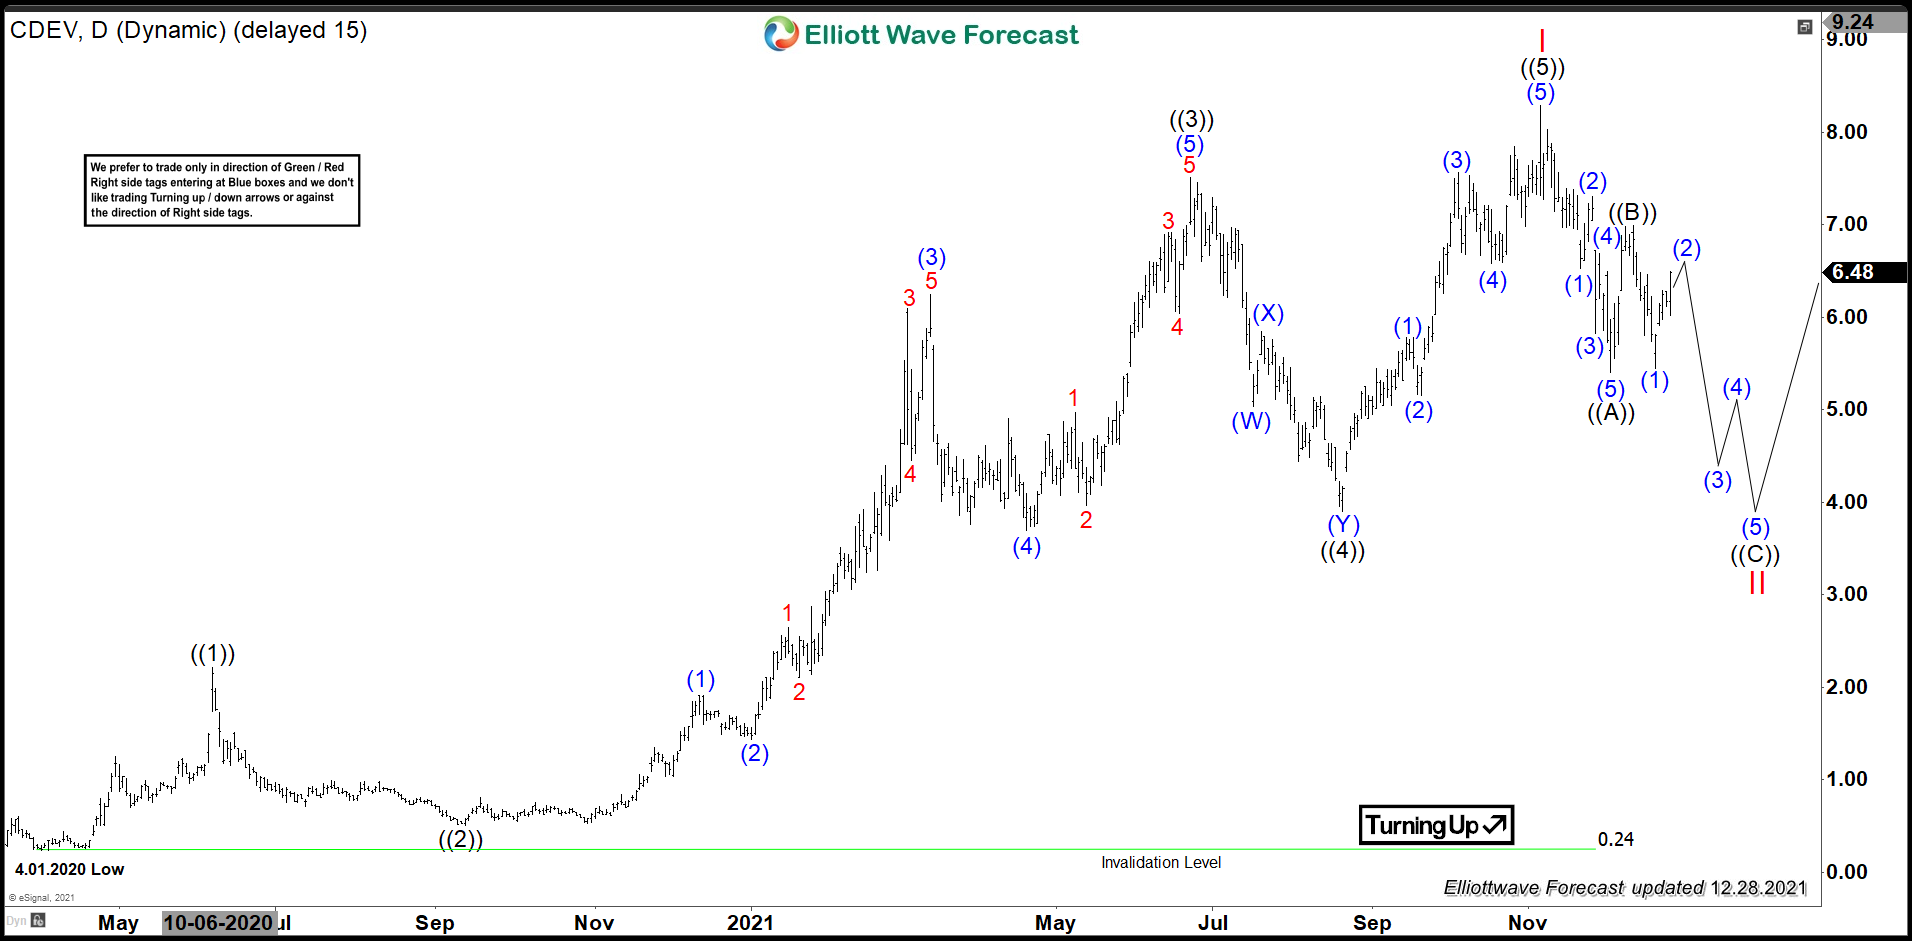
CDEV - Elliott Wave Daily Latest View:
It placed ((A)) at $5.40 low on 12/02/2021, while above there it proposed ended ((B)) at $7.00 on 12/10/2021 high. Currently it favored to correct lower in ((C)) of II towards equal leg between $4.10 - $2.30 area before turning higher again. Alternatively, ((B)) might extend higher in flat correction, which ideally should fail below $8.29 to turn lower. In such case, the equal leg area for ((C)) will change accordingly.
Tronox Holdings Plc (TROX) operates as vertically integrated manufacturer of TiO2 pigment in North America, South & Central America, Europe, Middle East, Africa & Acia Pacific. The company operates Titanium bearing minerals & mines & beneficiation & smelting operations. It comes under Basic Materials sector as Chemical industry type & trades as TROX ticker at NYSE.
TROX - Elliott Wave Latest Daily View:
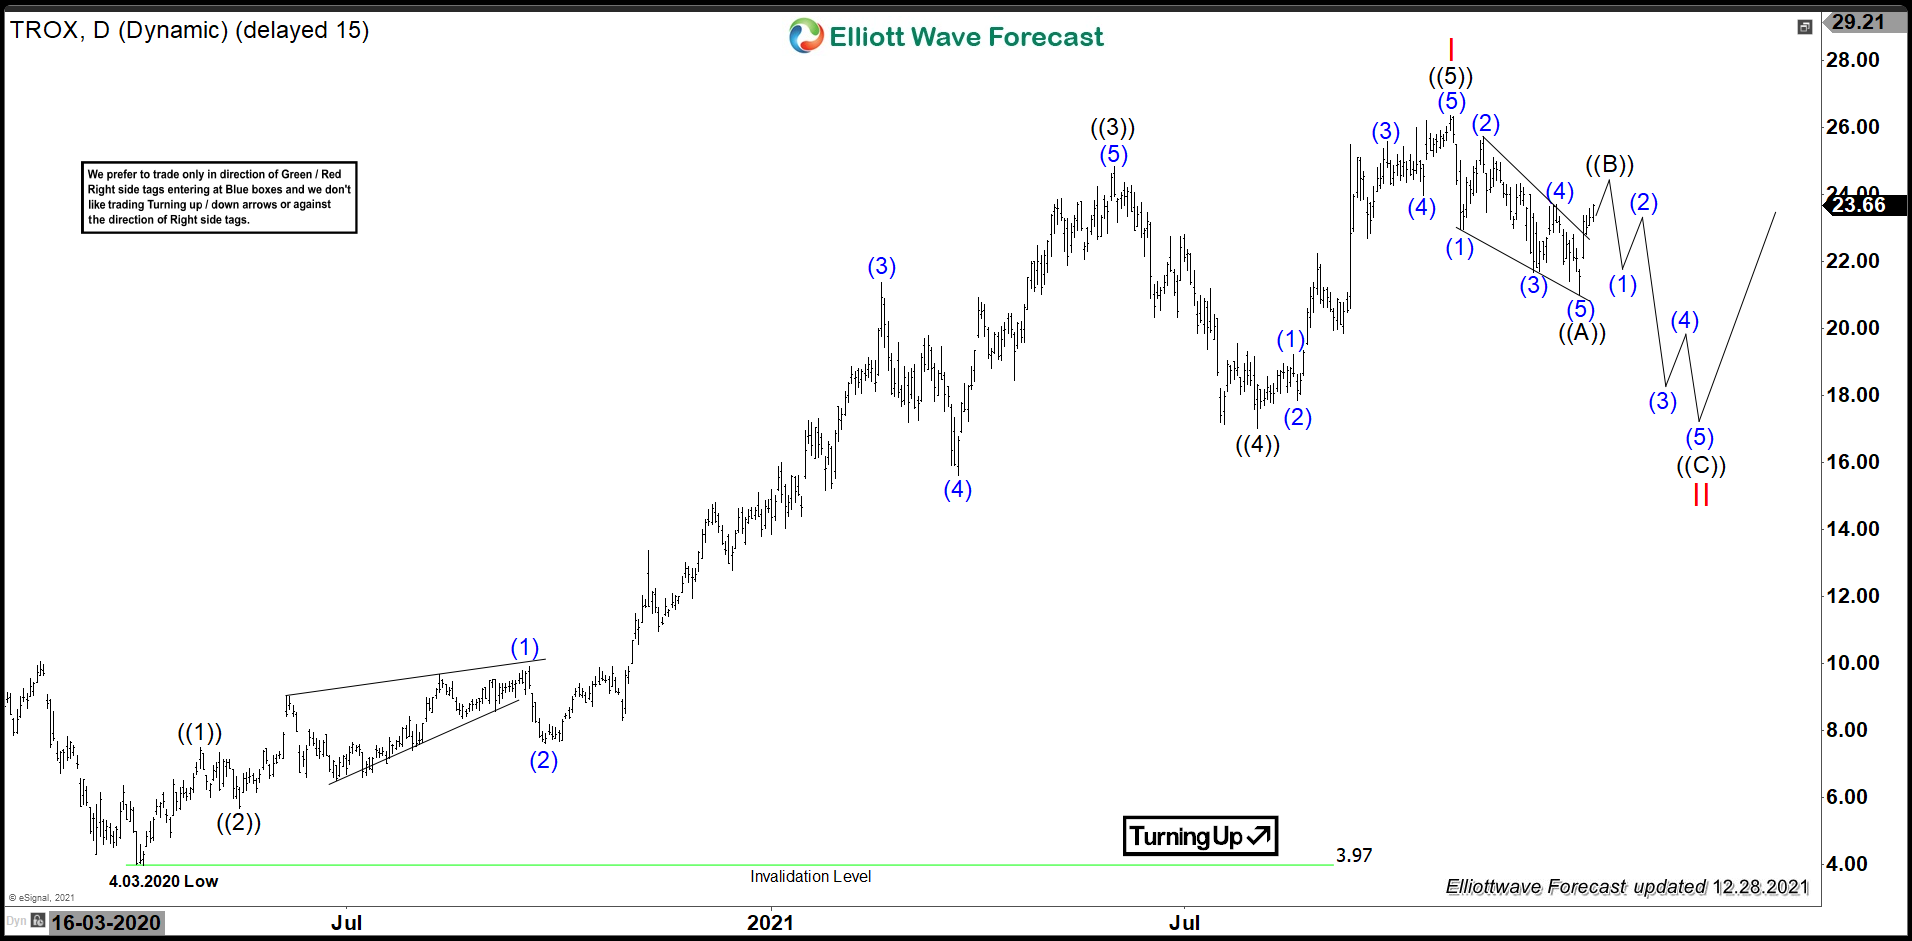
Since December-2010, TROX made ATH at $38.00 in May-2012, while ATL at $3.65 in January-2016. It trades as sideways price action since 2010. In Covid pandemic early last year, it made a low of $3.97 on 4/03/2020. Thereafter it made an impulse up cycle, which proposed ended on 10/25/2021 & starts correcting lower.
Since 4/03/2020 low, it favored ended ((1)) at $7.49 on 4/29/2020 high. While below there, it placed ((2)) at $5.68 low on 5/15/2020 low as 0.5 retracement against previous cycle. Thereafter it started ((3)) wave as third wave extension of third wave extension & ended at $24.81 high on 6/02/2021. It placed ((4)) at $17.01 low on 8/03/2021 as 0.382 retracement against previous cycle. Finally, it ended ((5)) at $26.33 high on 10/25/2021 as red I against the cycle from April-2020 low & started correcting lower as II.
Below, short term high of $26.33, it favored ended ((A)) at $21.00 low on 12/20/2021. While above $21.00 low, it favors higher in ((B)) to correct the cycle from 10/25/2021 high in 3 or 7 swings before turning lower. Ideally ((B)) should fail below $26.33 high to extend further lower in equal leg area in ((C)) before start the next leg higher or at least 3 swings bounce. Once ((B)) ends, we can project the extension area for ((C)) to finish wave II before it start the next leg higher.
Adidas is a German multinational corporation designing and manufacturing shoes, clothing and accessories. Created in 1934 by Adolf Dassler and headquartered in Herzogenaurach, Germany, the company is the largest sportswear manufacturer in Europe. Adidas is a part of both DAX40 and of SX5E indices. From the all-time lows, Adidas is showing a strong bullish behavior. In particular, from the 2008 lows it has gained more than 10x in value. In the initial article from January 2021, we were calling for a new cycle up. We were right, Adidas has printed a new all-time high at 336.25. In this blog, we provide an update.
Adidas Monthly Elliott Wave Analysis 12.28.2021
The monthly chart below shows the Adidas stock $ADS traded at XETRA. From the all-time lows, the stock price has developed a cycle higher in blue wave (I) of super cycle degree towards January 2008 highs at 51.63. From there, a correction lower in blue wave (II) has retraced part of the rise. It has printed a bottom on November 2008 at 21.22. From November 2008 lows, a cycle in wave (III) has extended towards August 2019 highs at 296.75. Hereby, the extension beyond 4.236 qualifies the cycle as a 3rd wave. From the August 2019 highs, a correction lower in wave (IV) has unfolded as an expanded flat structure towards the March 2020 lows at 162.20.
From the March 2020 lows, a new cycle in wave (V) is in progress and has broken to the new all-time highs. The minimum target higher being 328.80 has been already met. However, $ADS might have ended only the wave I of (V). Therefore, investors can buy Adidas in a pullback expecting more upside beyond 328.80 target.
Adidas Daily Elliott Wave Analysis 12.28.2021
The daily chart below shows in more detail the advance higher in red wave I of blue wave (V) and the pullback in wave II. First, from the March 2020 lows at 162.20, a cycle higher in red wave I has unfolded as an impulse and printed its top in August 2021 at 336.25. Hereby, wave ((1)) shows the extension. Currently, a correction lower in red wave II is taking place and should find support in 3, 7 or 11 swings for more upside in wave III of (V). Right now, while $ADS is trading below 300.25, the prices can fall into the 220.76-171.54 area. There, buyers can enter the market for a rally to the new all-time highs.
The last time I looked at Bit Digital was back in October 2021. At the time, I was favouring that a pullback against the 7/20/2021 low was complete, and that the new swing higher was underway. Lets take a look at the chart I was presenting:
Bit Digital October 2021 view:
Back in October, the market had looked like wave (2) was set. This brings up a good practice we like to use at EWF. We do NOT trade the middle areas. Even though (2) was appearing to be set, the market had other ideas and was wanting to do a double correction lower. The price had not confirmed the next move higher was underway, by taking the August 9 peak. If you can't trade a blue box at a 100% area, we need to be patient and wait for the next opportunity. Now lets fast forward to present chart and see how things turned out.
Bit Digital Elliottwave View December 2021:
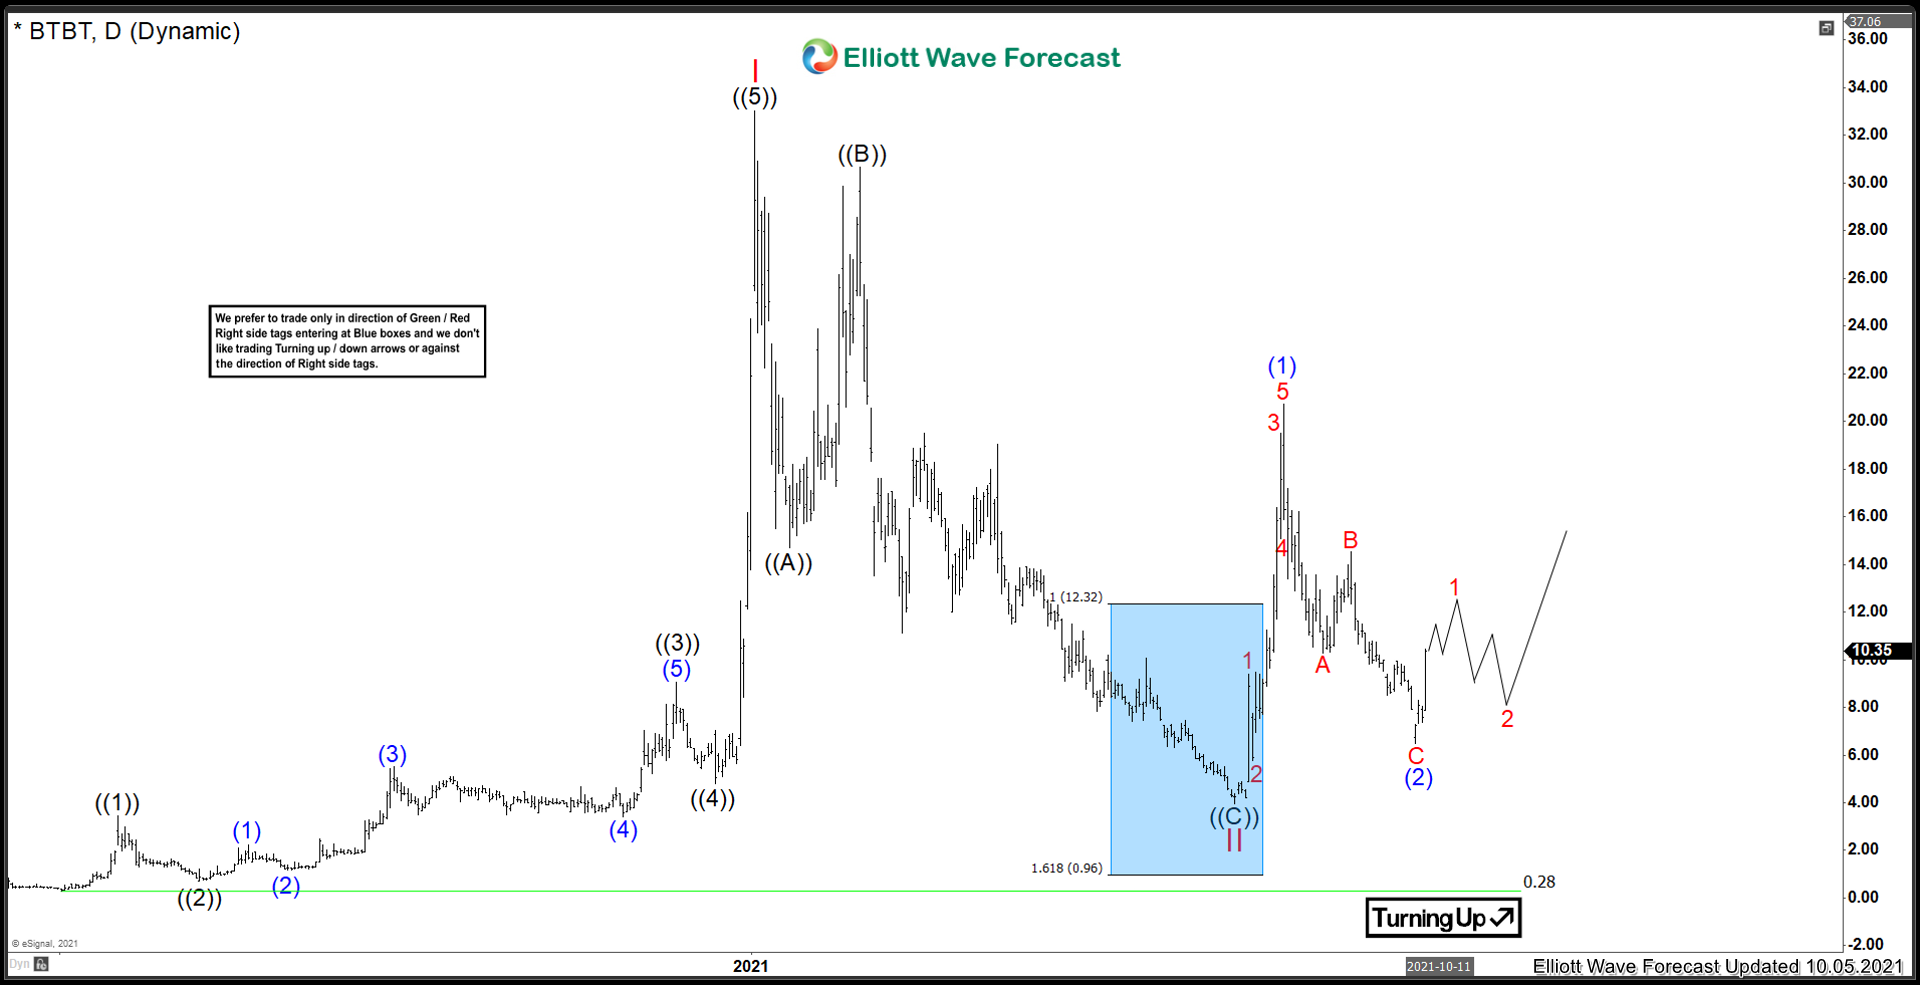
As mentioned, Bit Digital had other ideas. The rally from the 9/20 low turned out to be 3 swing higher, and now with prices breaking the 9/30, has confirmed that a double correction lower to correct 7/20 low is underway.
Bit Digital prices appear to be ready to bounce in a ((b)) wave of Y of (2). However, it is possible that this swing lower can be a sharp Y wave without a proper connector in ((b)). Right now, there is no 100% area to enter the market for a bounce. However, as long as prices remain above the 7/20 low @ 3.97 and more importantly, the 0.28 low, I do favour further upside.
Should the 3.97 low break, then the instrument would favour still correcting the entire cycle in Red II. I do not favour this at this time, but without a blue box to trade, there isn't a great risk reward area where buyers can enter for a bounce.
In this technical blog, we will look at the past performance of 4 hour Elliott Wave Charts of Tesla stock ticker symbol: $TSLA. In which, the rally from 05 March 2021 low unfolded as an impulse structure with an extended wave three and showed a higher high sequence. Therefore, we knew that the structure in Tesla is incomplete to the upside & should see more upside. So, we advised members not to sell the stock & buy the dips in 3, 7, or 11 swings at the blue box areas. We will explain the structure & forecast below:
Tesla 4 Hour Elliott Wave Chart
Here’s 4hr Elliott wave Chart from the 11/28/2021 Weekend update. In which, the rally to $1250.78 high ended 5 waves from 5/19/2021 low & made a pullback. The internals of that pullback unfolded as Elliott wave zigzag structure where wave (A) ended in 5 swings at $978.60 low. Then a bounce to $1201.95 high ended wave (B) & started the next leg lower in wave (C) towards $931.49- $763.70 blue box area. From there, buyers were expected to appear looking for new highs ideally or for a 3 wave bounce minimum.
Tesla 4 Hour Elliott Wave Chart
This is the latest 4hr Elliott wave Chart, in which the stock is showing a reaction higher taking place from the blue box area at $931.49- $763.70. Right after ending the zigzag correction within the blue box area. Allowed members to create a risk-free position with the minimum reaction higher towards 50%- 76.4% Fibonacci retracement from the peak. However, a break above $1250.99 high is still needed to confirm the next extension higher & avoid double correction lower.
Is $SLV Ready to Turn Higher In The Larger Cycles?
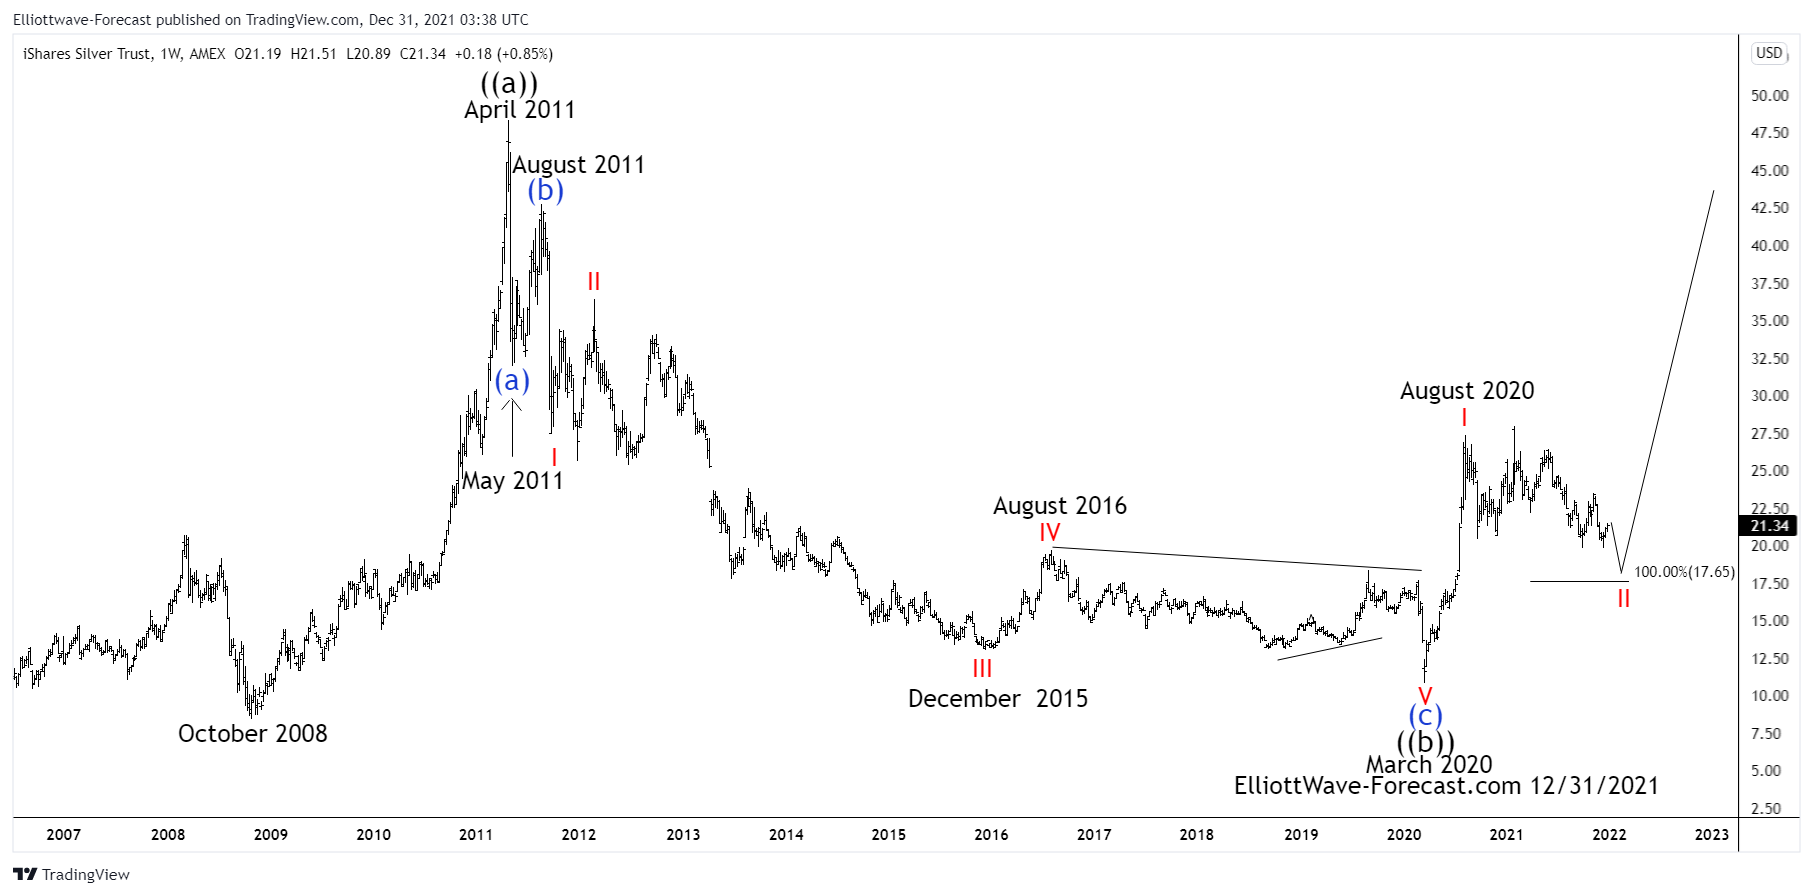
Firstly there is data back to when the ETF fund began in 2006 as seen on the weekly chart shown below. The fund made a low in 2008 at 8.45 that has not since been taken out in price. This analysis assumes from the October 2008 lows to the April 2011 highs was a larger degree impulse cycle up from the all time Silver lows.
Secondly, the decline from the April 2011 highs down to the May 2011 lows was five waves. Price held below the April 2011 highs during the bounce from the May 2011 lows to the August 2011 high.
The analysis continues below the weekly chart.
Thirdly, the cycle from the August 2011 high now appears complete. The red wave I, expanded flat wave II bounce & wave III decline to the December 2015 lows best looks as two Elliott Wave impulses. The bounce to the August 2016 high was strong enough to suggest it had corrected the cycle from the red wave II highs in February 2012. From the August 2016 high the sideways to lower decline appears to be an Elliott Wave triangle structure. This ended the wave “E” at the February 2020 highs. From this point in time the instrument printed another Elliott wave impulse lower into the March 2020 lows at 10.86.
In conclusion. Down from the April 2011 highs SLV exhibits qualities of an Elliott Wave zig zag structure that now appears complete. This is due to the bounce from the March 2020 lows. It was strong enough and apparently in a five wave impulse. This suggests the cycle lower from the 2011 highs had ended. Also the correction of the cycle up from the all time lows had completed at the March 2020 lows. While below the November 2021 highs the metal can see another low before a larger degree turn higher again.
AVAX (Avalanche) is one the top cryptocurrency having market cap around $25.9B. In cryptocurrency segment, it is ranked 11th by market cap having current price at around $106.1. Since June-2021 low, it rises more than 10 fold in the price, which shows the tremendous strength & trend in past few months.
Since September-2020, AVAX (AVAXUSDT - Binance) started the higher high sequence & gains the initial momentum in early 2021. It favored ended the impulse sequence as I red at $60.30 on 2/10/2021 high started from 9/22/2020 low. Thereafter the larger correction of II unfolded & ended at $9.32 low on 6/22/2021. The correction was 0.854 as dip retracement of previous wave I.
In the previous blog, it expected to extend higher in ((3)), while dips remain above $51.04 low. But it gave dip correction from ATH, which favors the idea of ((1)) ended at $147 high followed by ((2)) correction at $75.50 low.
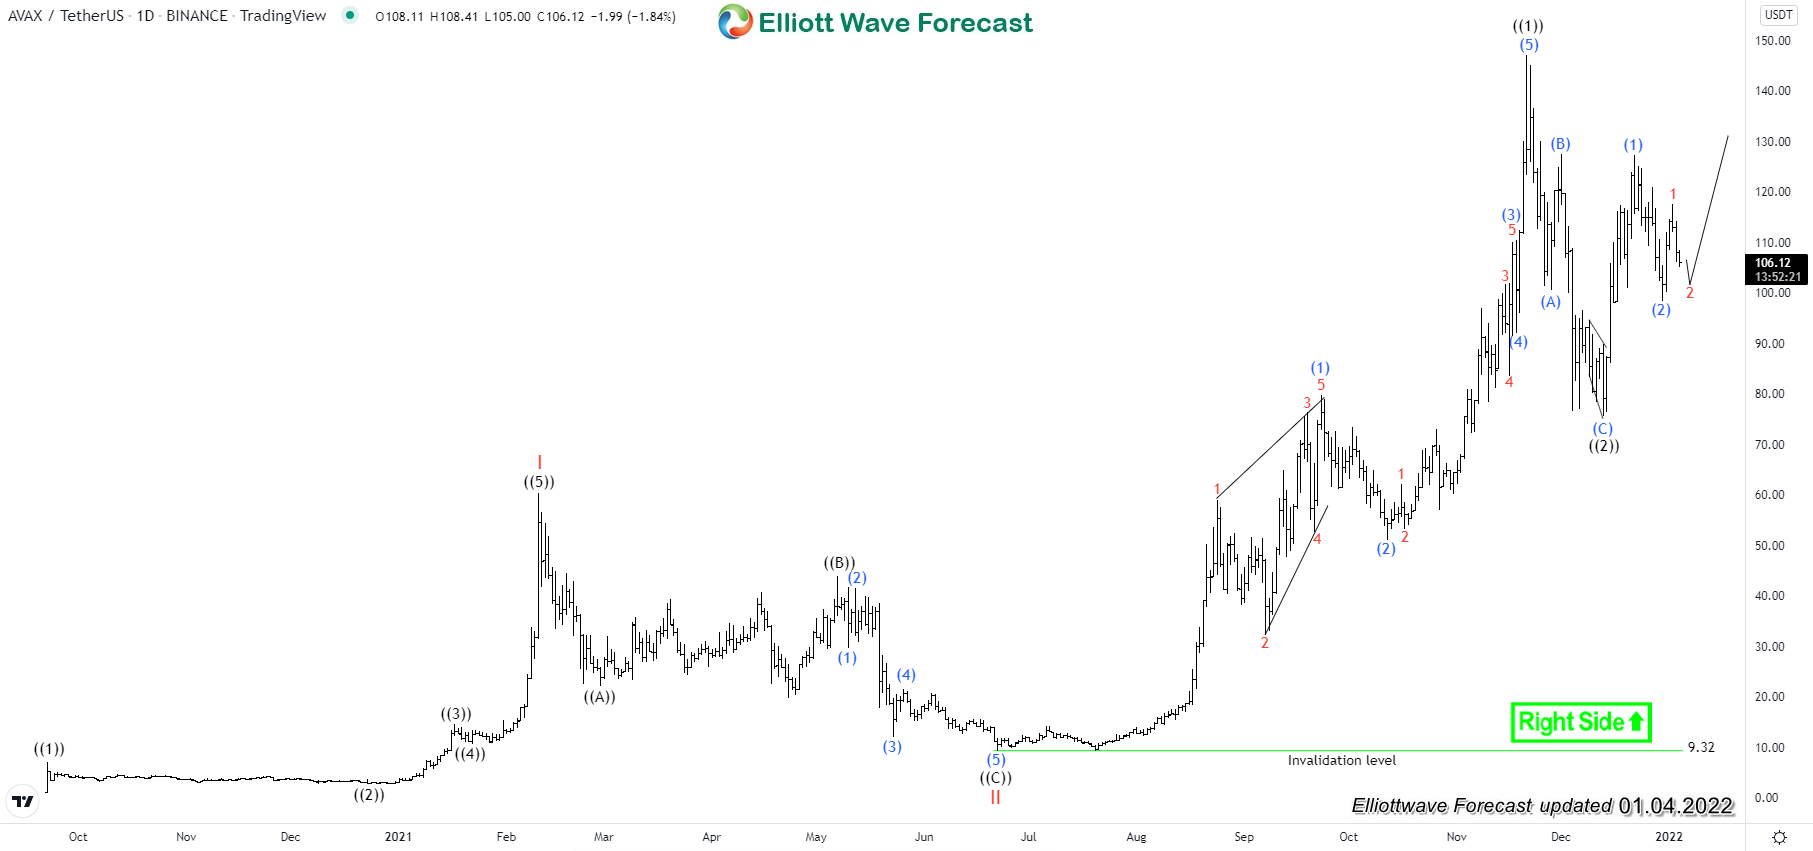
AVAX - Elliott Wave Daily Latest View:
It gains the huge momentum in the sequence started from 6/22/2021 low & placed ((1)) at $147 high on 11/21/2021. It favored ended (1) at $79.80 high on 9/23/2021. It placed (2) at $51.04 low on 10/12/2021 as 0.382 retracement against the previous cycle of (1). It proposed ended (3) at $110.41 high & (4) at $92.00 as 0.236 retracement of wave (3). Finally it favored ended (5) at $147 high on 11/21/2021 as ((1)). While below $147 high, it proposed ended ((2)) as zigzag correction at $75.50 low. ((2)) was 0.5 retracement of ((1)).
It proposed ended (1) at $127.32 high & (2) at $98.25 low on 12/30/2021. While dips remain above $98.25 low, it expect to extend higher in (3), which will confirm when it breaks above $127.32 high of (1). Alternatively, if it breaks below $98.25 low from current level, we can see double correction lower in (2) towards $88.45 - $81.60 area, which ideally should remain above $75.50 to resume higher.
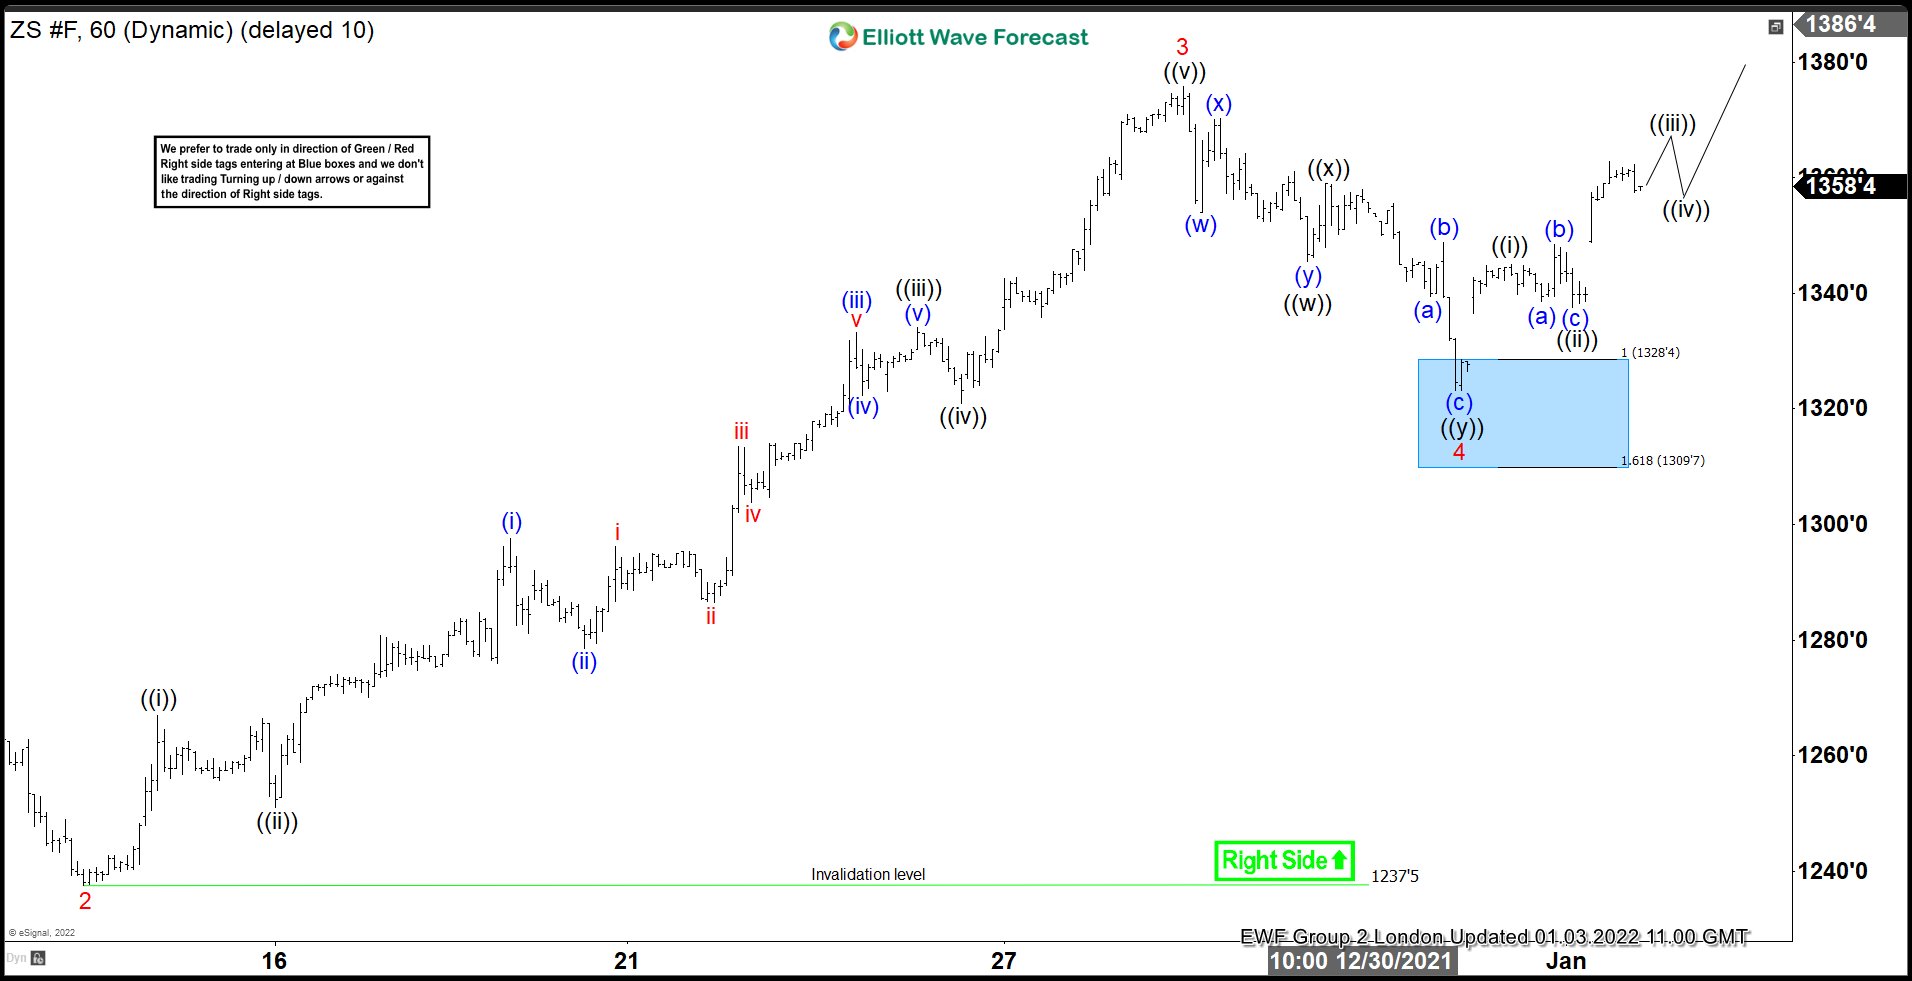
Soybeans Futures ( $ZS_F ) is another instrument that has given us trading opportunities lately . The commodity is showing impulsive bullish sequences in the cycle from the November's 1181'3 low. Recently it made clear 3 waves pull back and found buyers at the blue box as we expected. In this technical blog we’re going to take a quick look at the charts of Soybeans Futures published in members area of the website and explain the Elliott Wave structure and trading strategy.
Current view suggests the commodity is ending 4 red as Elliott Wave Double Three pattern. The correction is labeled as ((w))((x))((y)). Buyers should ideally appear at the blue box : 1328'6-1310'0 for 3 waves bounce at least. We already can count 7 swings down from the peak, so turn higher can be taking place any moment. Once bounce reaches 50 Fibs against the ((w)) black connector, we will make long position risk free ( put SL at BE). Invalidation for the trade would be break below 1.618 fibs extension: 1310'0.
You can learn more about Elliott Wave Patterns at our Free Elliott Wave Educational Web Page.
The commodity has found buyers at the marked zone and we got very good reaction from there. The rally from the blue box reached and exceeded 50 fibs against the ((x)) connector. Consequently members who have taken the long trades at the blue box now enjoying profits in a risk free trades. Now we would need to see break of 3 red peak in order to confirm next leg up is in progress. Otherwise if pivot at 4 red low gives up in the mean time, we can get double from the peak, which will give us opportunity to buy the commodity again.
Keep in mind that market is dynamic and presented view could have changed in the mean time. You can check most recent charts in the membership area of the site. Best instruments to trade are those having incomplete bullish or bearish swings sequences. We put them in Sequence Report and best among them are shown in the Live Trading Room.
In this technical blog, we will look at the past performance of 4 hour Elliott Wave Charts of XLY. In which, the rally from 18 March 2020 low unfolded as a nest and showed a higher high sequence. Therefore, we knew that the structure in XLY is incomplete to the upside & should see more upside. So, we advised members not to sell the ETF & buy the dips in 3, 7, or 11 swings at the blue box areas. We will explain the structure & forecast below:
XLY 4 Hour Elliott Wave Chart
Here’s 4hr Elliott wave Chart from the 12/19/2021 Weekend update. In which, the rally to $215.06 high ended 5 waves from 3/05/2021 low & made a pullback. The internals of that pullback unfolded as Elliott wave double three structure where wave (W) ended in 5 swings at $197.60 low. Then a bounce to $207.78 high ended wave (X) & started the next leg lower in wave (Y) towards $190.29- $179.47 blue box area. From there, buyers were expected to appear looking for new highs ideally or for a 3 wave bounce minimum.
XLY 4 Hour Elliott Wave Chart
This is the 4hr Elliott wave Chart from the 12/28/2021 update. In which the ETF is showing a reaction higher taking place from the blue box area at $190.29- $179.47. Right after ending the double three correction within the blue box area. Allowed members to create a risk-free position with the minimum reaction higher towards 50%- 76.4% Fibonacci retracement from the peak. However, as far as pivot from $215.06 high stays intact a double correction lower cannot be ruled out at this stage.
The Fed has indicated that they plan to continue to taper and start raising interest rates from near zero to curb the strongest inflation in four decades. A hawkish Fed, if followed through in action, may support in USD at least in the short term.
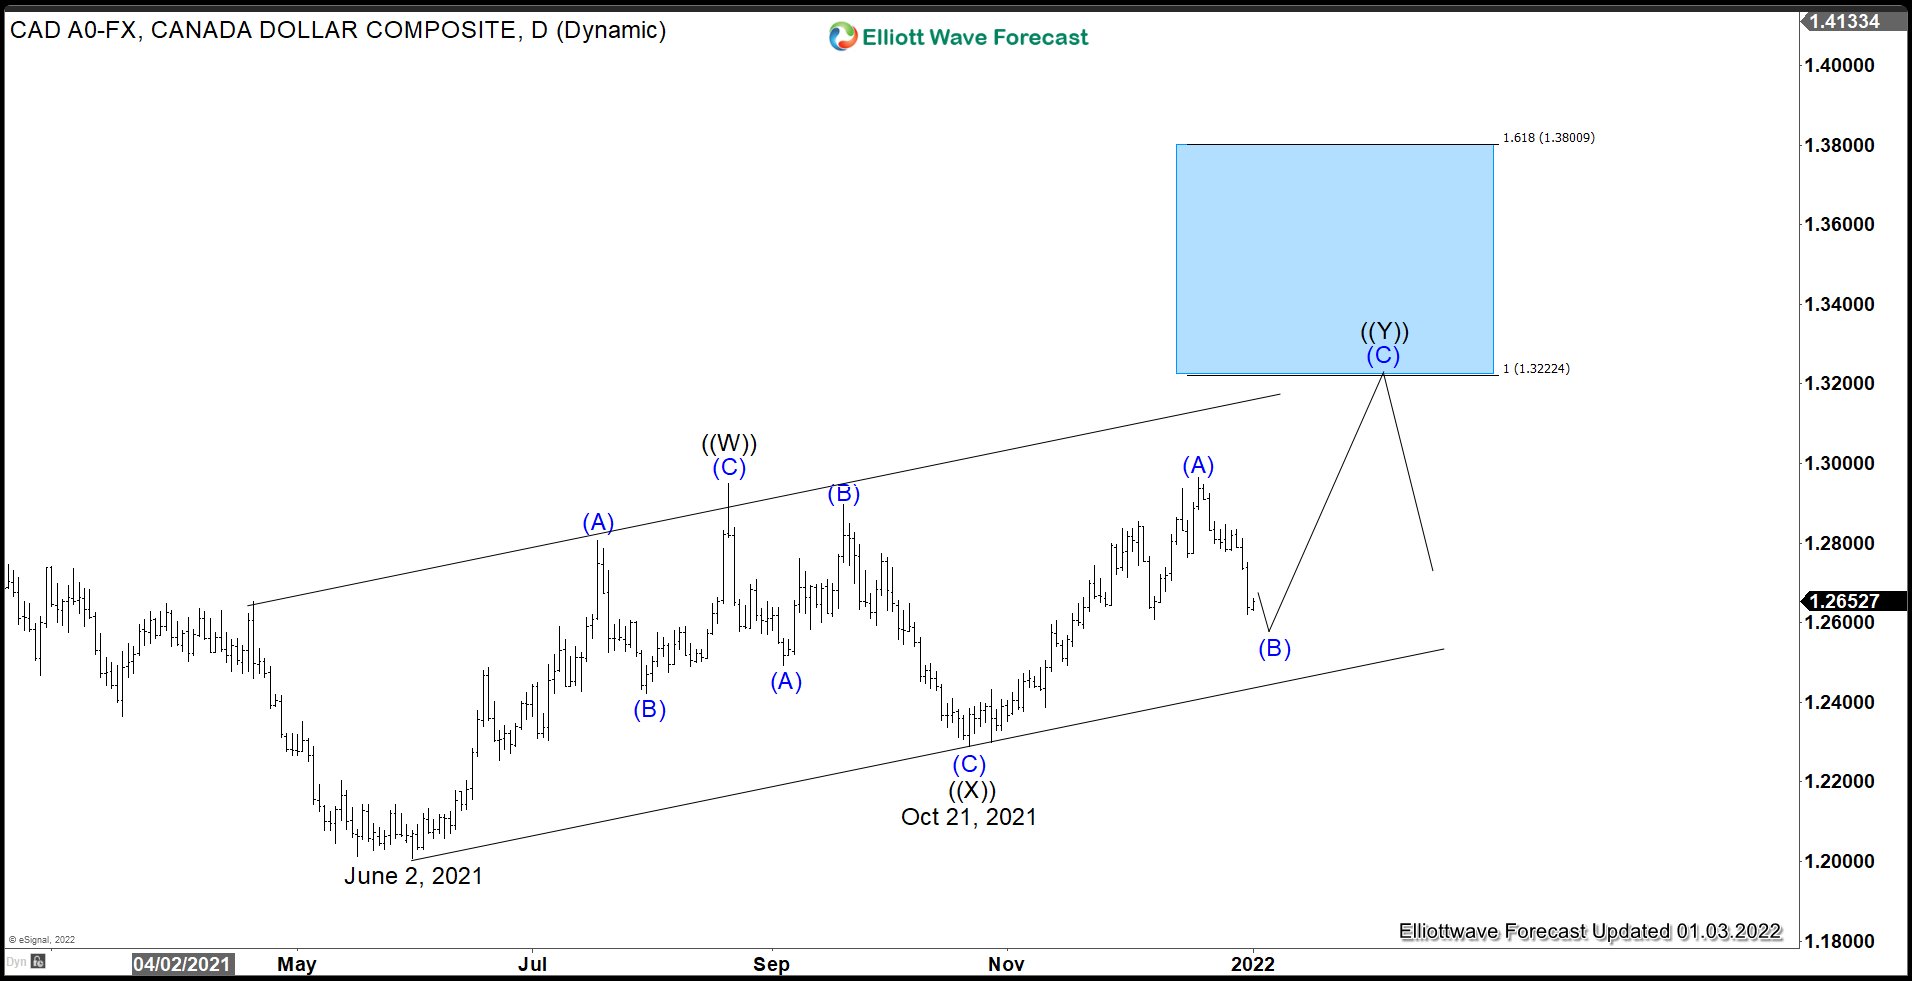
USDCAD Daily Chart
$USDCAD Daily Chart above shows an incomplete sequence from June 2, 2021 low favoring more upside. The rally from June 2 low can be counted as a double zig zag Elliott Wave structure. Up from June 2 low, wave ((W)) ended at 1.2949. Internal of wave ((W)) is unfolding as a zigzag where wave (A) ended at 1.2807, wave (B) ended at 1.2422, and wave (C) ended at 1.2949. Pullback in wave ((X)) ended at 1.2288 with internal unfolding as a zigzag. Down from wave ((W)), wave (A) ended at 1.249, wave (B) ended at 1.289, and wave (C) of ((X)) ended at 1.2288. Wave ((Y)) is in progress as a zigzag structure. Up from wave ((X)), wave (A) ended at 1.296. As far as wave (B) pullback holds above October 21, 2021 low (1.2288), expect the pair to continue higher.
USDCAD 1 Hour Chart
1 hour chart of USDCAD above shows that as far as it stays below 1.2847, the pair could see further downside before ending wave ((v)) of C. The pair has currently reached the 100% Fibonacci area from December 20, 2021 high which comes at 1.254 - 1.266. It can soon see support for more upside or a 3 waves rally at least.
In this technical blog, we are going to take a look at the past performance of Natural Gas futures, 1-Hour Elliott wave Charts that we presented to our members. But before looking into the Charts, we need to understand the market nature first. The market always fights between the two sides i.e Buying or Selling. We at Elliott Wave Forecast understand the Market Nature and always recommend trading the no-enemy areas. We called blue boxes on our charts as no-enemy areas. They usually give us the reaction in favor of market direction in 3 swings at least. Now, let us take a quick look at the Natural Gas Charts and structure below:
Natural Gas 1 Hour Elliott Wave Chart
Above is the 1 hour Elliott wave chart update from the 1/04/2022 Asia update. In which, the decline from 28 December 2021 peak ended wave 1 at $3.536 low. Up from there, the pair corrected the cycle from the December peak in wave 2 bounce. The internals of that bounce unfolded as Elliott wave double three structure where wave ((w)) ended at $3.794 high. Wave ((x)) ended at $3.638 & Wave ((y)) was expected to find sellers at $3.901- $4.062 blue box area. From there, sellers were expected to appear looking for more downside or for a 3 wave reaction lower at least.
Natural Gas 1 Hour Elliott Wave Chart
This is the latest 1 hour Elliott wave Chart from the 1/06/2022 Asia update. In which the pair is showing a reaction lower taking place from the blue box area. Right after ending the double correction within the blue box area. Allowed members to create a risk-free position shortly after taking the short positions at the blue box area. However, a break below $3.536 low remains to be seen to confirm the next extension lower & avoid double correction higher.
BNP Paribas is a French international banking group being within 10 largest banks in the world. Headquartered in Paris, it is a merger of Banque Nationale de Paris (BNP) and Paribas. BNP Paribas is a part of Euro Stoxx 50 (SX5E) and CAC40 indices. Investors can trade it under the ticker $BNP at Euronext Paris and under $BNPQY in US in form of ADRs. The group is engaged in retail banking serving more than 30 millions of customers and investment banking operations. BNP Paribas is present on five continents operating in 72 countries.
In the initial article from September 2020, we have predicted that a trampoline for a breakout is building up. We were right. Now, BNP Paribas provides an opportunity in a pullback. Here, we present an update.
The monthly chart below shows the BNP Paribas stock $BNP traded at Euronext Paris. From the all-time lows, the stock price is showing an Elliott wave motive wave pattern. The cycle up in blue wave (I) of super cycle degree has ended by printing its top on May 2007 at 92.39. After 5 waves higher in (I), the correction in wave (II) has ended on January 2009 at 20.08.
From the 2009 lows at 20.08, $BNP has developed a leading diagonal pattern higher towards 69.21 level in red wave I. Within that cycle, one can see 5 overlapping subwaves of primary degree. After 5 waves, subsequently, a deep correction in wave II has found a bottom in April 2020 at 24.50. From the lows, wave III has started. Break of the 69.21 highs, will confirm that. The target for wave III is 73.56-103.95 area and even higher.
The daily chart below shows the first stages of the wave III from the April 2020 lows. The rally towards 63.59 highs is only the wave ((1)). Currently, a pullback in world indices might create the wave ((2)) pullback in $BNP. This pullback should find support in 3, 7 or 11 swings against the 24.50 lows for an acceleration higher in wave ((3)) of III.
Draft Kings had a stellar 2020 and beginning of 2021, but is now correcting the entire cycle from the IPO. But where can this stock find support for a bounce? First, lets take a look at what this company does:
"“DraftKings is an American daily fantasy sports contest and sports betting provider. The company allows users to enter daily and weekly fantasy sports–related contests and win money based on individual player and team performances in five major American sports (MLB, the NHL, the NFL, the NBA and the PGA), Premier League and UEFA Champions League soccer, NASCAR auto racing, Canadian Football League, the XFL, Mixed martial arts (MMA) and Tennis.”"
Lets get into the charts!
Draft Kings Elliotwave View:
Longer Term view from the March 2021 peak. Draft Kings peaked on March 22/2021 at a high of 74.38. After the peak, the stock has slowly been correcting the entire cycle from the all time low. The initial ((A)) wave down is favoured to be in 5 waves, with a 3 wave reaction into ((B)). ((B)) peaked in September 2021. After ((B)) peaked, the stock is now within another impulse lower which should unfold in 5 waves. In shorter cycles, I am seeing some divergences starting to take place with the impulse in blue degree of ((C)). This means that the blue (5) is underway. Momentum in ((C)) overall is not diverging in higher time frames. This supports the idea that this move so far is correcting in nature.
The stock is currently within the blue box extreme area at 30.01. Since this was a SPAC, the invalidation level is not really known as there was some price action before the SPAC gapped up when DKNG announced their intent to take it over. I would prefer the prices to remain above the ((2)) low at 10.60, and this should be the stop. Any lower than that, and the stock might be in a wave 3 lower.
In conclusion, I don't like to sell it short, but the stock is only turning up any trades in the blue box would be more speculative. The Algos are going to start fighting for direction in the blue box, we don't like selling it short down here in the box, with momentum diverging in shorter cycles.
Hello fellow traders. In this technical blog we’re going to take a quick look at the Elliott Wave charts of AUDUSD Forex Pair published in members area of the Elliottwave-Forecast . As our members know, AUDUSD s is showing lower low sequences in the cycle from the February 25th peak. Recently we got recovery which has unfolded as Elliott Wave Double Three pattern. In further text we’re going to explain the forecast and Elliott Wave Pattern and trading strategy.
Before we take a look at the real market example, let’s explain Elliott Wave Double Three pattern.
Elliott Wave Double Three Pattern
Double three is the common pattern in the market , also known as 7 swing structure. It’s a reliable pattern which is giving us good trading entries with clearly defined invalidation levels.
The picture below presents what Elliott Wave Double Three pattern looks like. It has (W),(X),(Y) labeling and 3,3,3 inner structure, which means all of these 3 legs are corrective sequences. Each (W) and (Y) are made of 3 swings , they’re having A,B,C structure in lower degree, or alternatively they can have W,X,Y labeling.
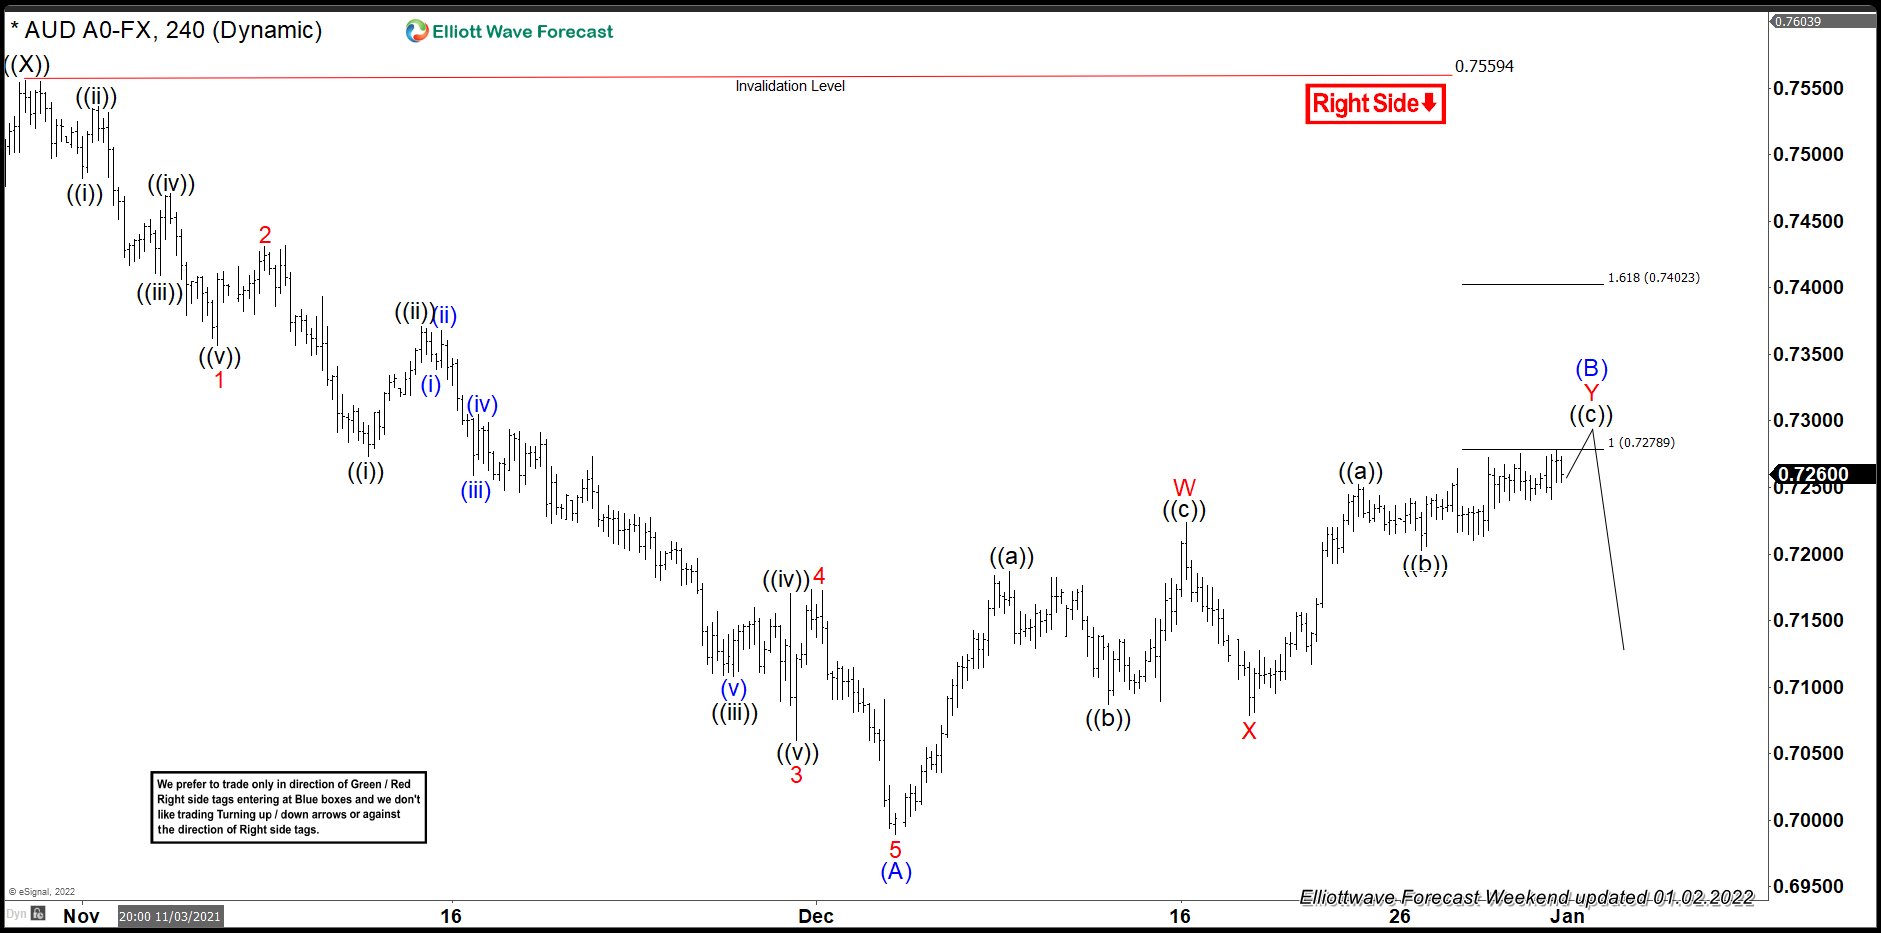
AUDUSD 4 Hour Elliott Wave Analysis 01.02.2022
AUDUSD is giving us (B) blue recovery that is unfolding as Elliott Wave Double Three Pattern. It’s having WXY red inner labeling. The main characteristic of Double Three is that all 3 legs has corrective sequences. First leg Wave W has clear 3 waves structure , Zig Zag ((a))((b))((c)) that ended as trunaction. Then we got 3 waves pull back in ((x)) connector. Currently the pair is doing last leg up Y red h is also unfolding as Zig Zag Pattern. Recovery has already reached extremes at 0.7278 area , and turn can happen any moment. incomplete at the moment. We recommend members to avoid buying, while favoring the short side as far as the price holds below 1.618 fib ext 0.7402 level and as far as 0.7559 pivot holds. You can learn more about Elliott WaveDouble Three and Zig Zag Patterns at our Free Elliott Wave Educational Web Page.
AUDUSD 4 Hour Elliott Wave Analysis 01.08.2022
Sellers appeared at the equal legs area 0.72789 and we got good reaction from there. The decline from the blue box reached 50 fibs against the X connector, as a result members who took short positions should be enjoying profits in a Risk Free positions. At the moment we see wave (B) blue recovery completed at 0.7279. Decline from the 0.7279 high looks like 5 waves which increases chances next leg down is in progress. Currently we can be doing 3 waves bounce against the mentioned high. However if pivot at 0.7279 gives up we could see larger recovery.
Keep in mind that market is dynamic and presented view could have changed in the mean time. You can check most recent charts in the membership area of the site. Best instruments to trade are those having incomplete bullish or bearish swings sequences. We put them in Sequence Report and best among them are shown in the Live Trading Room.
Polygon (formerly Matic Network, MATICUSD) is a Layer 2 scaling solution backed by Binance and Coinbase. The project seeks to stimulate mass adoption of cryptocurrencies by resolving the problems of scalability on many blockchains. Polygon combines the Plasma Framework and the proof-of-stake blockchain architecture.
MATICUSD Daily Chart
MATICUSD started a rally from July 20th 2021 low. From there we can see 5 waves up forming a Leading Diagonal Structure ending on December 27th. (If you want to learn more about Elliott Wave Theory, please follow these links: Elliott Wave Education and Elliott Wave Theory). Wave ((1)) ended an impulse structure at 1.7991. Then MATICUSD corrected in 3 swings making a zig zag structure, ending wave ((2)) at 1.0148. Another rally resumed from the low completing wave ((3)) at 2.2200 and pullback again making a flat correction ended wave ((4)) at 1.4446. Then last push higher made an ending diagonal structure and completed wave ((5)) and wave I of the leading diagonal at 2.9249.
At the end of December, the cryptocurrency dropped strongly losing more than 15%. MATICUSD continued falling, in 3 swings, to 2.0210 and we labeled this movement as wave ((W)). Then we have seen a bounce ending at 2.2919 and turn lower again. We labeled the bounce as wave ((X)) and from here we are calling 3 swings more down to draw a double correction structure to end wave ((Y)) and wave II. To conclude the whole correction as wave II we are suggesting a 1.5016 – 1.1660 area where MATICUSD should continue with the rally.
Based in Chicago, Illinois, The Boeing Company is a supplier of commercial jet aircraft for passenger and cargo needs to several airline companies around the world, including United Airlines, American Airlines, and Southwest Airlines. The recent uptick of new virus strain Omicron has again affected international travel with more stringent testing and travel rules by many countries. Low production numbers together with the decline in air travel demand weighed on Boeing's finances during the pandemic. Below is the technical outlook of the stock using Elliott Wave.
Boeing (BA) Daily Elliott Wav Chart
Boeing Co (BA) shows a 5 swing bearish sequence from March 15, 2021 high. The decline from there is unfolding as a double three (double zigzag) Elliott Wave structure. Down from March 15, 2021 peak, wave (A) ended at 219.07, and wave (B) ended at 258.40. Stock then extended lower in wave (C) towards 204.80 and this completed wave ((W)). Rally in wave ((X)) then ended at 241.15. Wave ((Y)) is in progress as a zigzag structure where wave (A) ended at 190.04. Wave (B) is proposed complete at 218.93. While the stock continues to stay below the descending trend line from March 15 peak, further downside is expected to reach 121.9 - 167.4 where buyers should be seen for at least 3 waves rally.
In this technical blog, we are going to take a look at the past performance of Palladium Futures, 1-Hour Elliott wave Charts. In which, the decline from 5/04/2020 peak is showing an incomplete to the downside with right side tag pointing lower called for more weakness. Therefore, our members knew that selling the bounces in the direction of the right side tag remained the preferred path. We will explain the Elliott wave structure & selling opportunity our members took below:
Palladium 1 Hour Elliott Wave Chart
Above is the 1 Hour Elliott wave Chart of Palladium from the 12/27/2021 NY update. In which, the decline to $1531 low ended the cycle from November 2021 peak in wave w lower. Up from there the instrument bounce in wave x to correct that cycle. The internals of that bounce unfolded as Elliott wave zigzag structure where wave ((A)) ended at $1865 high. Wave ((B)) pullback ended at $1688 low. Wave ((C)) was expected to reach $2021.95- $2100.80 100%-123.6% Fibonacci extension area of ((A))-((B)). From there, sellers were expected to appear again looking for more downside or for a 3 wave reaction lower at least.
Palladium Latest 1 Hour Chart
This is the latest 1 hour Elliott wave Chart from the 1/11/2022 Asia update. In which the Palladium is showing a reaction lower taking place from the blue box area. Right after ending the zigzag correction within the blue box area. Then it made a minimum reaction lower allowed members to create a risk-free position shortly after taking the selling position. However, a break below $1531 low remains to be seen to confirm the next extension lower & avoid double correction higher.
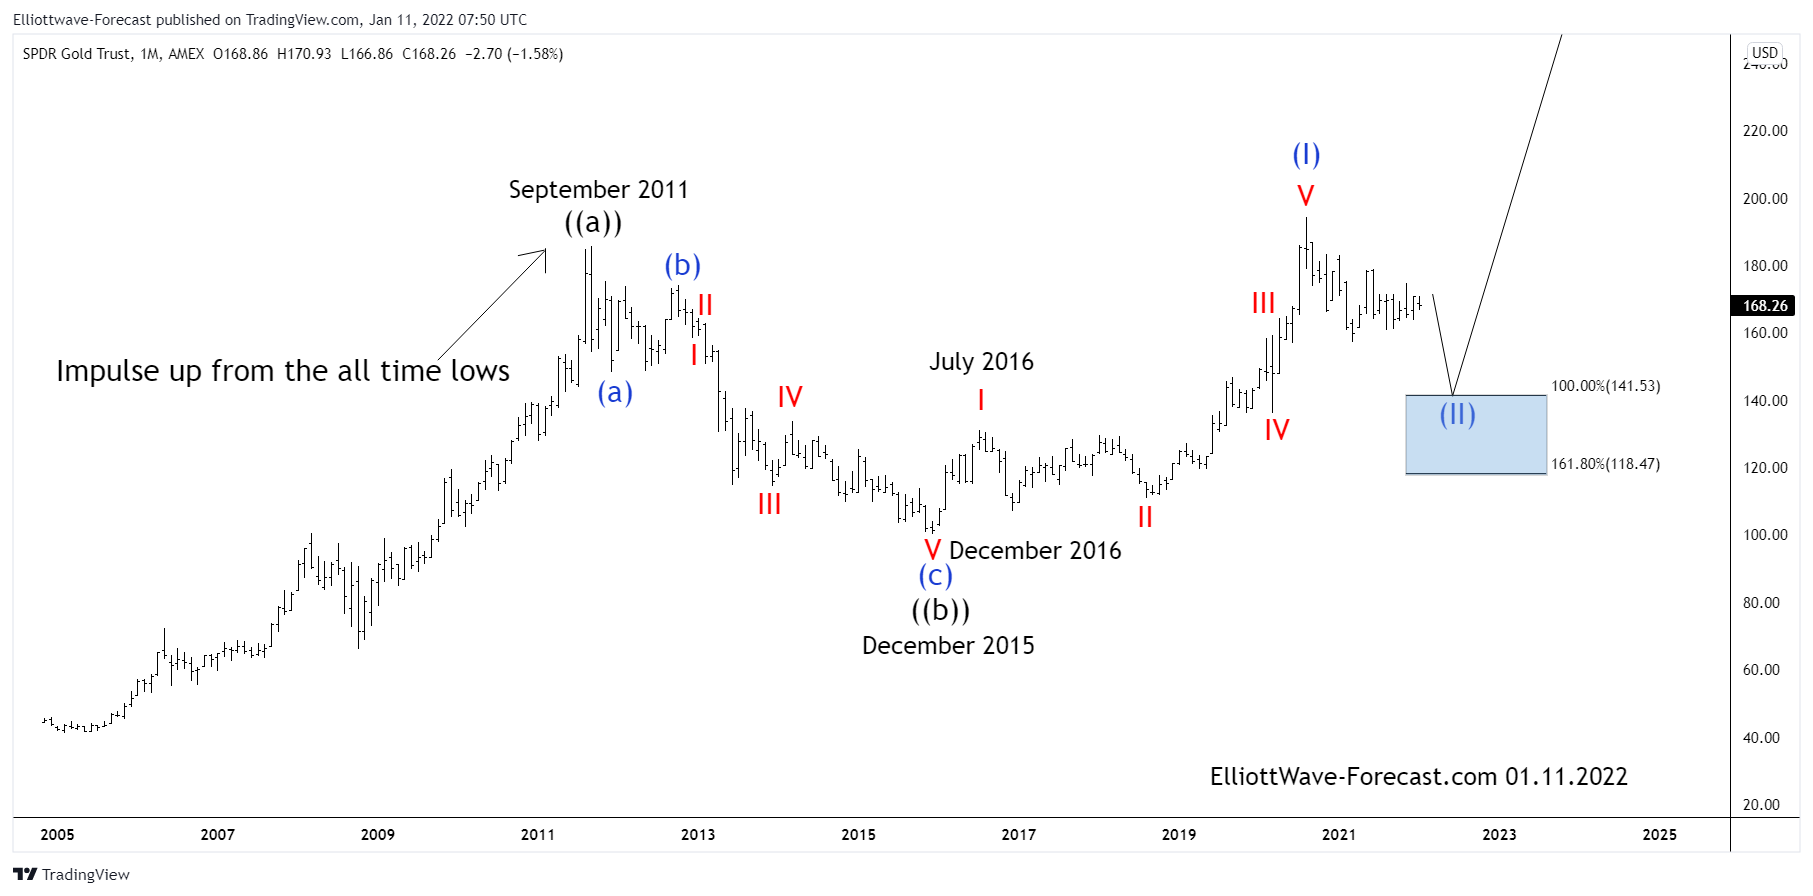
$GLD ETF Long Term Cycles and Elliott Wave Analysis
Firstly the GLD ETF fund is one of the largest as well as one of the oldest Gold tracking funds out there since it’s inception date of November 18, 2004. From there on up into the September 2011 highs it ended a larger bullish cycle as did the Gold commodity in terms of US dollars. From the September 2011 highs the price decline was pretty steep however does appear corrective as a double three (a)-(b)-(c) (in blue color) into the December 2015 lows.
Secondly I would like to mention that the bounce from the December 2015 lows at 100.23 into the July 2016 wave I highs is clearly an Elliott Wave impulse. The bounce was strong enough to suggest it ended the cycle lower from the September 2011 highs as well thus at this point it is very much suspected to be resuming a long term bullish trend from the December 2015 lows. As shown above from there the metal made a wave (I) high in August 2020. From there it appears to be in a double three correction of the cycle up from the 2020 lows.
The analysis continues below the monthly chart.
Thirdly in conclusion: The market moves in sequences of 5-9-13 swings in an impulse. It also moves in 3-7-11 swings when it corrects the prevailing trend. The bounce higher from the December 2015 lows appears to have a complete bullish sequence of five waves up. This bounce continued into the August 2020 highs. Currently the metal instrument appears that while below the June 2021 highs at 178.85 it can see weakness continue toward the 141.53 area before a turn back higher.
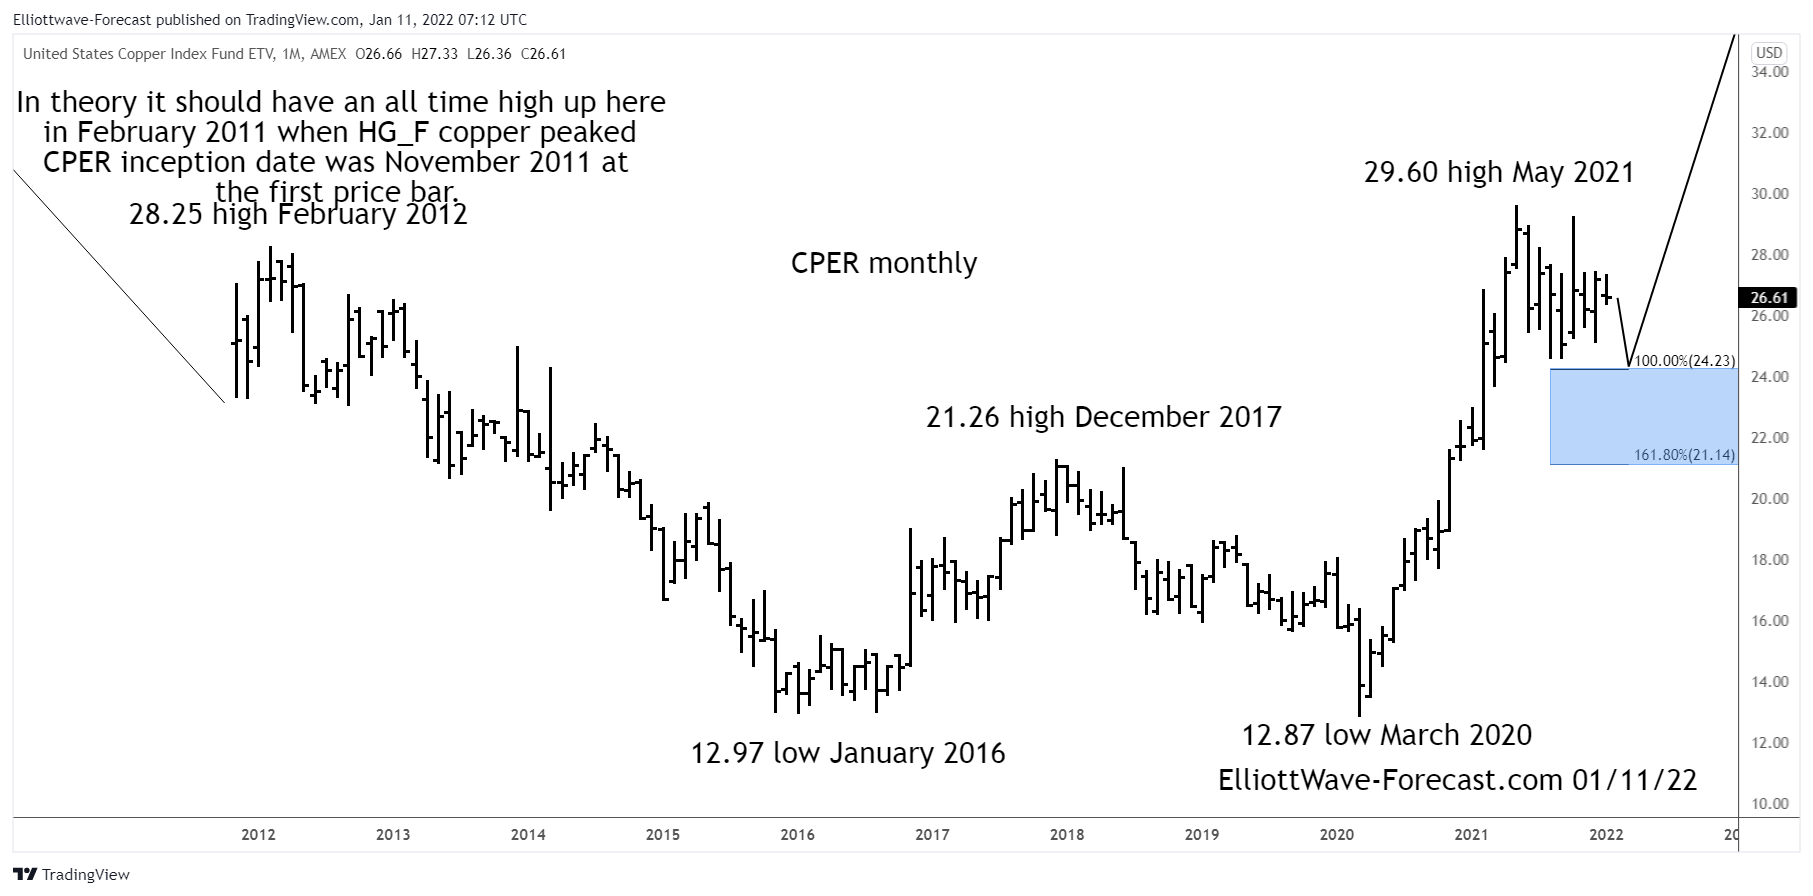
Firstly the CPER Copper Index Tracking instrument has an inception date of 11/15/2011. There is data in the HG_F copper futures before this going back many years. That shows copper made an all time high on February 15th, 2011 at 4.649. Translated into this instrument, it is mentioned on the monthly chart. The decline from there into the January 2016 lows appeared to have been a double three in the commodity HG_F. Thus I will work with that idea in this CPER instrument.
The analysis continues below the CPER monthly chart.
Secondly the CPER Copper Index Tracking instrument from the all time highs made what is favored to be a double three correction lower. This ended at the 12.97 lows in January 2016. From the January 2016 lows up into the December 2017 highs appeared to be another double three structure. The bounce was strong enough on momentum indicators to suggest it had ended the cycle lower from the all time highs.
Thirdly, the CPER Copper Index Tracking instrument decline from the December 2017 highs is very ambiguous. This means it is open to more than one interpretation as is most any chart by an Elliott wave analyst. From the 12.87 low from March 20th 2020 created a bearish sequence by taking out the lows from January 2016. This means it could have been a 5th swing lower from the all time highs. The bounce from there in our trend system looks strong and impulsive as well as again suggesting it ended the cycle lower from the all time highs.
In conclusion: Copper HG_F has not made another low under the January 2016 lows as did CPER. Each have went well past the December 2017 highs. The price action has denied the usual 7th swing lower in CPER. In the current pullback this instrument should hold well above the March 2020 lows & ideally turn higher from the blue box area shown as it currently corrects the cycle up from there.
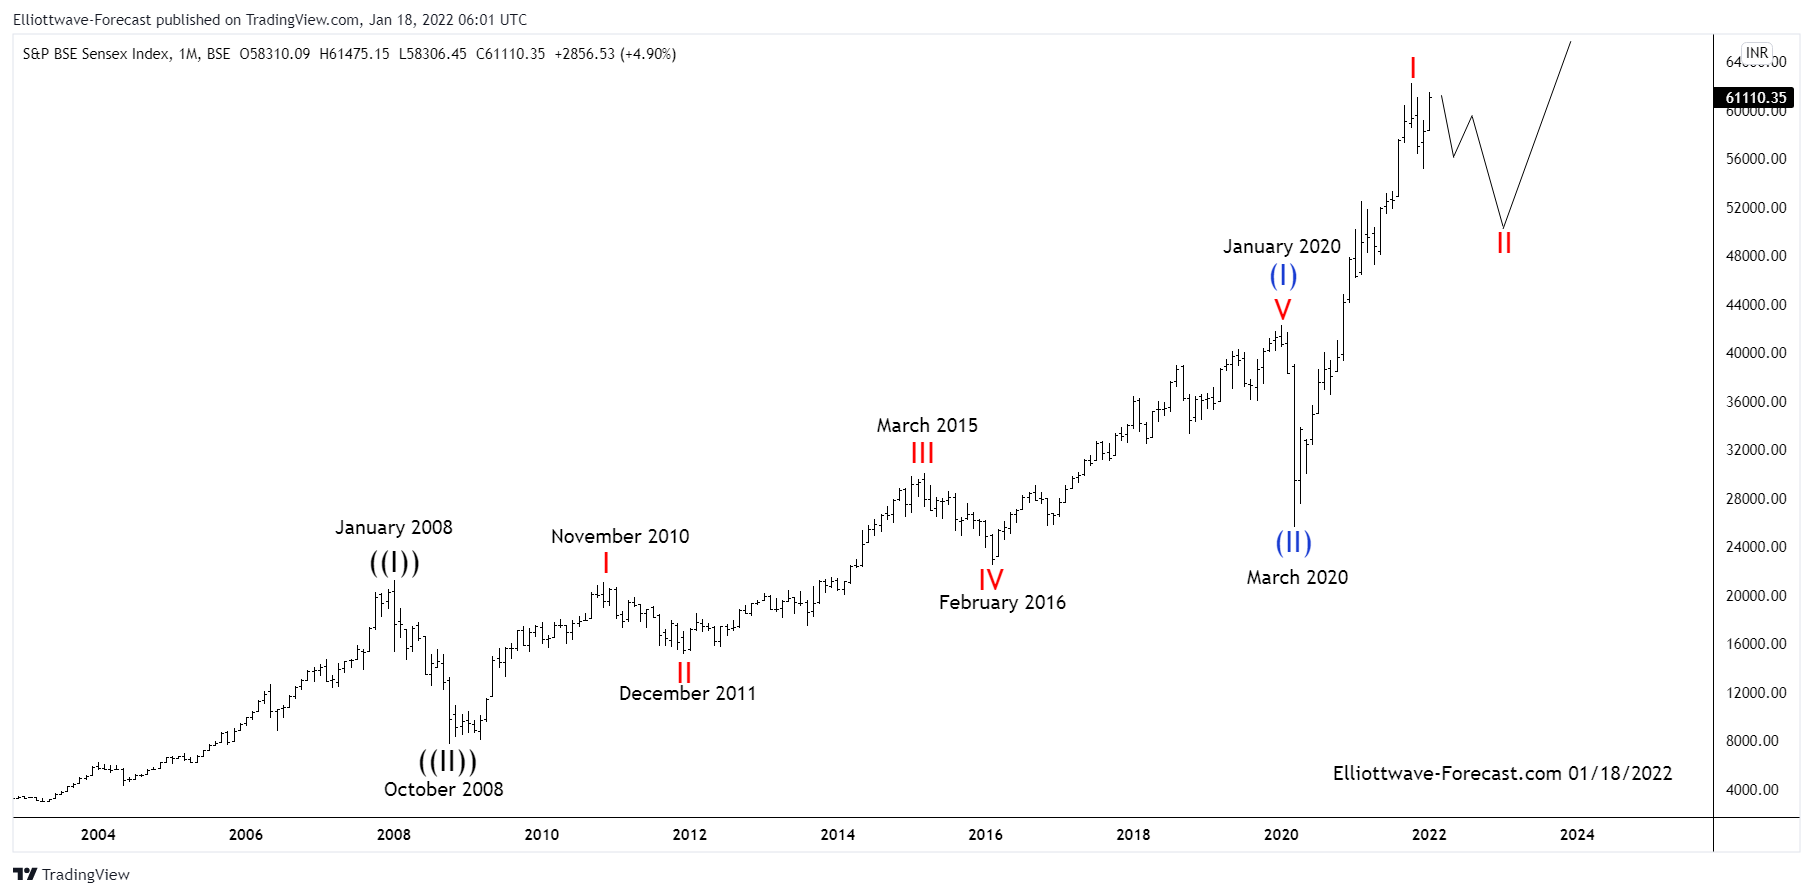
S&P BSE Sensex Index Long Term Bullish Cycles & Elliott Wave
The Sensex Index has been trending higher with other world indices. Firstly in it’s base year 1978 to 1979 the index’s point value was set at 100. From there it rallied with other world indices trending higher into the January 2008 highs. It then corrected the bullish cycle as did most other world indices. Furthermore it ended that larger degree correction in October 2008. From those 2008 lows, the index shows a bullish sequence that favors further upside.
Secondly there was a less bullish alternative Elliott Wave count that had a target extension at 46844. This is where a larger black ((I)) could have ended. However price has since went way past there invalidating the thought putting it more in line with other world indices. In this case the Fibonacci extension is measured is as follows. Take a Fibonacci extension tool on a charting platform. Point 1 will be at zero a hypothetical beginning. Point 2 is at the January 2008 cycle high. From there on up to the March 2020 lows will be the point 3. This gives a Fibonacci extension area fifth wave target where the fifth wave would be equal to the wave one where a larger ((I)) could have ended.
As price exceeded the area suggested in that view the momentum indicators also began suggesting this is a huge bullish nested series of wave one’s and two’s. The preferred analysis continues below the chart.
Sensex Index Monthly Chart
In conclusion the currently favored view in the Sensex index is as shown. It’s showing a nested Elliott Wave bullish cycle. It is in a larger wave ((III)) higher. From the 2008 lows there is a clear five waves up into the January 2020 highs as subdivided on the chart. The pullback in wave (II) into the March 2020 lows was very fast in time however while price is above the March 2020 lows the index should trade higher.
TecDAX is a stock index which tracks the performance of 30 largest German companies from the technology sector. Even though these enterprises are of a high economic importance, their market capitalization and the book order turnover are far below of that of the DAX index. The TecDAX is related to DAX in a similar way like NASDAQ is related to Dow Jones Industrial Average index.
From technical perspective, NASDAQ has been the strongest index in the US. As a matter of fact, it has provided high rewards for those traders who were buying the dips for more upside. One of the features of the market behavior is that weak indices remain weak and strong indices remain strong. The fact that NASDAQ has been outpacing other US indices makes it a good candidate to buy it again once the indices turn higher again. Similar strong uptrend can be also seen in a behavior of TecDAX. This index, therefore, allows entering the German technology sector by providing investors and traders with high returns and protecting them, at the same time, from the defaults originating from trading of single stocks.
In the initial article from September 2020, we were calling for an extension higher within the cycle from March 2020 lows to the new highs. We were right. Now, we have ended a 1st wave of the new cycle. Current pullback should provide an opportunity for an acceleration higher.
TecDAX Monthly Elliott Wave Analysis 01.17.2022
The monthly chart below shows the TecDAX index $TDXP listed at Frankfurt Stock Exchange. From the all-time lows, the index price has developed a cycle higher in wave (I) of a super cycle degree. It has ended in November 2007 at 1060.35. From there, a correction lower in wave (II) has retraced part of the rise by printing a bottom in March 2009 at 387.50.
In 2013, TecDAX was able to make a higher high opening up a bullish sequence. As a matter of fact, it has extended from March 2009 lows far beyond 1.618. Therefore, the cycle higher is an impulse in blue wave (III). It has reached 3051.44 highs in September 2018. From the top, a correction lower has unfolded as an expanded flat which has found its bottom in March 2020 at 2127.05.
From the March 2020 lows, we have broken to the new all-time highs confirming an extension in the blue wave (V). After a pullback, TecDAX should continue its rally.
TecDAX Daily Elliott Wave Analysis 01.17.2022
The daily chart below shows in more detail the $TDXP price action from the March 2020 lows. The advance is an impulse in red wave I of blue wave (V) which has ended in September 2021 at 3990.76. From there, a pullback in wave II unfolds as an expanded flat structure. Hereby, wave ((A)) of II has ended in October 2021. Then, wave ((B)) of II has printed a new all-time high at 4010.04 in the following November. While below there, wave ((C)) is currently in progress. As of right now, the pattern looks incomplete. Once 5 waves of ((C)) of II will accomplish, then expect an acceleration higher in wave III of (V) to take place. The prices should then extend towards 4010.04 and beyond.
The last time I took a look at this company was back in August of 2020, nearly 1.5 years ago. (this article can be viewed here). Before I get into the charts, lets take a look at what Twilio does:
"Twilio is in the cloud communications business and has had an extremely impressive rally since March 2020 low. It is a a cloud communications platform as a service company based in San Francisco, California. Twilio allows software developers to programmatically make and receive phone calls, send and receive text messages, and perform other communication functions using its web service APIs."
Here's that chart I presented way back in August 2020:
Twilio 4H Elliottwave August 2020 view:
Back then, the chart was supporting the idea that a nest was taking place in black ((2)). The stock did enter into the blue box and reacted higher, you can see this reaction in the chart below, now labeled ((4)) instead of ((2)).
It provided a good opportunity for a trade higher. However, the pullback that is currently underway has gone too deep, and it is now favoured this stock is correcting the whole cycle from the IPO. Lets fast forward to present day and see what the chart is speaking.
Twilio Elliottwave Jan 2022 view:
Medium term term view from Feb 2021 peak set @ 457.30 . The pullback since the peak nearly a year ago, has been very choppy. The the ((W)) and ((X)) has played out as an expanded flat connector. This is clearly seen with the (C) leg rallying in 5 waves off the (B) low, which is the tell tale sign of an expanded flat.
There is now another blue box presenting itself from 230.36 to 117.74. I do believe that there is further downside potential still. At the present time, the $SPY is looking for more downside and this can weigh TWLO until the indices strike a low. I have set out the retracements from the entire rally from all time low to all time high on the right side. The 61.8 retrace is approaching at the 189.86 area, this may be the price where algos are able to produce a bounce in 3 waves at least.
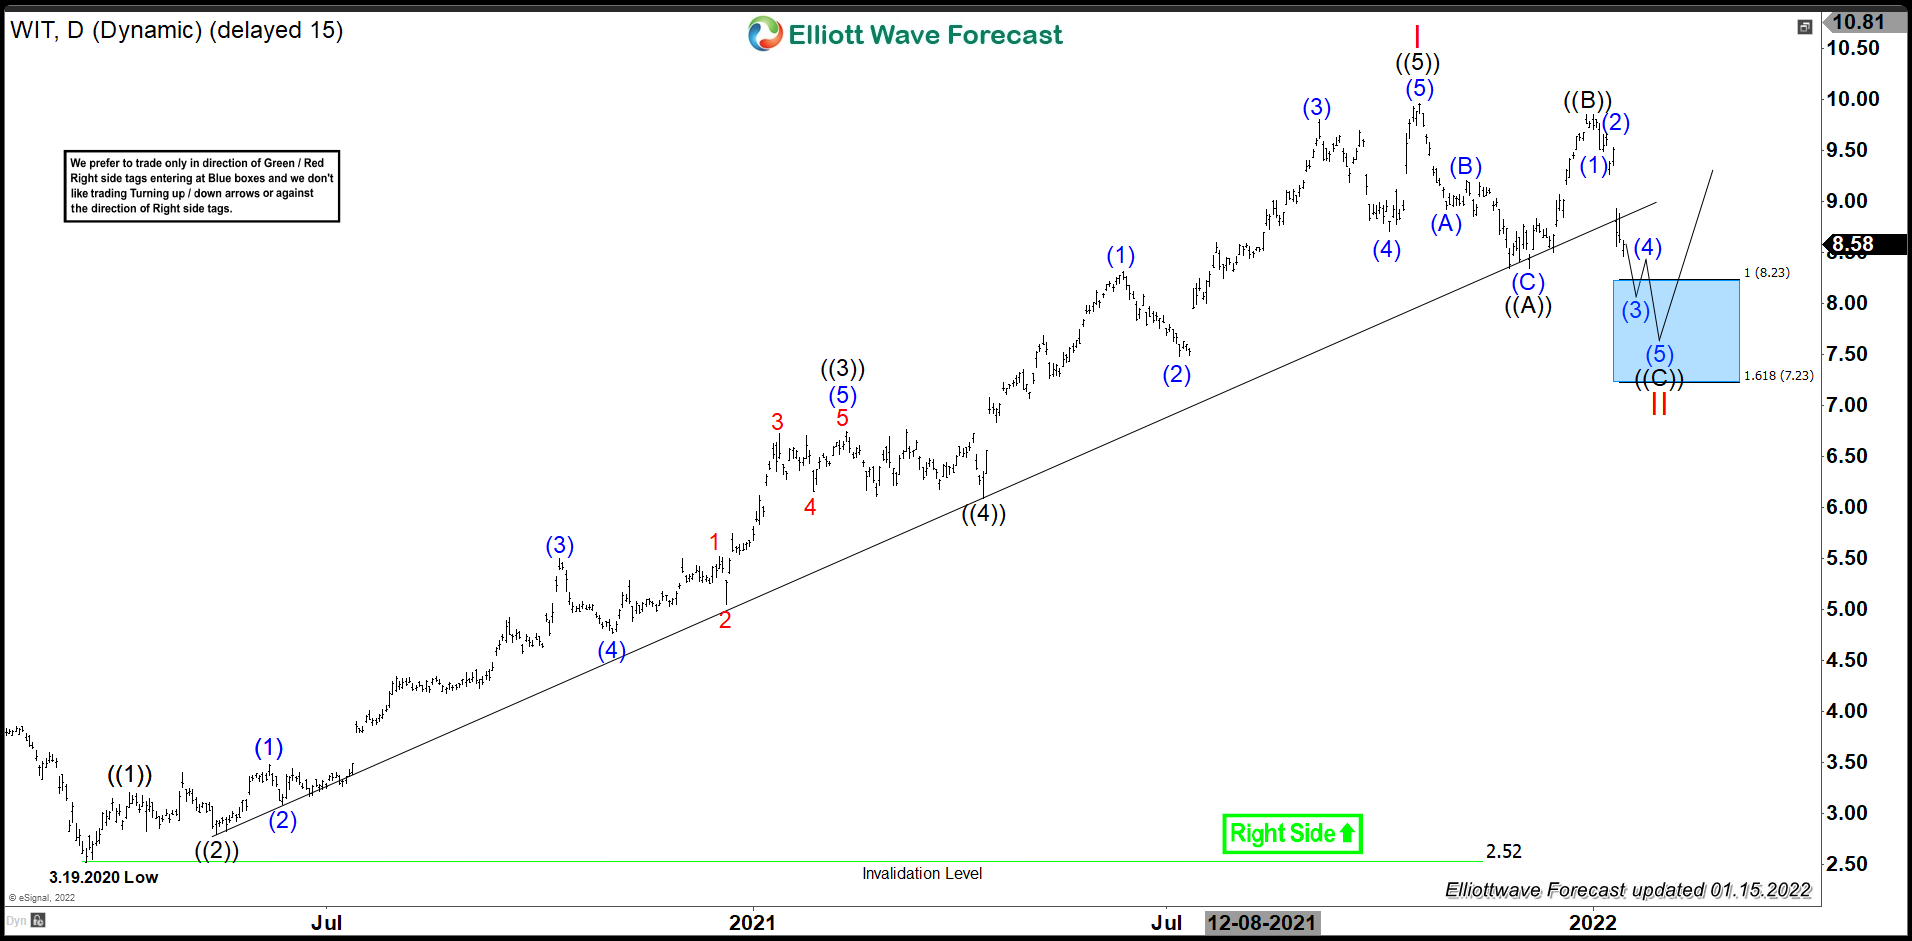
Wipro Limited (WIT) operates as Information technology, Consulting & Business process services company globally. It operates through three main segments, IT Services, IT Products & India State Run Enterprise Services. The company is based in Bengaluru, India (ADR stock) & trades under $WIT ticker at NYSE. It comes under Technology sector as Information Technology services Industry.
WIT consolidates since October-2010 high to March-2020 low between $5.69 – $2.52 range. But after global sell off ends in early last year during Covid Pandemic, it started the impulse sequence higher & rise almost 4X from the bottom. It proposed ended the sequence at $9.96 high on 10/19/2021 against March-2020 low & as shown in previous blog, that it favors flat correction lower towards $8.23 - $7.23 area.
WIT - Elliott Wave Latest Daily View:
It favored ended ((1)) at $3.20 high on 4/07/2020. It placed ((2)) at $2.79 low on 5/14/2020 as expanded flat retraced 0.618 of previous cycle. The wave ((3)) favored ended at $6.74 high on 2/12/2021 as third wave extension. Wave ((4)) was a shallow correction favored ended at $6.09 low on 4/14/2021. While above there, it placed ((5)) at $ 9.96 high on 10/19/2021 to end the cycle as I red started from March-2020 low.
In short term, below $9.96 high of I red, it favored ended ((A)) at $8.34 low & ((B)) at $9.86 high dated 12/30/2021. Currently, it favors lower in (1) blue & expect one or more lows before start bouncing in (2). The bounce in (2) should ideally fail below $9.86 high & expect two more lows to end ((C)) in impulse between $8.23 - $7.23 area before it resume upside. We like to buy the pullback in equal leg area, when it ends II flat correction for further upside or at least for 3 swings bounce.
WIT - Elliott Wave Alternate View:
Alternatively in short term, it might be in (3) of ((C)) & favors one more low to end (3). Thereafter it expect a bounce in (4) followed by next leg lower in (5) of ((C)) to end II correction in equal leg area before resume upside.
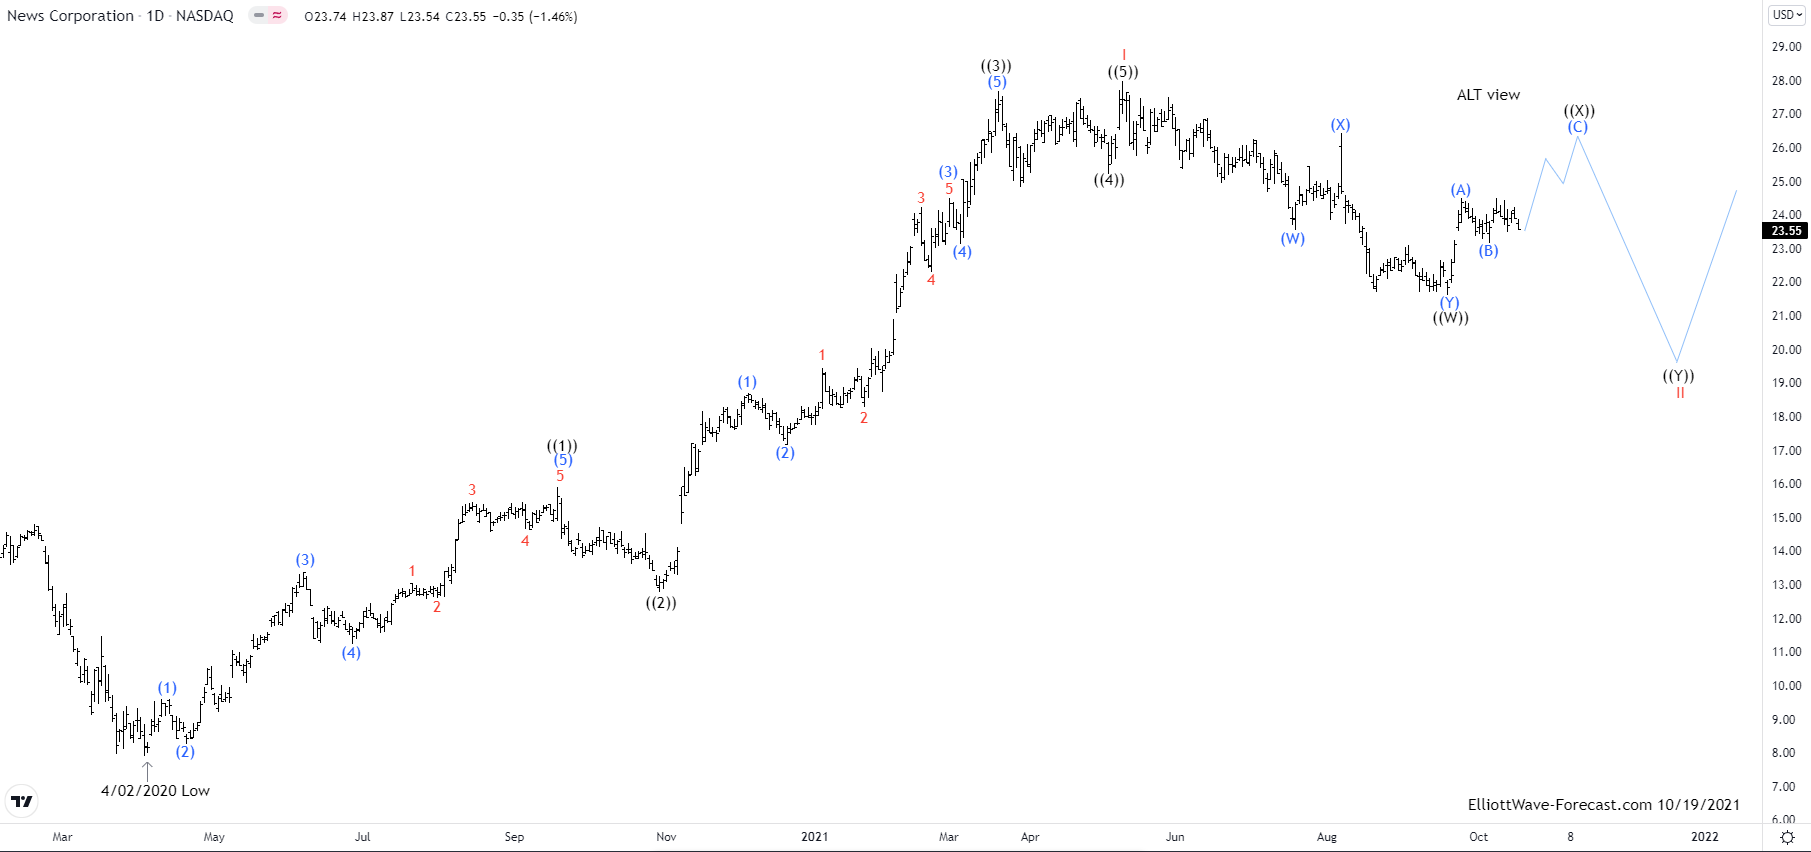
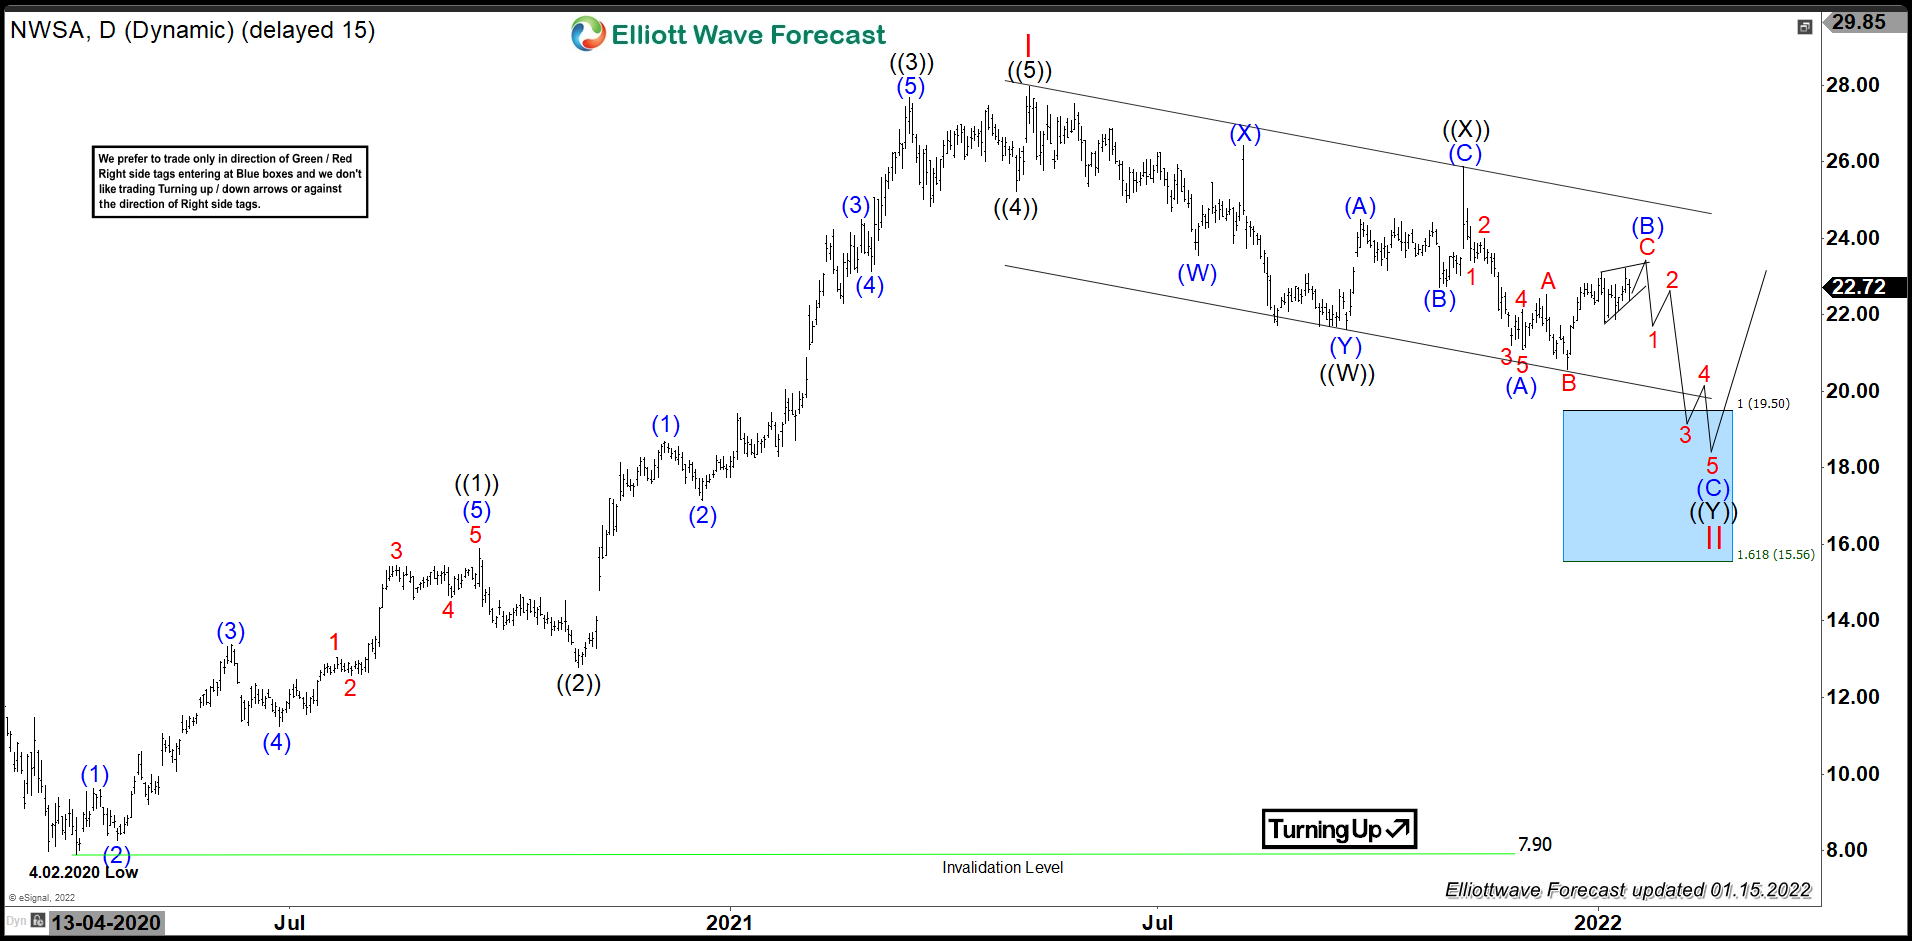
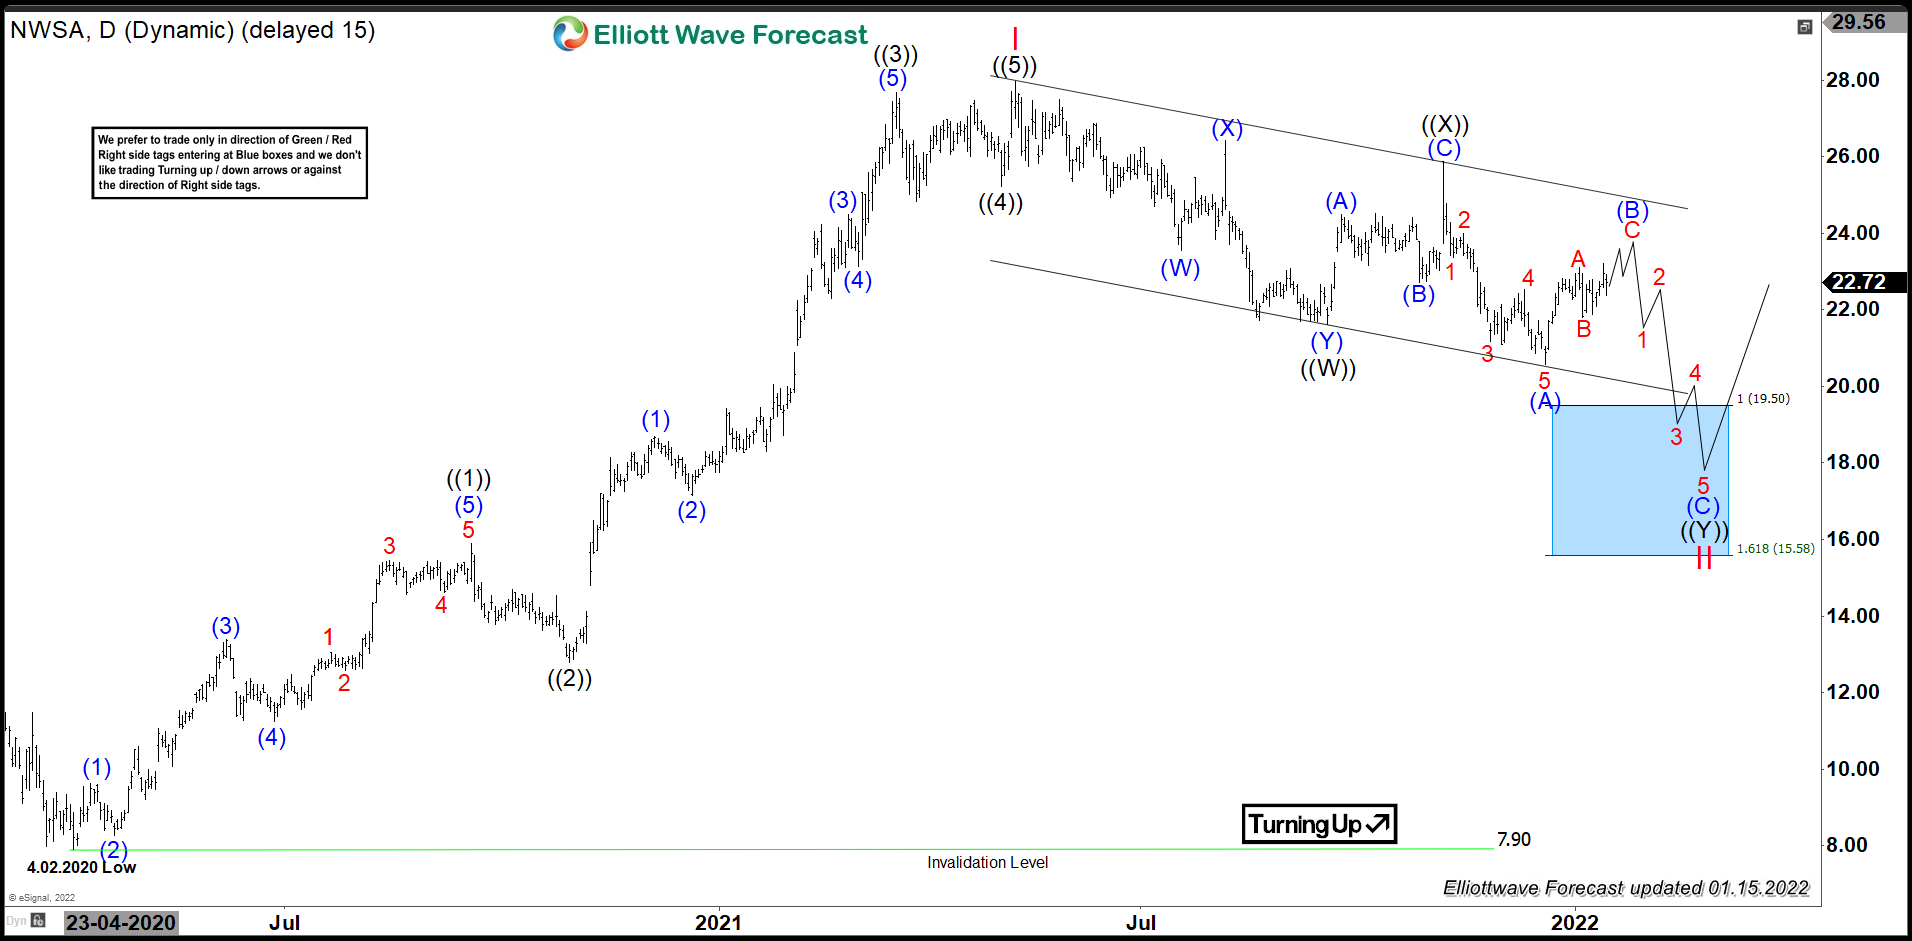
News Corporation (NWSA) is a Media & Information Services company focuses on creating & distributing content worldwide. It operates in different segments like Digital estate services, subscription-based video services, Dow Jones services, book publishing, news media & others. It trades under NWSA ticker at Nasdaq & comes under Communication services sector.
Since 2013 in daily, NWSA made ATL at $7.90 on 4/02/2020 during global sell-off. Thereafter it made higher high sequence, which favored ended as I on 5/10/2021 high shown in previous blog as possible alt view. Actually, it bounced in 3 swings higher as ((X)) started from $21.61 low of ((W)), which failed to make new high & breaks the low, calls for double correction lower in ((Y)) of II.
NWSA - Elliott Wave View from 10/19/2021:
It favored ended ((1)) at $15.90 high of 9/18/2020 in the cycle started from 4/02/2020 low. Below there it placed ((2)) at $12.79 low on 10/29/2020 as 0.382 retracement against previous cycle. It favored ended ((3)) at $27.68 high on 3/19/2021 & placed ((4)) at $25.22 low as shallow correction. Finally, it ended ((5)) barely as new high at $27.97 on 5/10/2021 & started correcting lower against the cycle from April-2020 low. It expects to do double correction lower towards $19.50 - $15.56 area before it resumes the next leg higher.
NWSA - Elliott Wave Latest Daily View:
Below $27.97 high of I, it favored ended ((W)) at $21.61 low & ((X)) at $25.86 high on 5/11/2021. It placed (A) at $21.09 low & favors higher in (B) as expanded flat correction. While bounce fails below $25.86 high, it expect to extend lower in (C) of ((Y)) towards equal leg area $19.50 - $15.56. When it finished II in equal leg area, it expect to find support there for next leg higher or at least 3 swing bounce.
NWSA - Alternate Elliott Wave View:
Alternatively, it is possible that (A) ended at $20.58 low & currently favors higher in (B), which expect two more highs before turning lower in (C) of ((Y)) towards equal leg area to end II. In both cases we expect at least one or more highs within (B) wave before it resumes lower.


 Elliott Wave Chart")