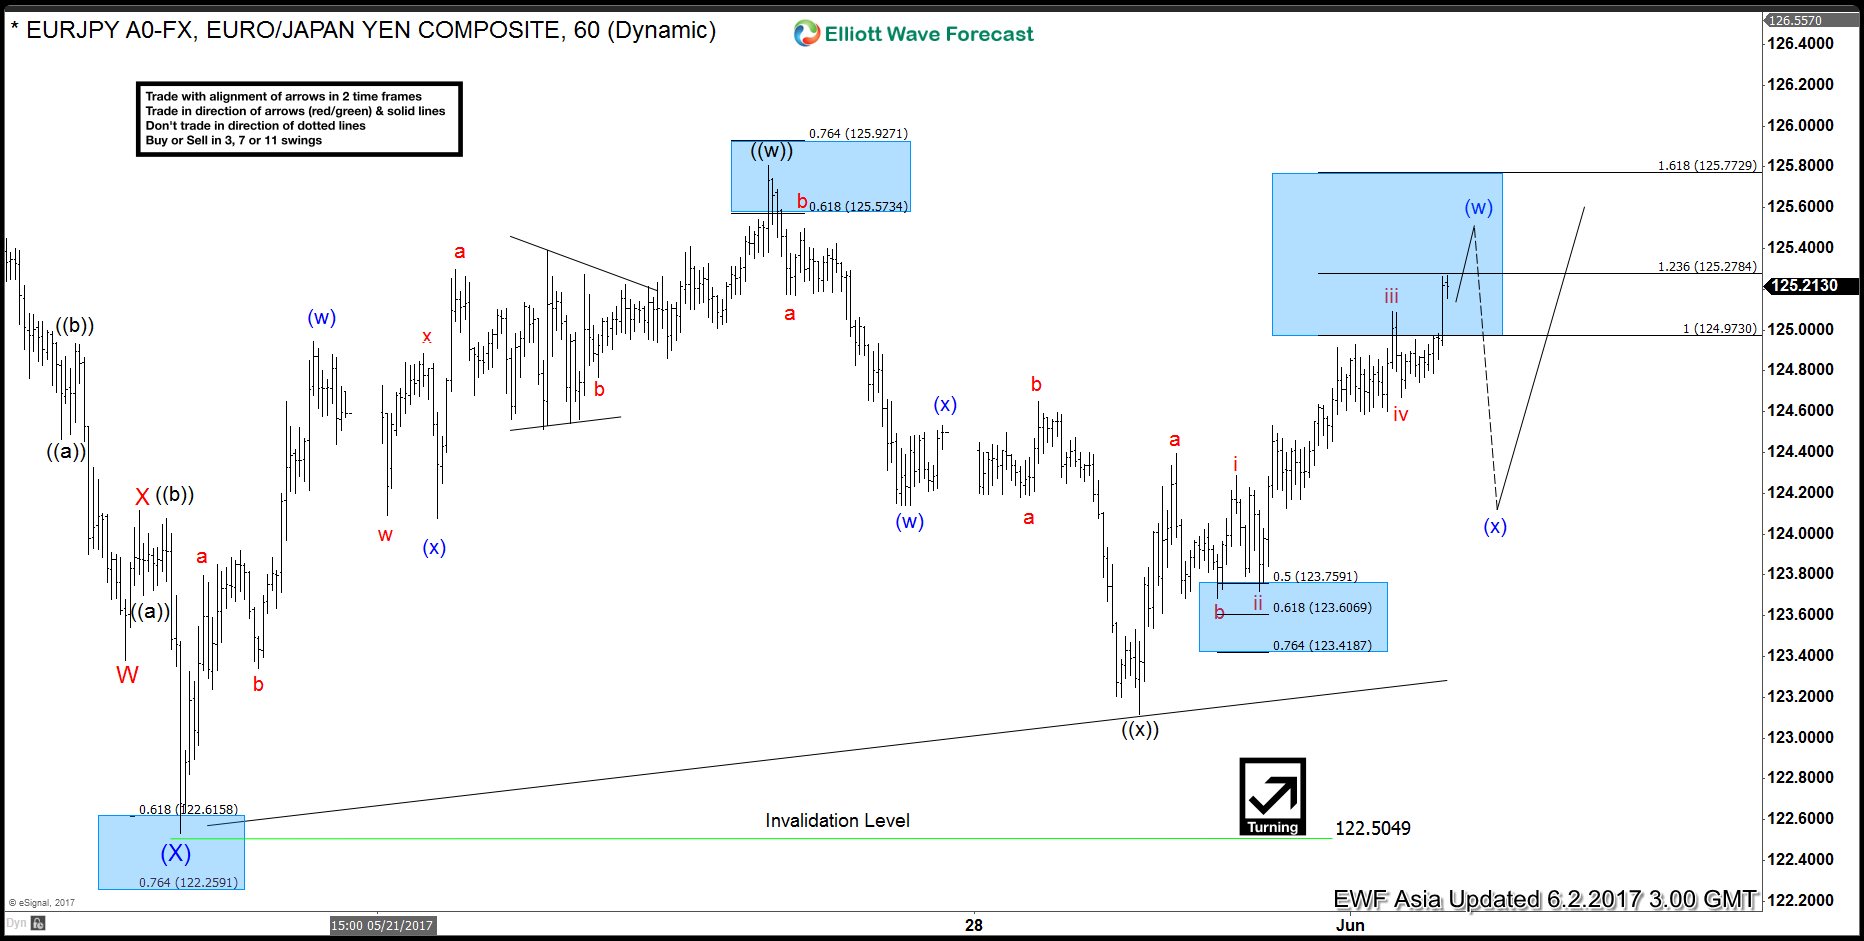
Short Term EURJPY Elliott Wave view suggests the rally from 4/16 low is unfolding as a double three Elliott Wave structure. Up from 4/16 (114.8) low, Intermediate wave (W) ended at 125.81 and Intermediate wave (X) ended at 122.53. A break above 125.81 however is still needed to add conviction that the next leg higher has started.
From 122.53 low, the rally is also unfolding as a double three Elliott Wave structure. Minute wave ((w)) ended at 125.8 and Minute wave ((x)) ended at 123.11. Near term, cycle from 5/30 low (123.11) is mature and expected to end soon. This cycle from 5/30 low is unfolding as a Flat Elliott Wave structure and expected to end with Minutte wave (w) at 125.5 – 125.7 area. Once Minutte wave (w) is over, expect pair to pullback in Minutte wave (x). The pullback should unfold in 3, 7, or 11 swing and while the pullback stays above 123.11, pair should extend higher. If pair breaks below 123.11, then pair is likely doing a double correction from 5/16 peak. This suggests pair can open extension lower to 121.6 – 122.25 area in case of a double correction. From this area, buyers should appear again for an extension higher or at least a 3 waves bounce. We do not like selling the proposed move to the downside and expect dips to find buyers in 3, 7, or 11 swing.
Ethereum is an open-source blockchain-based distributed computing platform featuring smart contract functionality. It provides a decentralized Turing-complete virtual machine, the Ethereum Virtual Machine (EVM), which can execute scripts using an international network of public nodes. Ethereum also provides a crypto-currency token called “ether”, which can be transferred between accounts and used to compensate participant nodes for computations performed.
Ethereum went live in 2015, it quickly gained attraction in the digital world and it’s currently the second largest Crypto-Currency with 20 Billion Dollar in market cap surpassing Ripple (11 Billion) and sitting behind the Bitcoin (39 Billion). Since the start of 2017 , all the digital currencies doubled its value after after prices kept rising higher in the recent months and buyers all over the world jumping in to take a piece of the rally.
Looking at the some daily charts of the digital coins, you’ll probably see a parabolic curve to the upside which may seems hard to catch any trade. However using our swing sequences and following the trend which is clearly bullish as the instrument keeps making higher highs then buying the pullbacks in 3 , 7 or 11 swing was the right way to catch every dip during the recent rally.
Let’s take a look at the lower time frame chart of Ethereum and Bitcoin and explore the potential scenarios.
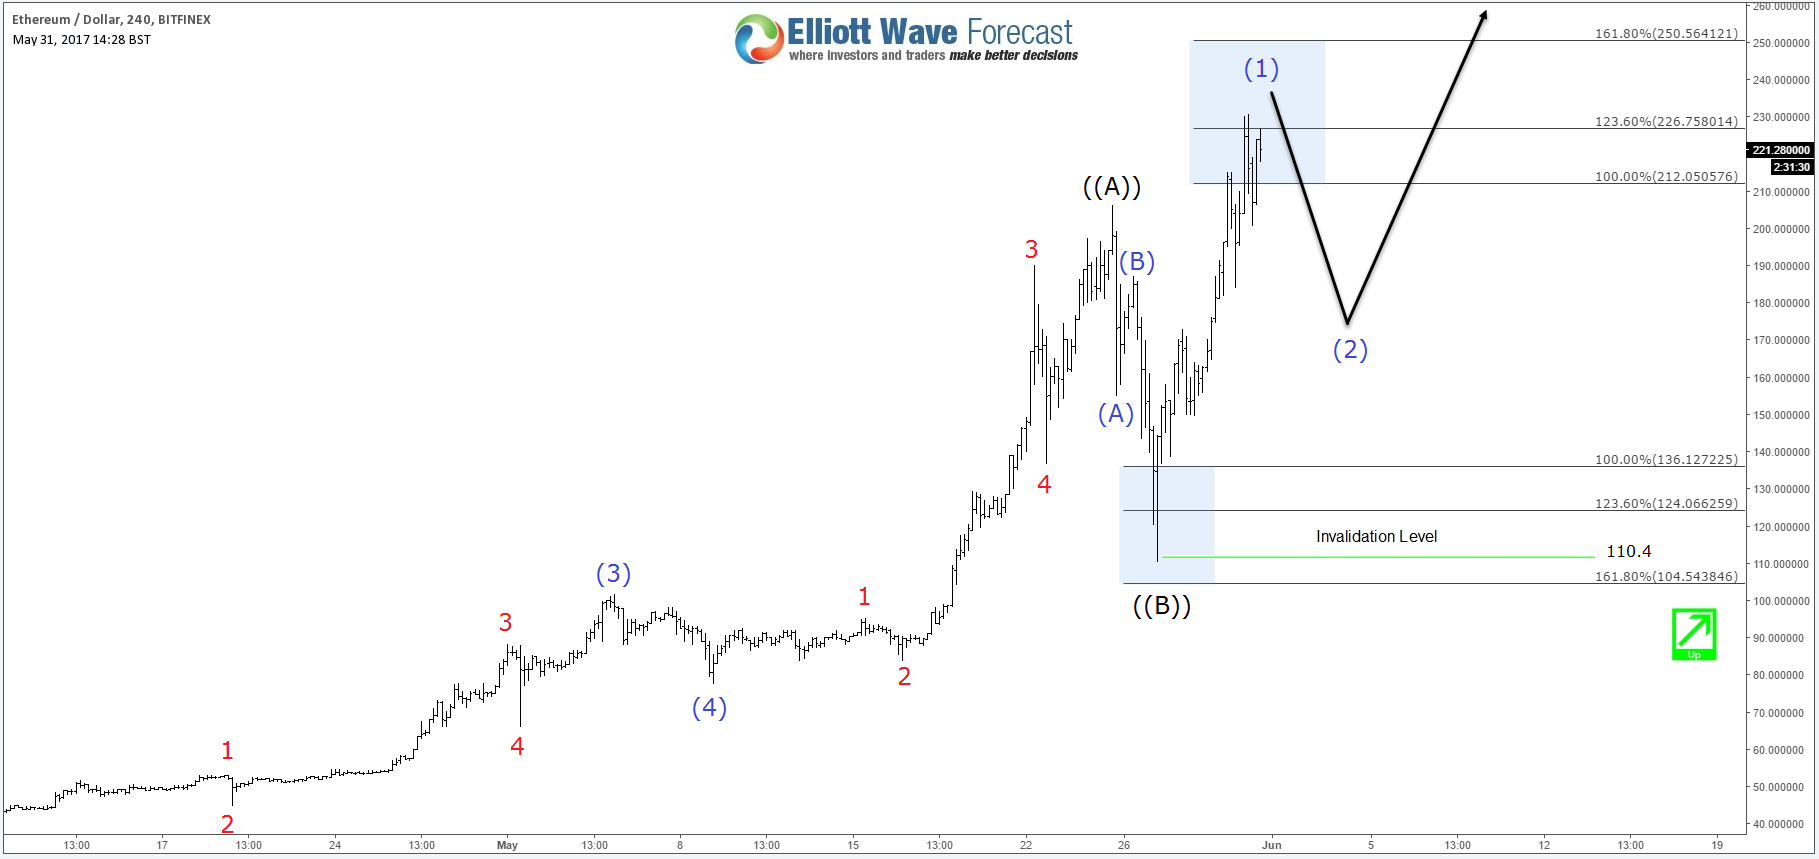
Ethereum: ETHUSD 4H Chart 05/31/2017
Ethereum saw a 50% decline from 05/25/2017 peak which may caused a lot of fear around the market, but looking at the technical picture the correction came after a 5 waves move from the lows and that why it was another great opportunity to buy ETHUSD after 3 waves zigzag pullback into the equal legs area 136 – 104. The instrument already rallied from the inflection area and managed to make a new all time highs opening a new extension to the upside toward ideally 315 – 365 area. In the shorter term, a pullback from 225 – 250 can be seen against 110 low but it can be just a shallow 3 waves pullback before Ethereum resumes the rally again as it has an incomplete bullish sequence.
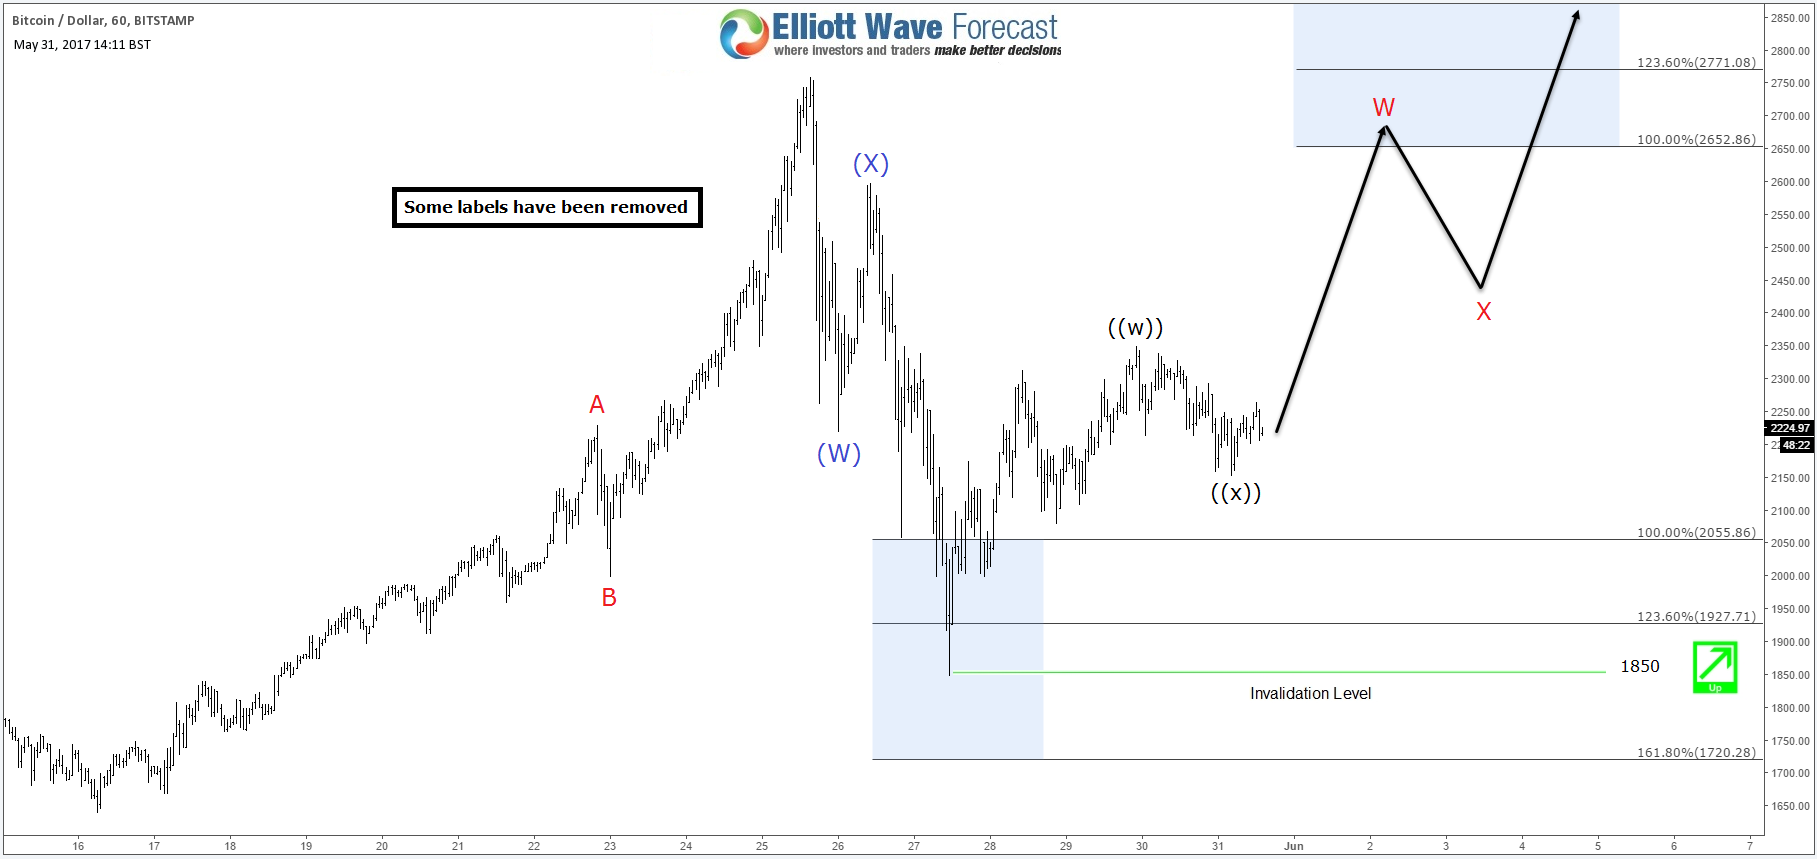
BITCOIN: BTCUSD 1H Chart 05/31/2017
The same thing happened for Bitcoin which saw a 65% correction from 05/25 peak which unfolded as a double three structure and managed to finish the 7th swing around the equal legs area 2055 – 1720. The reaction from that area wasn’t strong enough to break to new high like the case of Ethereum but BTCUSD created a short term incomplete bullish sequence from 05/27 low which could take it toward equal legs area 2652 – 2771 before another pullback is seen. Bitcoin still needs to break the previous peak to open a new extension highs that can take it another $1000 higher. However if it fails to make new highs then there is still the possibility for a double correction which will represent another opportunity to buy it again.
Recap
Ethereum is the one leading the move for the rest of crypto-currencies as ETHUSD already made new all time highs and opened the door for another leg to the upside, which means Bitcoin should ideally follow the same path even it’s currently still lagging the equivalent move.
Buying crypto-currencies is the hot theme for 2017, investors has already added different types of digital coins to their portfolio and traders are trying to catch the long side of the rally. However there is huge volatility with these kind of instrument which causes sharp declines in few hours that can trick short term traders and may cause a lot of problem. That’s why unless you are owning these crypto-currencies from lower levels and looking to hold it for a long time then it’s better to pay attention to the market structure and learn how identify the right sequence and cycle to allow you to buy it the right area to protect you trade after the first reaction.
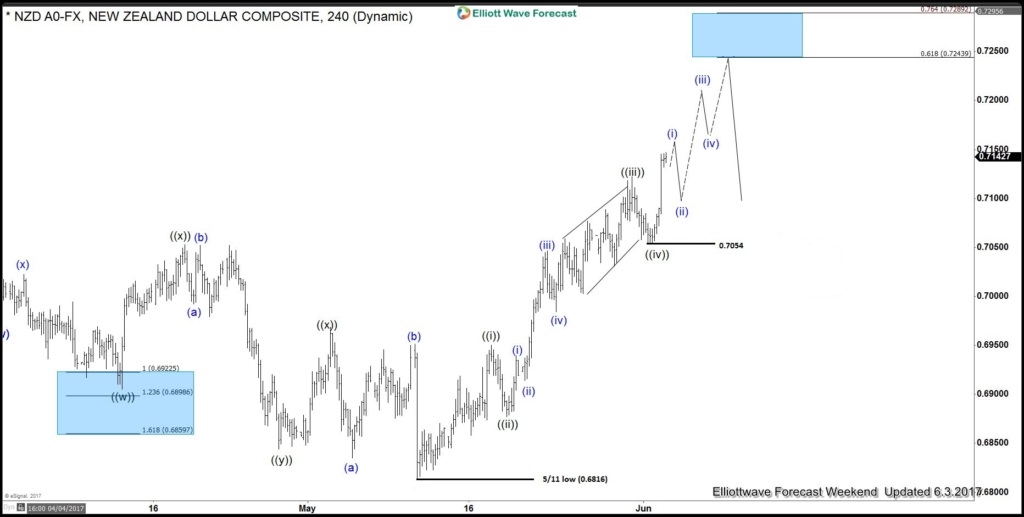
Short term Elliott wave view in NZDUSD suggest that the cycle from 5/11 low (0.6816) is unfolding as an impulsive Elliott wave structure . This 5 wave move could be a wave C of a FLAT correction or wave A of an Elliott wave zigzag structure structure. In either case, after 5 wave move ends, pair should pull back in 3 waves at least as the Elliott Wave Theory suggests. The Minute wave ((i)) ended at (0.6948), Minute wave ((ii)) pullback ended at (0.6880), Minute wave ((iii)) at 0.7121 peak, Minute wave ((iv)) pullback ended at (0.7054) low. Above from there Minute wave ((v)) of C or A already reached the minimum extension area in between inverse 1.236-1.618% extension area of previous wave ((iv)) already at 0.7135-0.7161 area. Which means cycle from 5/11 low (0.6816) is mature and pair can start the 3 waves pullback at any moment.
However as far as dip remains above wave ((iv)) dip (0.7054) & more importantly while the Rsi divergence at the peak stays intact pair may see further advance towards ((v))=((i)) target area at 0.7186-0.7217 area or in case of further strength pair may see 0.618-0.764% fibonacci Extension area of wave ((i))+((iii)) at 0.7243-0.7289 before ending the 5 waves impulse sequence from 5/11 low. Afterwards pair should pullback in 3, 7 or 11 swings for the correction of 5/11 cycle or If the decline turns out to be stronger than expected and breaks the pivot at 5/11 low (0.6816) then that would suggest 5 wave move up from 0.6816 low was part of a wave C of a FLAT from 3/09 (0.6889) low and pair may resume lower.
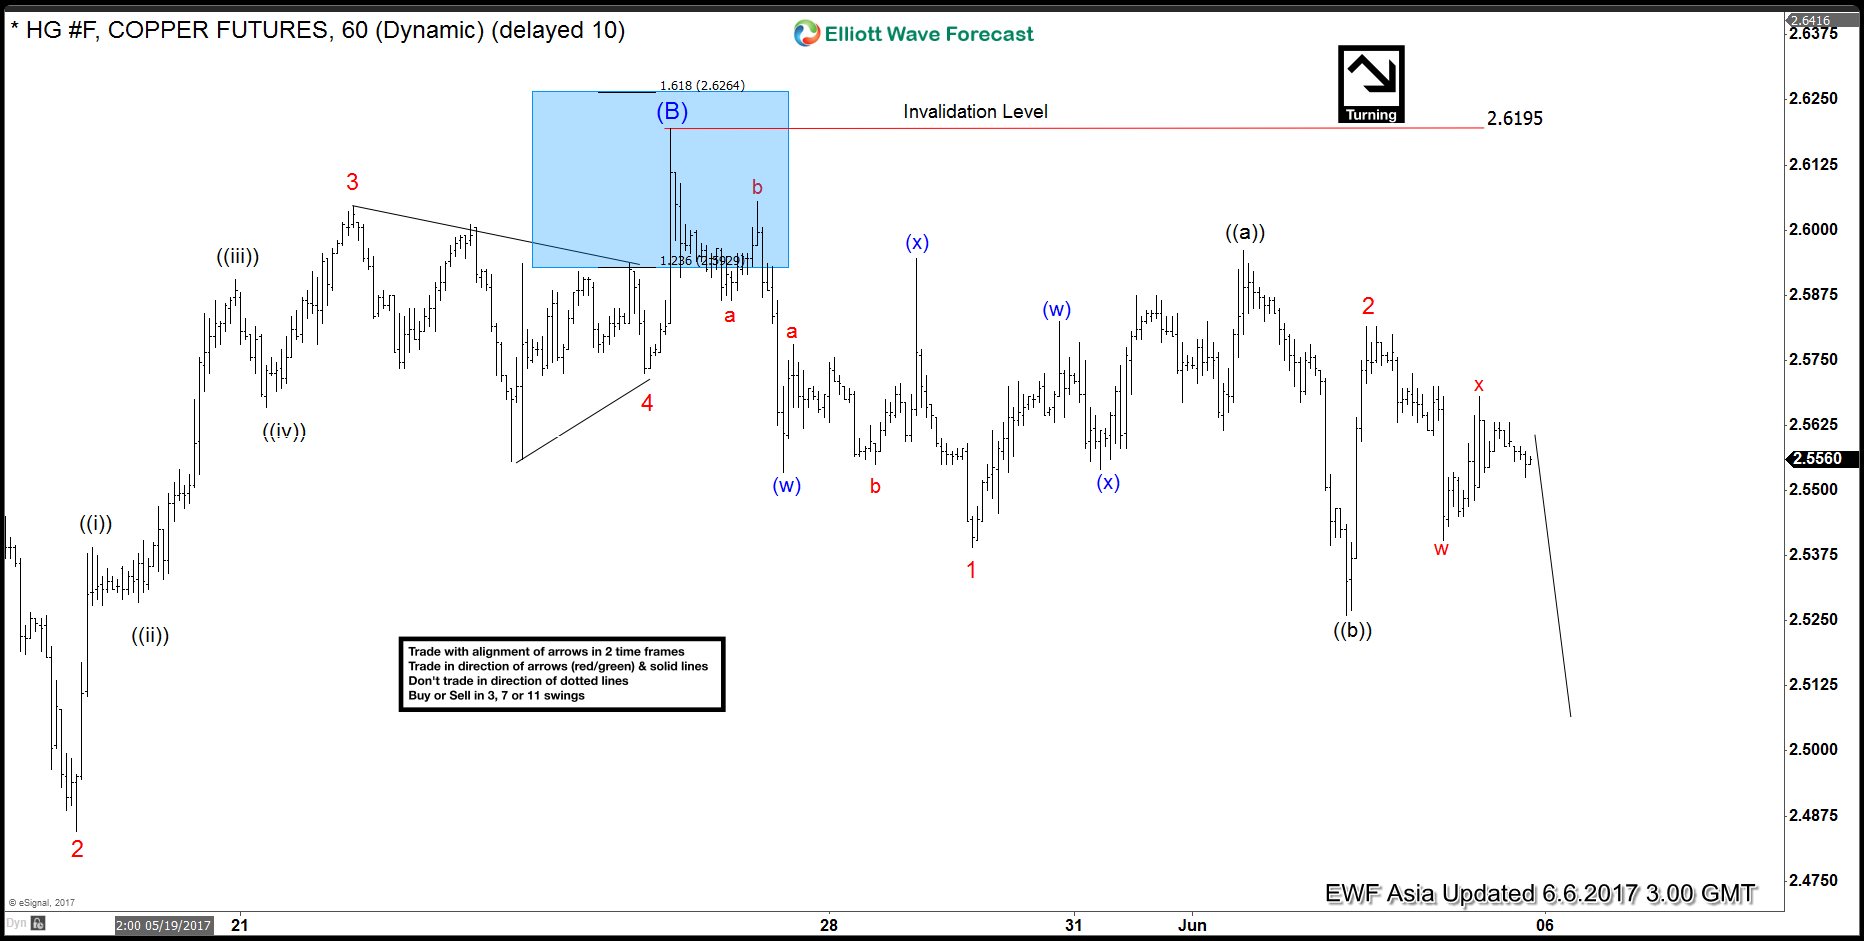
HG#F (Copper) is showing 5 swings incomplete sequence from 2/13/2017 high, preferred Elliott wave view suggests rally to 2.619 completed 6th swing as a FLAT in wave (B) and metal has now resumed the decline in 7th swing. Decline from 2.619 is so far corrective so wave (C) is expected to take the form of an Ending diagonal where wave 1 ended at 2.539 and wave 2 ended at 2.581 as a FLAT. Near-term focus is on 2.526 – 2.500 area to complete 3 waves from wave 2 peak, this area can result in a bounce in 3 waves again which should fail below 2.581 high and more importantly below 2.619 high for extension lower towards 2.376 – 2.2716 area to complete 7 swings from 2/13/2017 high.
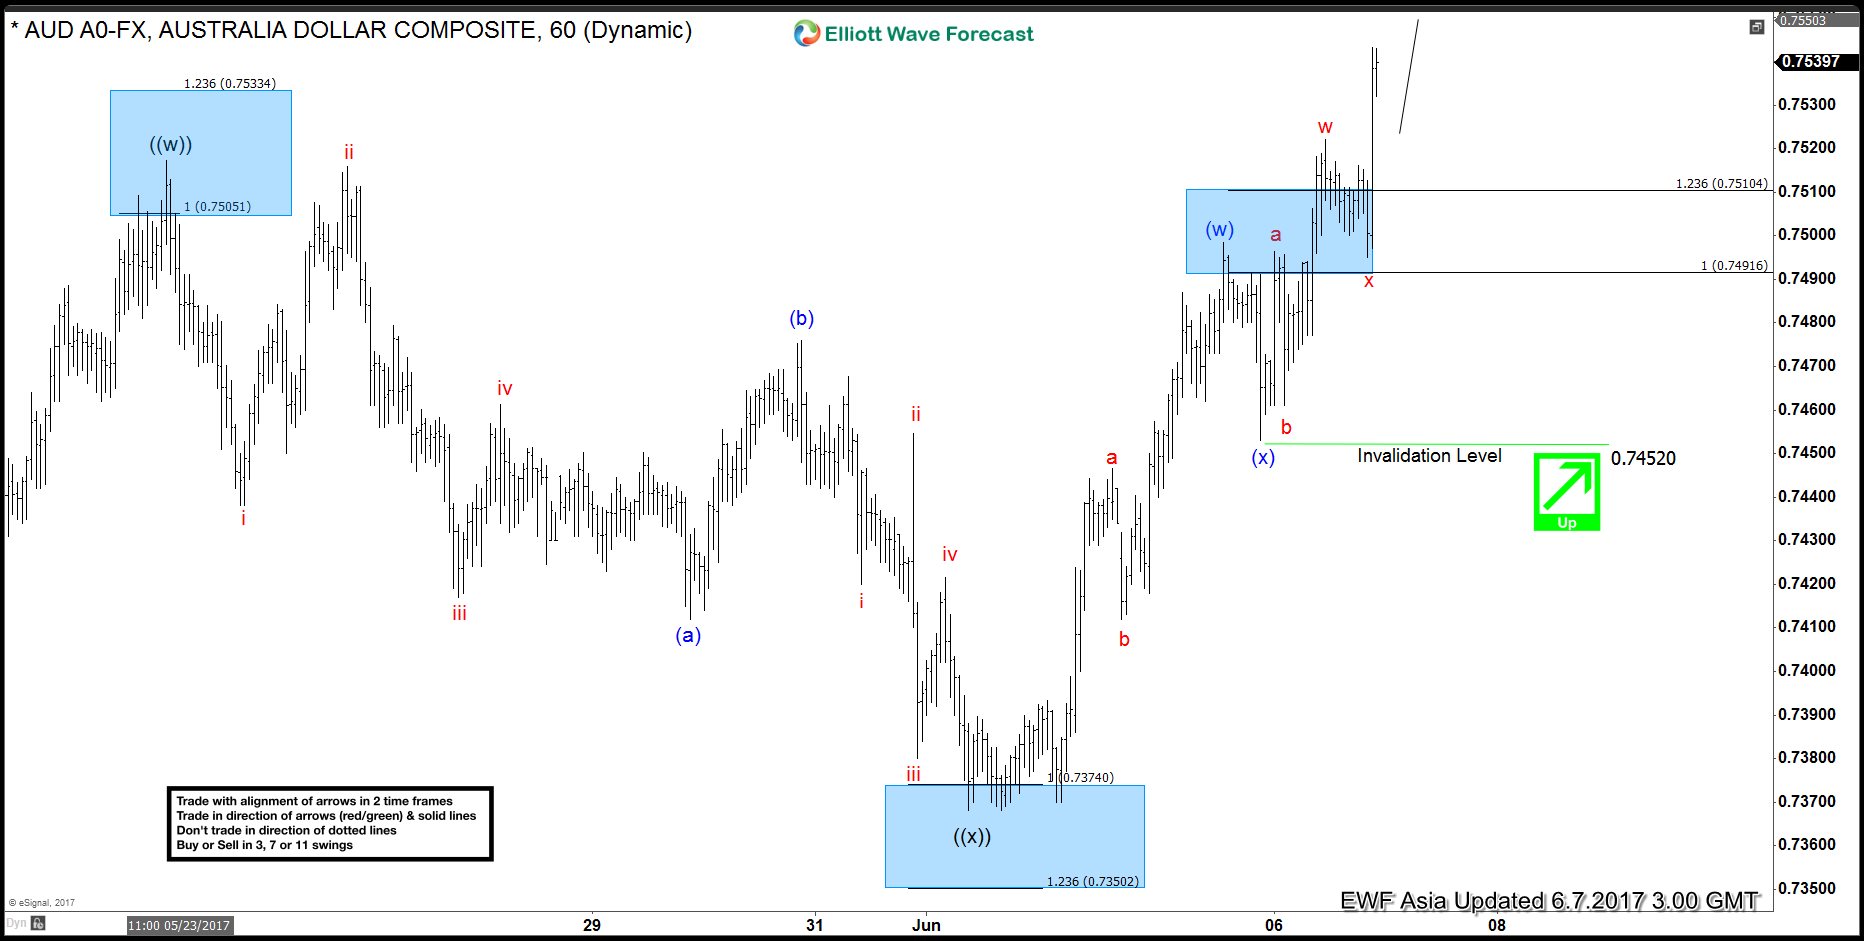
Short Term Elliott Wave view in AUDUSD suggests the rally from 5/9 low is unfolding as a double three Elliott Wave structure. Up from 5/9 (0.7325) low, Minute wave ((w)) ended at 0.7517 and Minute wave ((x)) ended at 0.7368. Pair has since broken above 0.7517, adding validity that the next leg higher has started.
From 0.7368 low, the rally is also unfolding as a double three Elliott Wave structure. Minutte wave (w) ended at 0.7498 and Minutte wave (x) ended at 0.7453. Near term, while pullbacks stay above 0.7452, but more importantly as far as pivot at 0.7368 stays intact, expect pair to extend higher towards 0.756 – 0.7607 area to end cycle from 5/9 low. We don’t like selling the pair and expect buyers to appear in any dips in 3, 7, or 11 swing provided that pivot at 0.7368 remains intact.
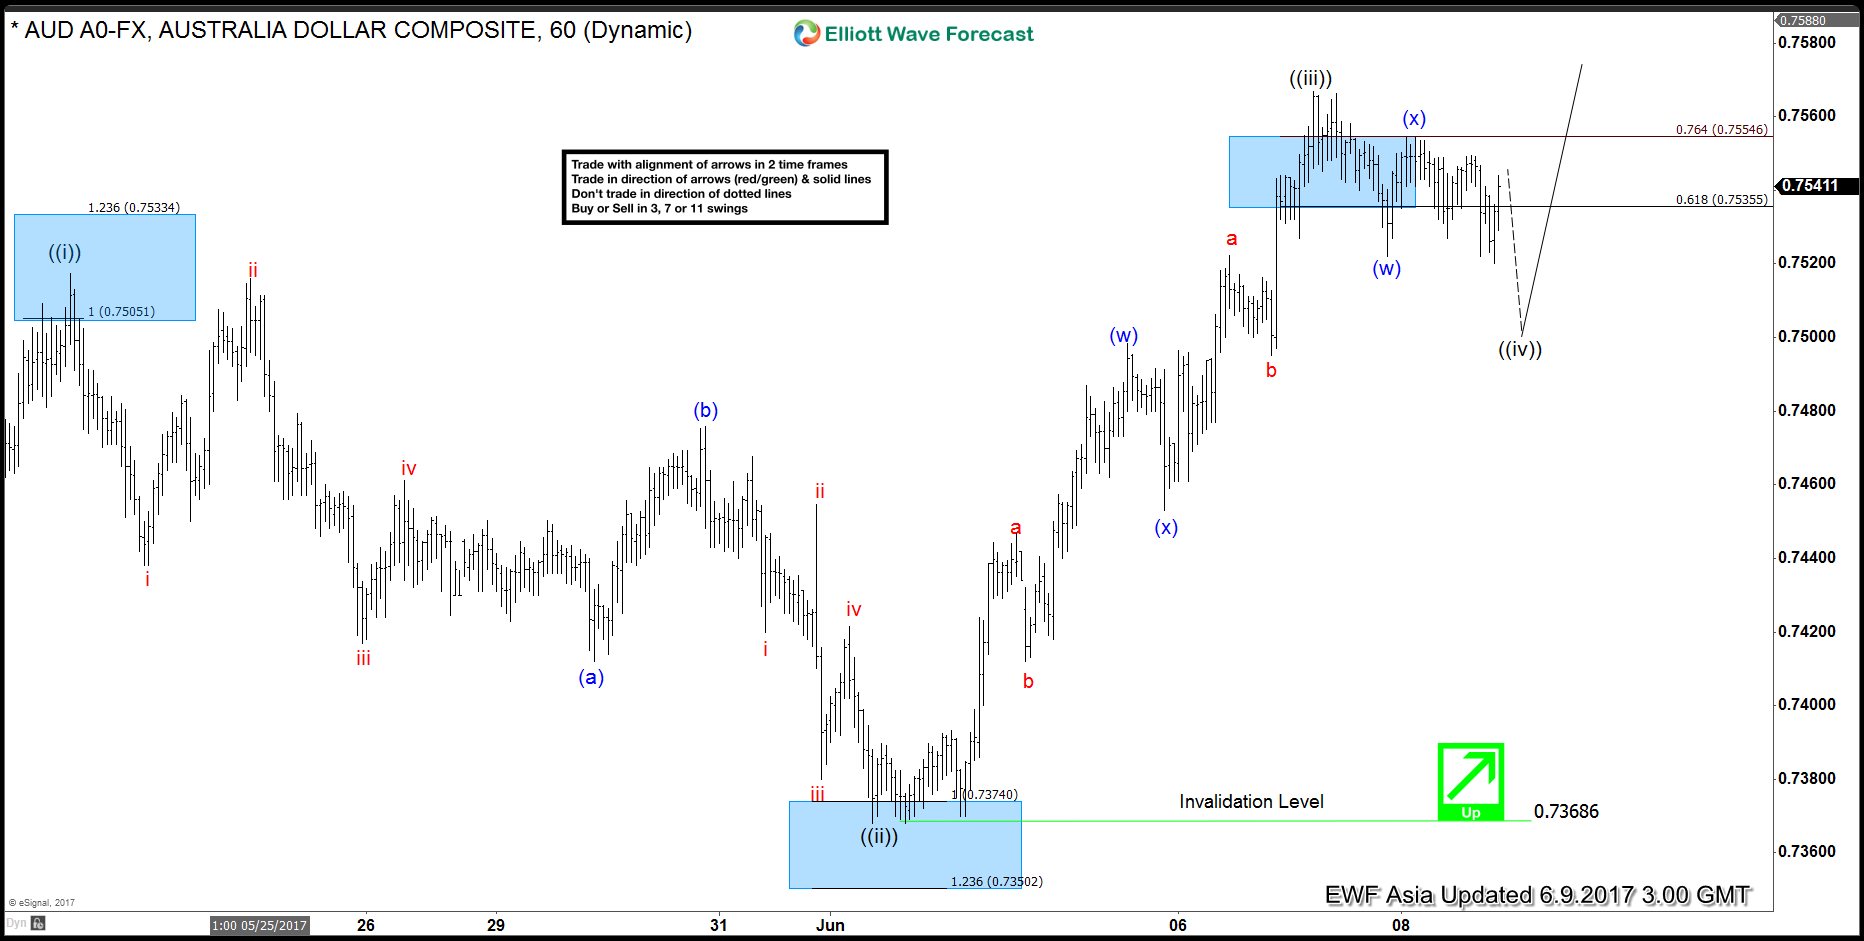
Revised short term AUDUSD Elliott Wave view suggests the rally from 5/9 low is unfolding as a leading diagonal Elliott Wave structure. Up from 5/9 (0.7325) low, Minute wave ((i)) ended at 0.7517, Minute wave ((ii)) ended at 0.7368, and Minute wave ((iii)) ended at 0.7566. Minute wave ((iv)) pullback is currently in progress to correct cycle from 6/1 low in 3, 7, or 11 swing before pair resumes higher again.
Pair has currently reached 100% from 5/9 low thus cycle from 5/9 low is mature and may end soon. However, pair still has scope to extend one more leg higher in Minute wave ((v)) as far as pivot at 6/1 low (0.7368) stays intact before ending cycle from 5/9 low as a leading diagonal. As cycle from 5/9 low has reached 100%, it’s not a good idea to chase strength at this stage. We don’t like selling the pair either as higher degree trend is bullish and expect pair to correct cycle from 5/9 low in 3, 7, or 11 swing after it completes one more leg higher in Minute wave ((v)).
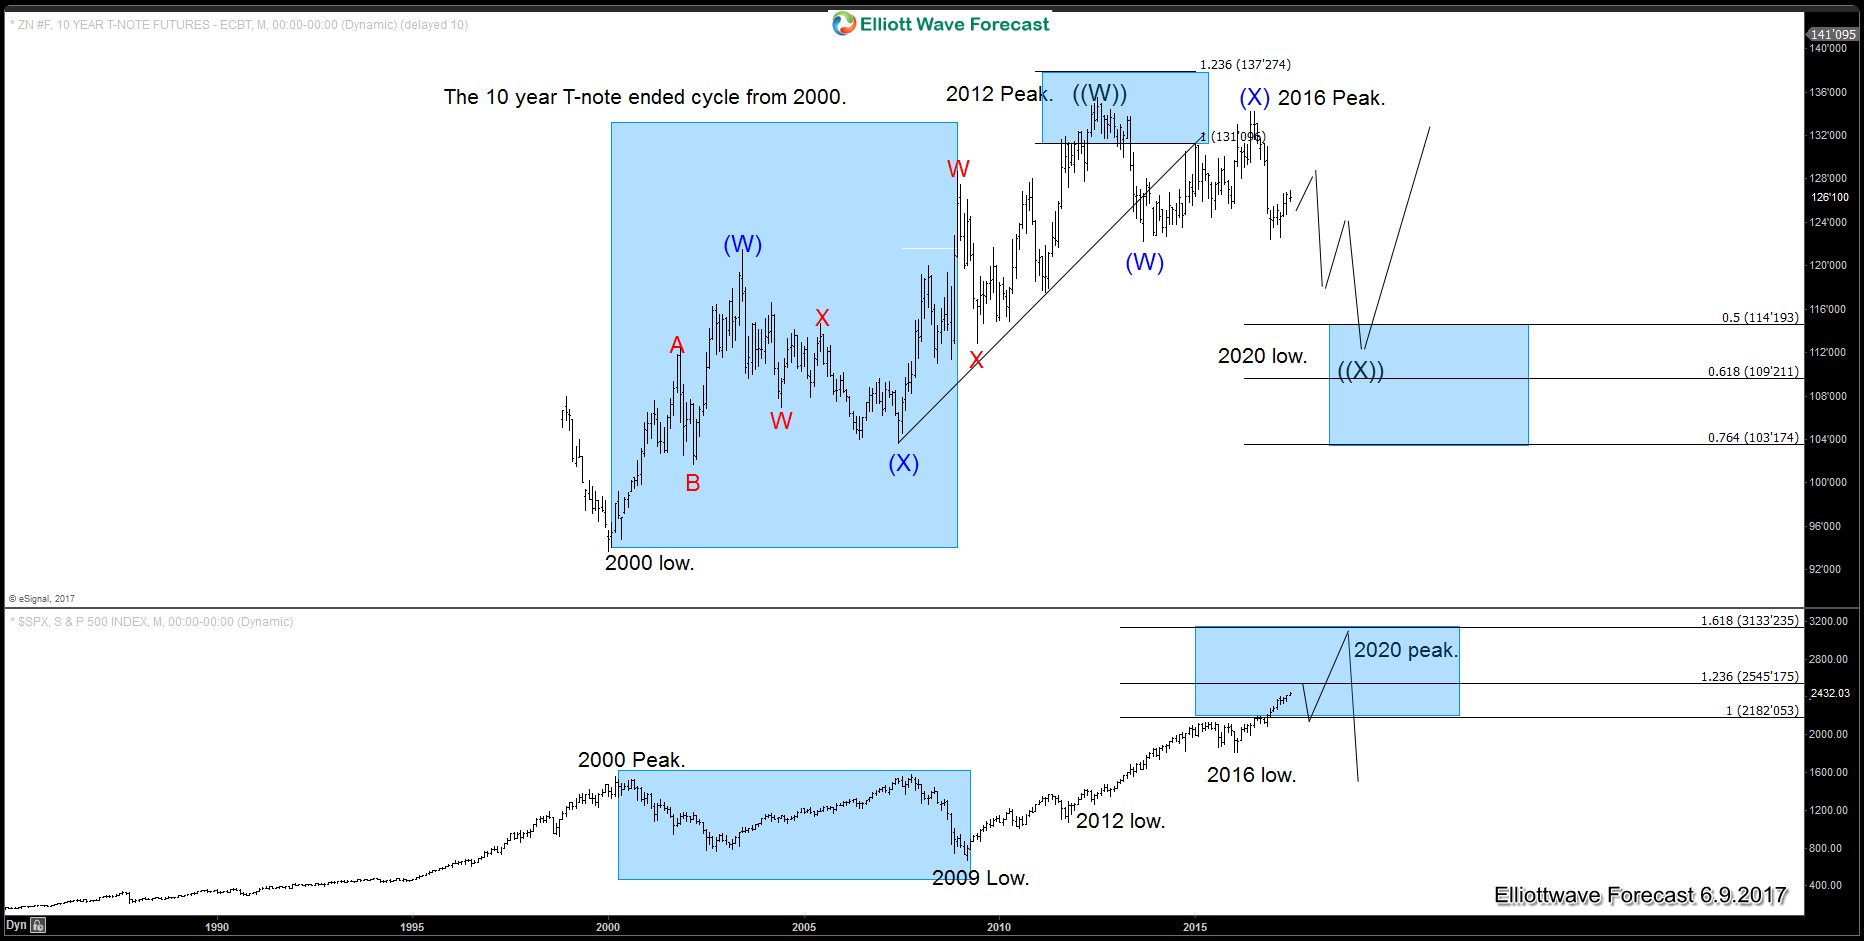
Many traders around the World keep picking the top in Indices and fail to capitalise on the trend which is to the upside. Recently, we did a blog to explain World Indices could see another huge peak around 2020 – 2022, of course there would be corrections in between but they should offer nothing more than a buying opportunity in the sequence of 3, 7 or 11 swings. Advantage of trading with technique is that even when the trend is extreme, you are trading with a defined risk and get a chance to eliminate risk on the trade as the market bounces from extreme areas after 3 swings, 7 swings or 11 swings. In this video we explain the relationship between ZN (10 Year Treasury Note) and SPX.
ZN (10 Year Treasure Note) and SPX Overlay
Above chart shows ZN (10 Year Treasury Note) has ended the cycle from 2007 low and most likely from 2000 low as well and as far as bounces fail below 2016 and more importantly below 2012 peak, 10 year note prices can drop towards 117 – 114.19 area to finish correcting 2000 cycle and then turn higher again for another monthly cycle or make a larger 3 waves bounce at least. We can see in the above chart that 10 year note formed a peak in 2012 and dropped and SPX rallied. Then we saw another secondary peak in 10 year note in 2016 which was a low in SPX and caused another rally. While below 2016 peak, 10 year note prices should drop further and that should cause SPX rally to extend and it could reach as high as 3133 area by the year 2020 – 22. Therefore, we don’t like picking the tops in Indices and expect buyers to appear in the dips after 3, 7 or 11 swings. When 10 year note prices reach 117 – 114.19 area, Indices would have a chance to form a huge peak and start a larger pull back and that should be a good time to buy 10 year T-note.
The pound sterling was headed for the biggest drop in a year after it emerged that the ruling Conservative Party has fallen short of a general majority after UK Election (GE 2017), just 10 days before the Brexit talks are scheduled to begin. The currency collapsed in front of all its main counterparts, since the supporters of Theresa May felt to lose the objective of 326 seats necessary to form a majority government, contrary to what many probes predicted and the market expected. Pound against US dollar hits the lowest levels since April after the first exit poll on Thursday predicted the Tories winning just 314 seats.
The Pound slides more then 2 percent against US dollar after touching $ 1.2636 at the London open on Friday. Which is the lowest level since April 18, the Theresa May day called the sudden election . It dropped to 2.5 percent, set for the biggest drop since the days after the Brexit vote.
GBP tumbled due to a hung parliament after UK Election (GE 2017) ?
We don’t think so. Charts below will prove that we were already expecting weakness in GBP and market was just looking for an excuse to sell GBP against various currencies. It was because GBP was showing incomplete swings sequence against many other currencies or was in areas from where weakness in 3 waves at least was expected in GBP against other currencies. We at Elliottwave-Forecast we follow the technical factors in analysing the market. As everyone knows that Elliott wave theory is suggestive and can provide many scenarios as possible. For years, we have understood that nature and have created a distribution system and other tools to take away subjective nature of the theory and understand the nature of what we call the right side of the market. This combined with sequence of swings (3, 7 or 11 swings), market correlation, money management and picking trades with the right risk / reward, so that it would be profitable even if one person won only 4 out of 10 trades, that will provide the advantage of becoming a successful trader / investor. For us the Elliott wave Theory is only a language to communicate to members but use other tools for forecasting & creating Blue Boxes. These Boxes represents the areas where Sellers/ Buyers agree into a 3 waves move and the safer way to trade.
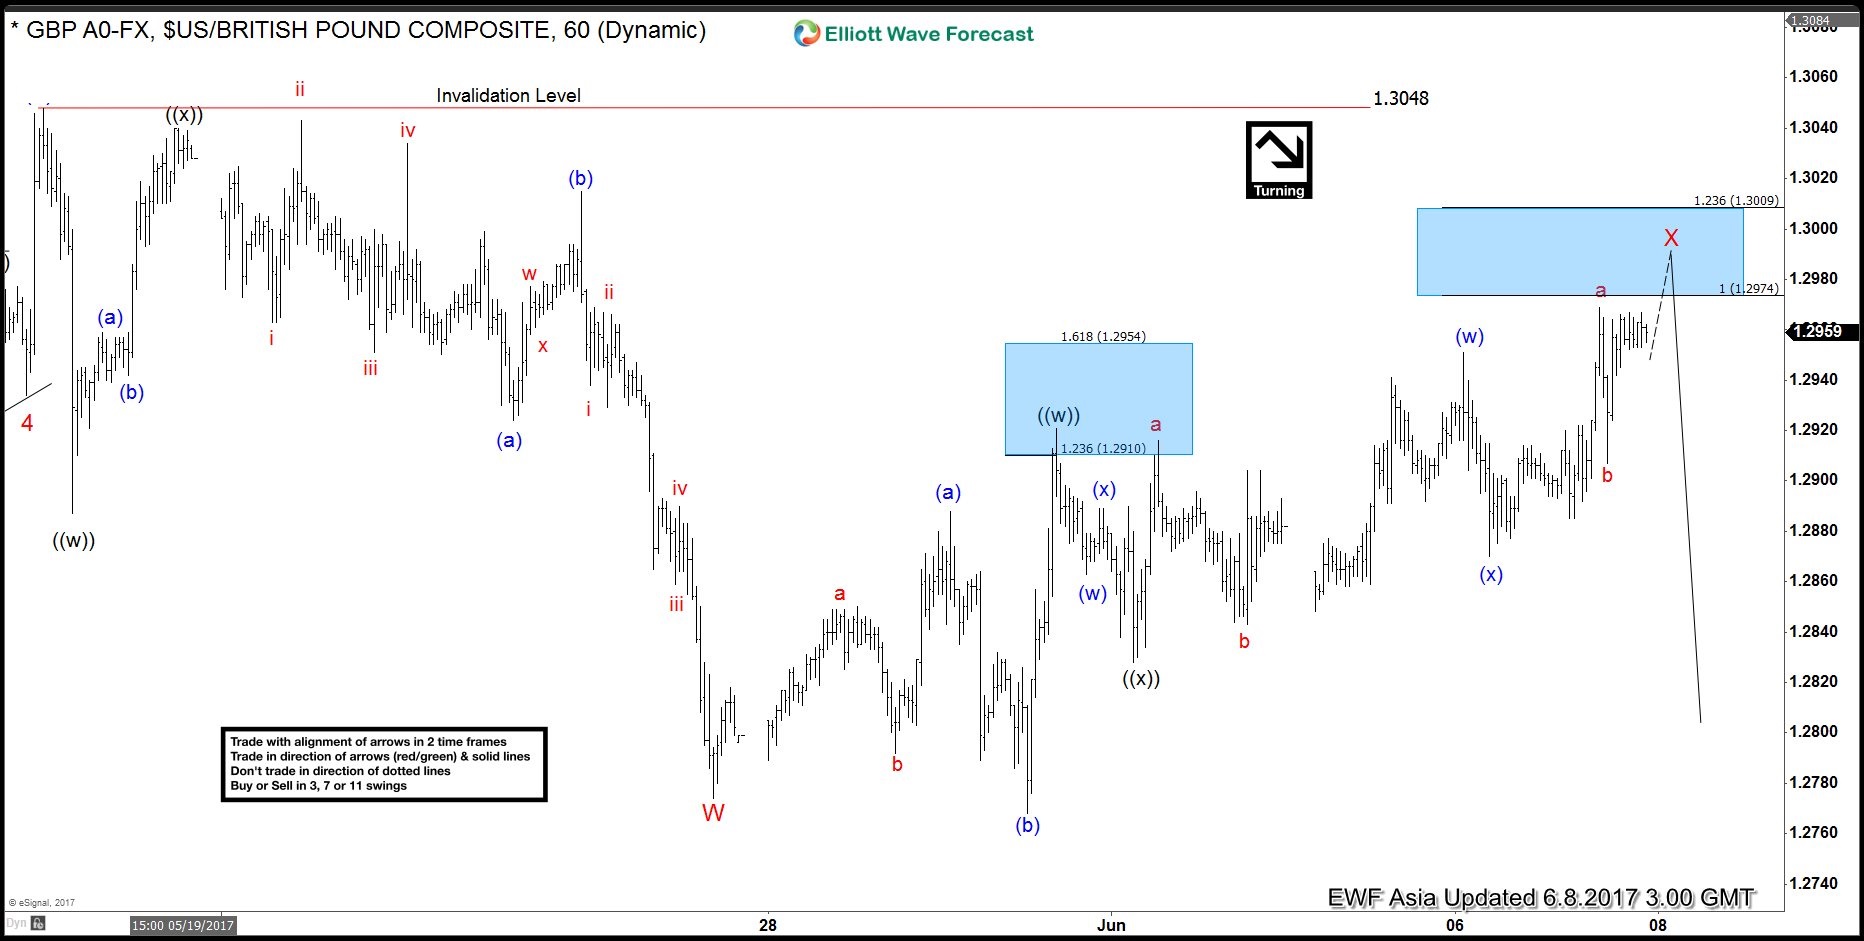
GBPUSD 1 Hour Elliott Wave Chart before UK Election (6.8.2017)
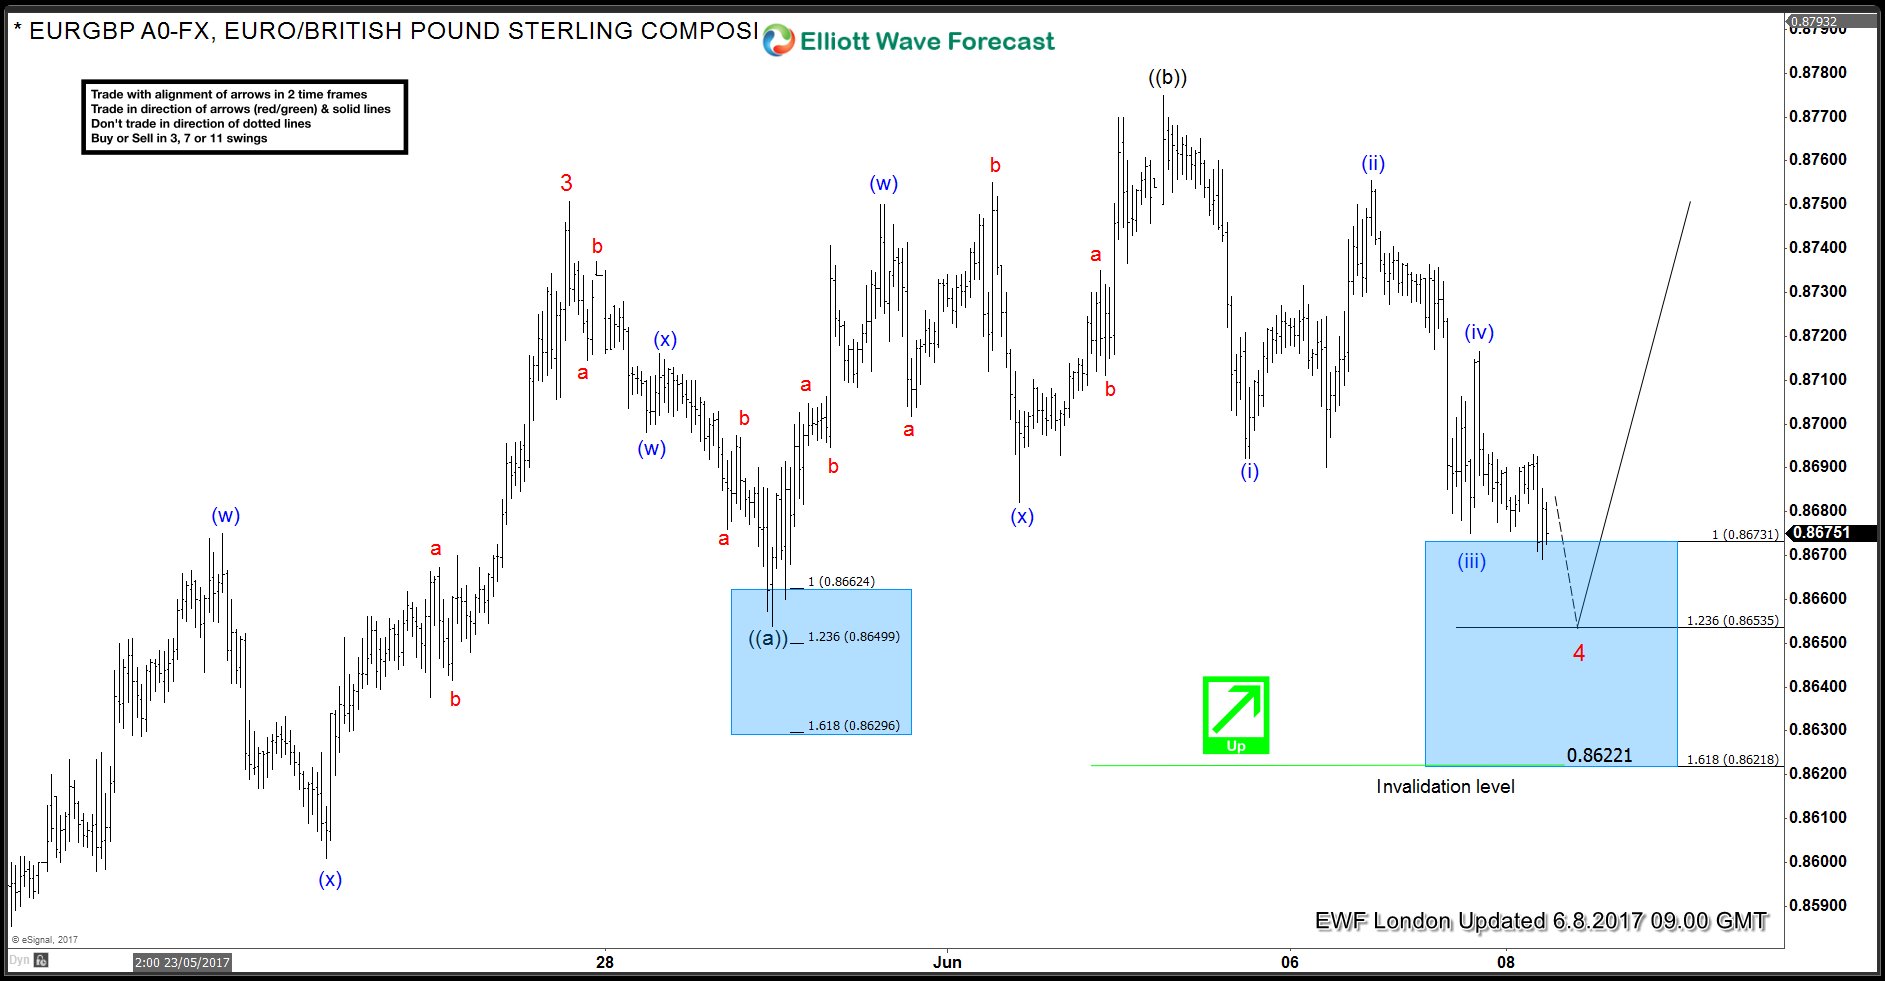
EURGBP 1 Hour Elliott Wave Chart before UK Election (6.8.2017)
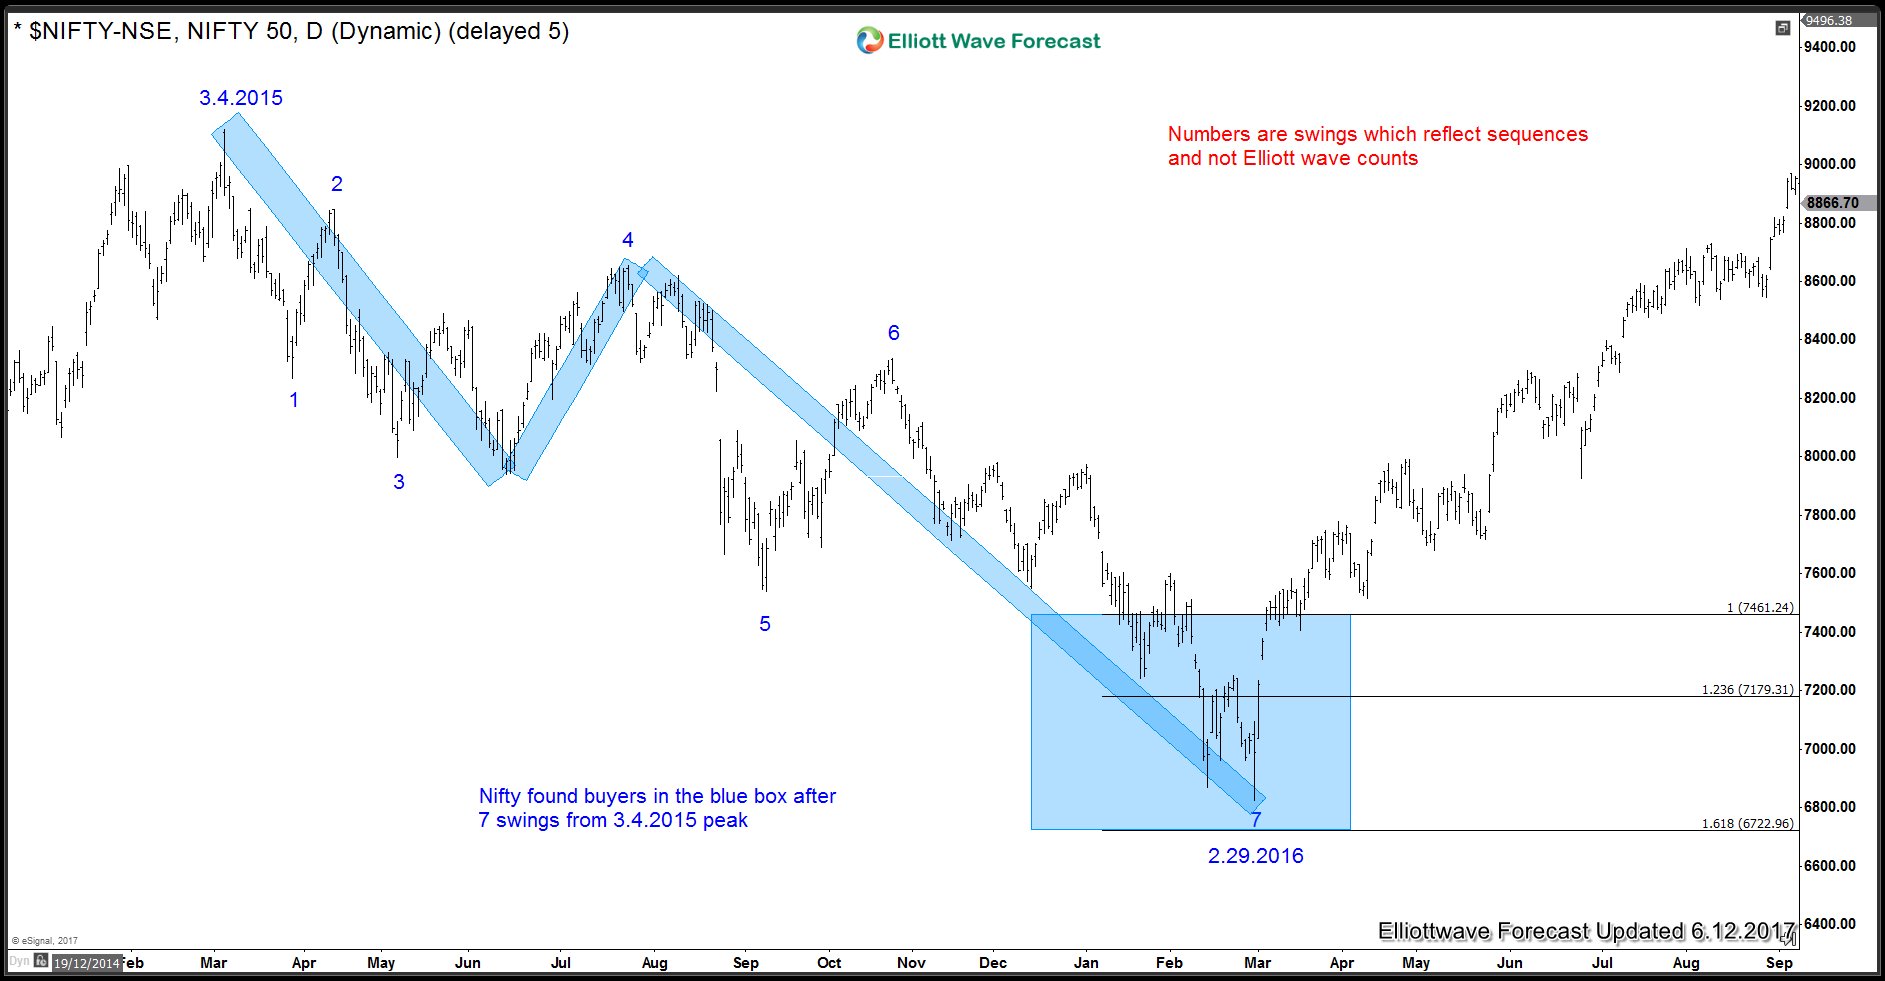
In June 2015, we mentioned that Nifty-NSE from India was in a warning area for the bulls and a larger correction was expected to take place. Over the next 12 months, Nifty lost 25% dropping from a high of 9119.20 on 3.4.2015 to a low of 6825 on 2.29.2016. However, as we keep mentioning World Indices trend remains up and dips are nothing more than buying opportunity in the right areas, so this dip in this Indian Index was another buying opportunity in the blue box between 7459 – 6721.
Nifty-NSE buying area down from 3.4.2015 peak
Index found buyers in the blue box shown on the chart above and rallied. Index has already made a new high above 9119.20 (3.4.2015) and has opened the next bullish extension. Index is currently showing an incomplete Elliott wave sequence up from 2.29.2016 low which calls for dips to find buyers in the sequence of 3, 7 or 11 swings for extension higher.
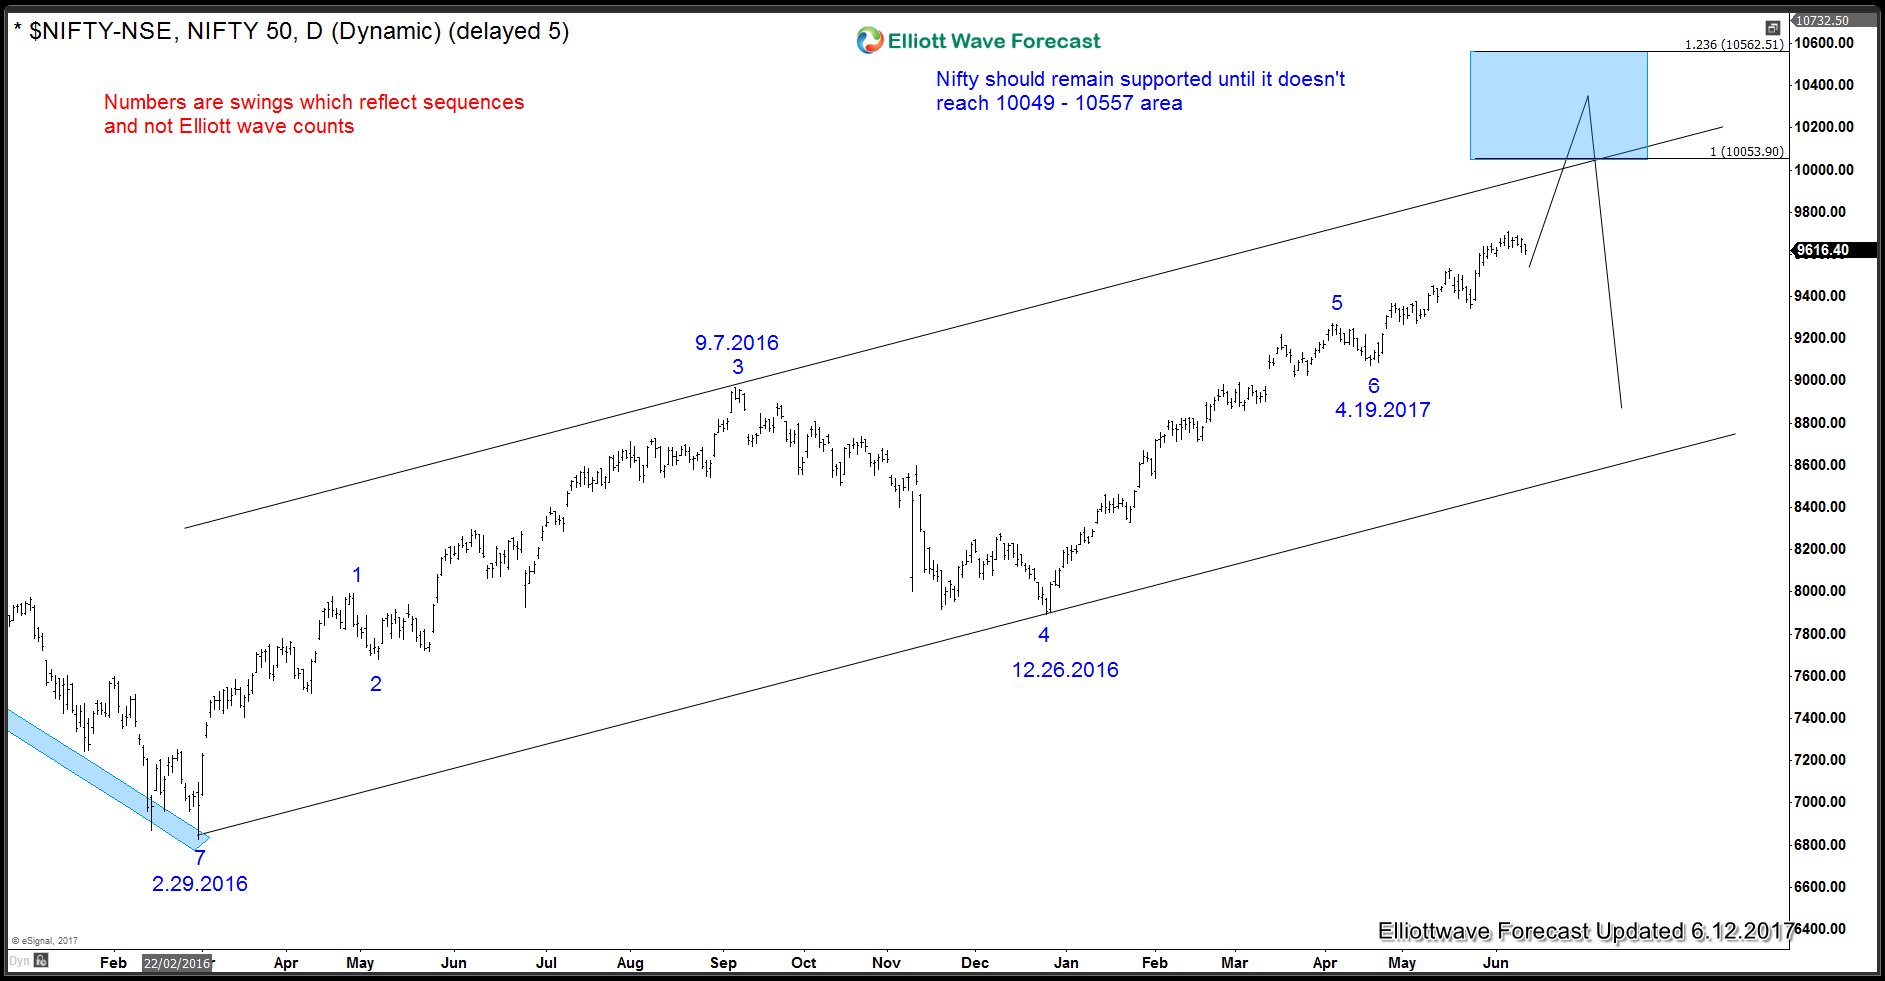
Nifty-NSE 10053 – 100562 is next warning area for bulls
Index is showing an incomplete Elliott wave sequence which means dips should remain supported for more upside. As dips hold above 5.24.2017 low and more importantly above 4.19.2017 low, expect the Index to find buyers in the dips in 3, 7 or 11 swings for extension higher towards 10053 – 10562 area. This area is close to the upper channel line as well and could contain the rally in the Index or at least slow it down. This means bulls should stay in control in rest of the Indices also like $SPX $INDU $FTSE $DAX $NASDAQ and $IBEX etc until Nifty doesn’t reach the above mentioned area. From 10049 – 10557 area, we can see a larger 3 waves pull back in the Nifty to correct the cycle from 2.29.2016 low or at least from 12.26.2016 low.
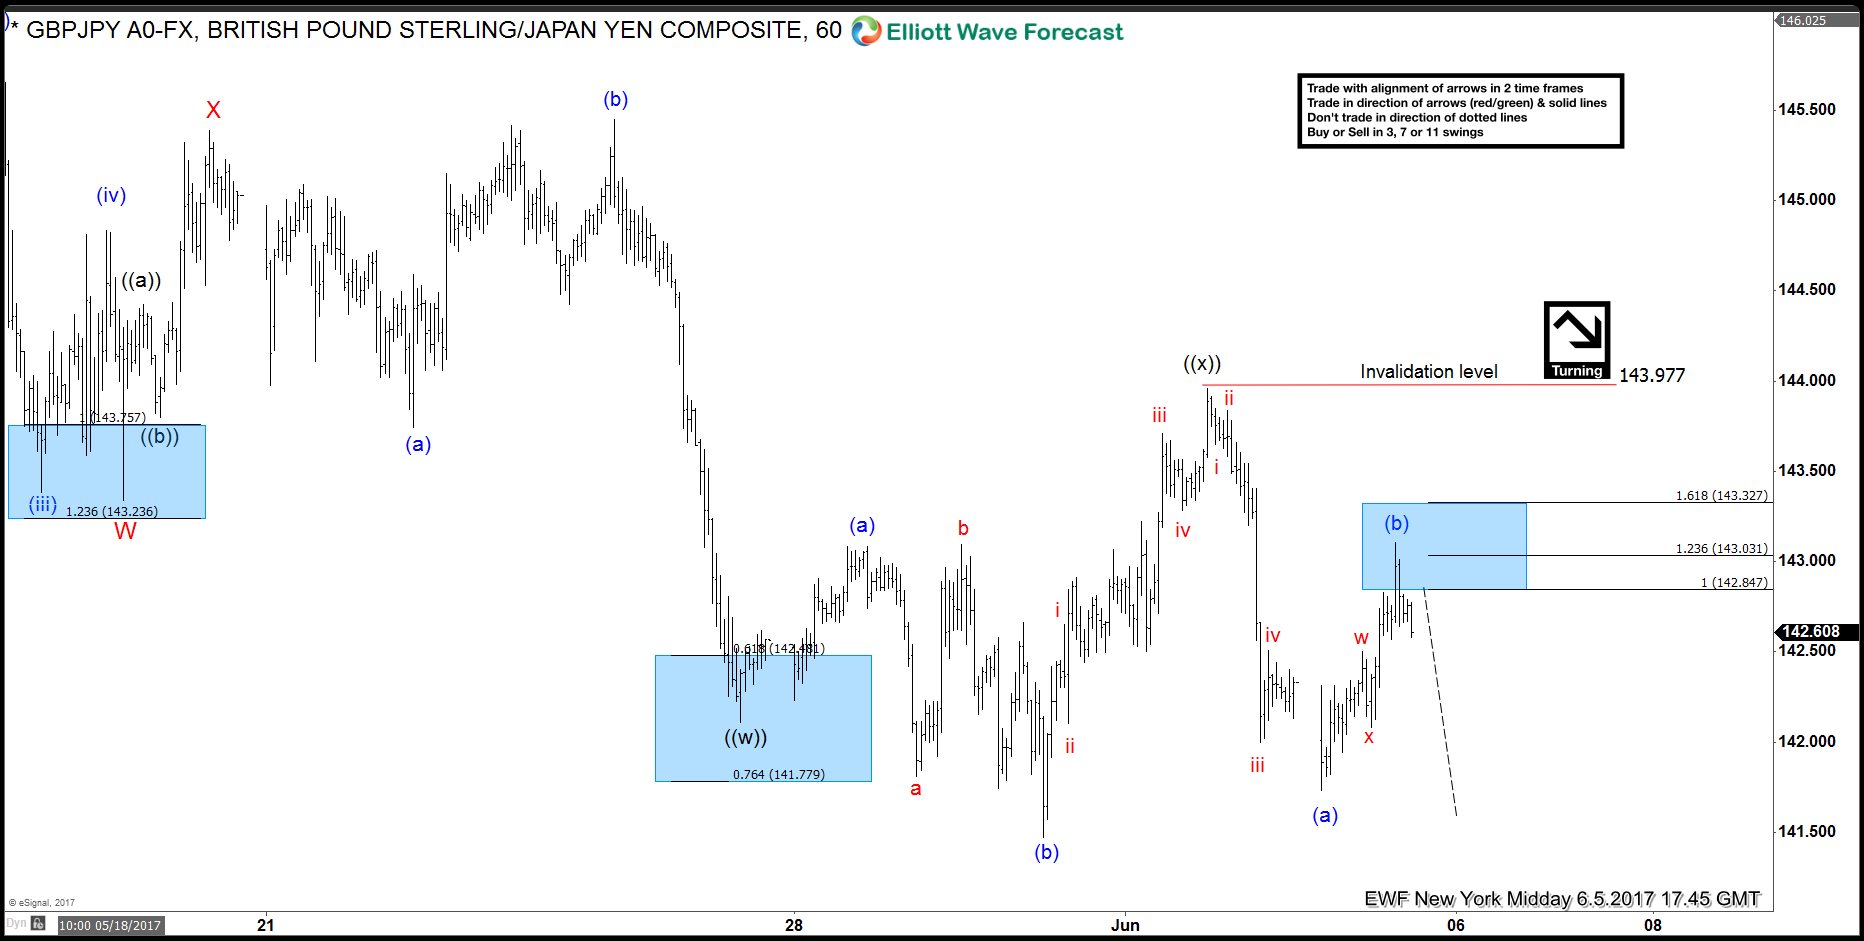
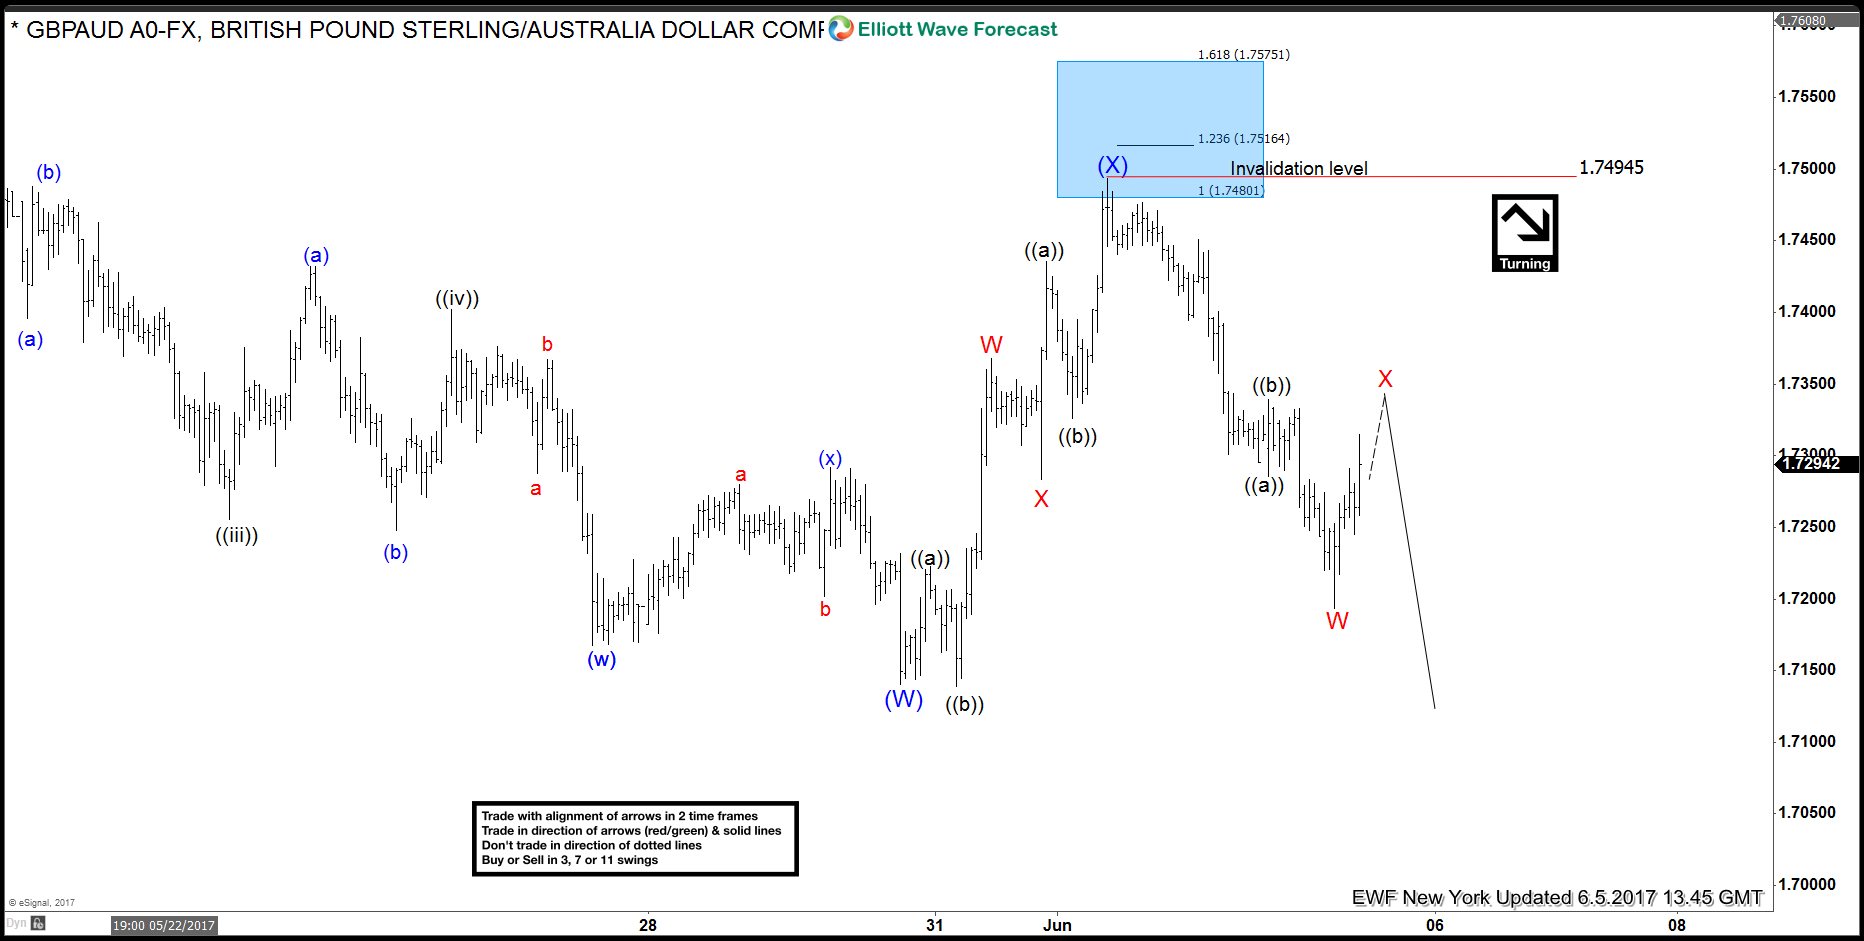
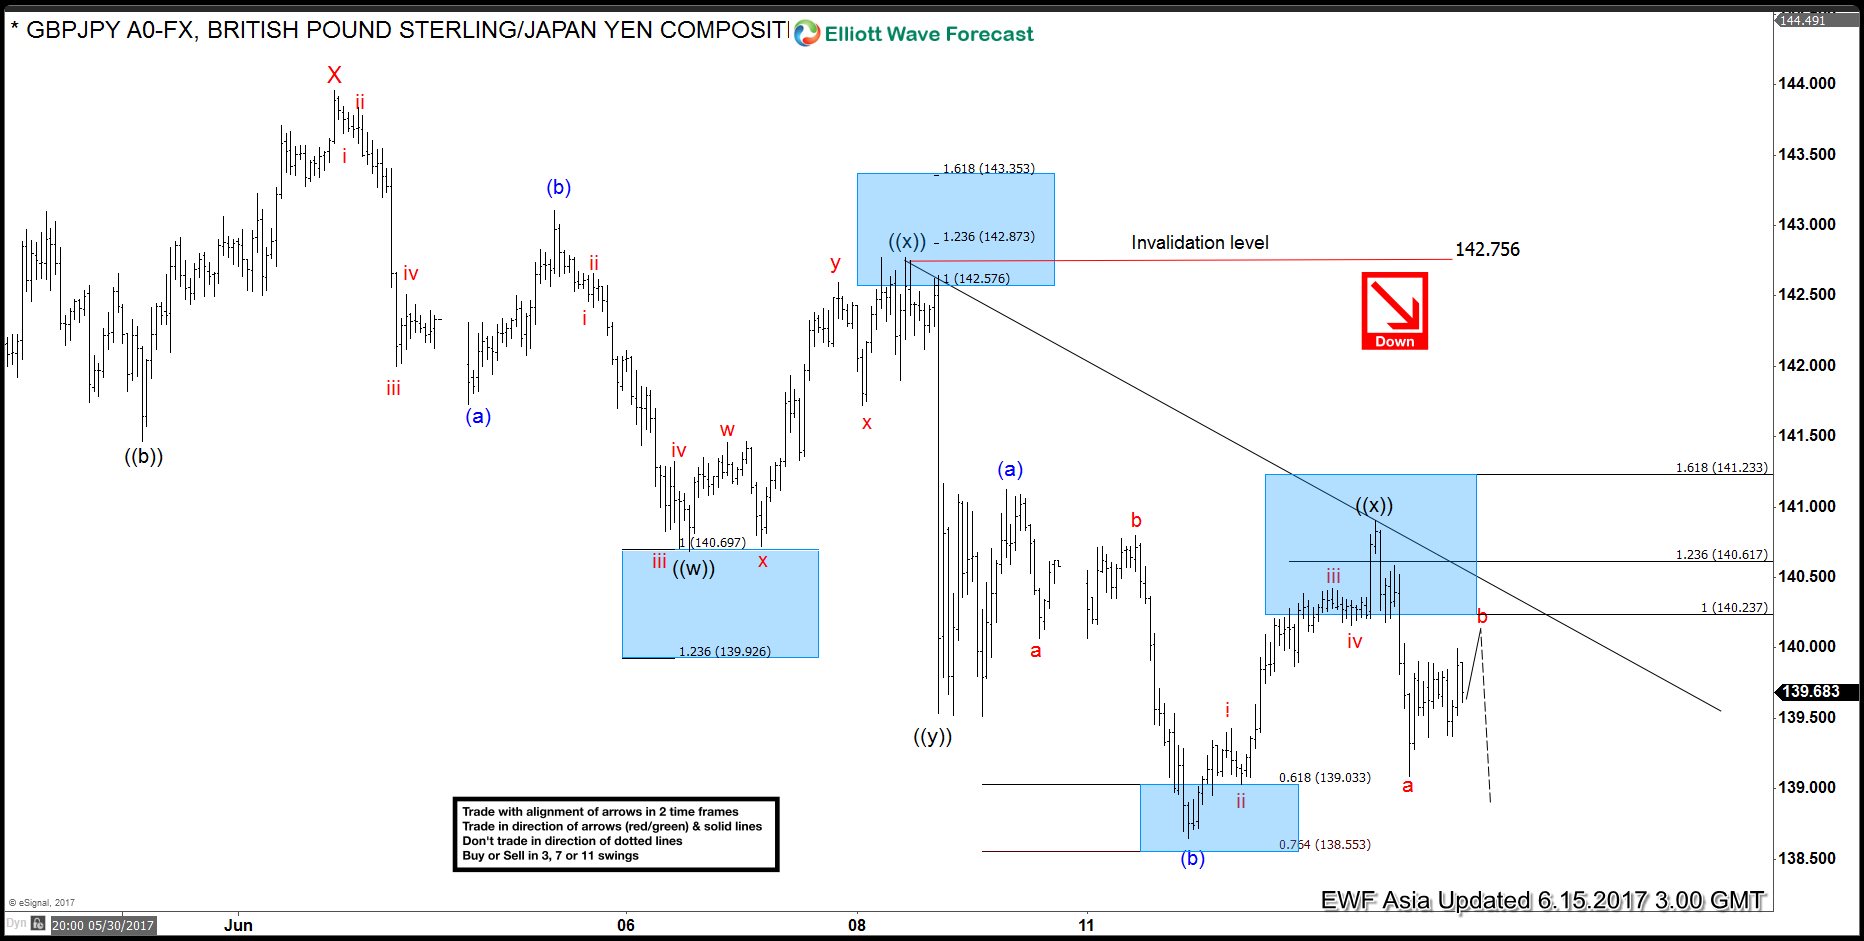
Short term GBPJPY Elliott Wave view suggests the decline from 5/10 high shows a 5 swing sequence, thus favoring more downside. Decline from 5/10 high is unfolding as a double three Elliott Wave structure. Down from 5/10 peak (148.11), Minor wave W ended at 141.47 and Minor wave X ended at 143.96. Minor wave Y is currently in progress and has scope to retest 4/16 low (135.58). Support can be seen at 135.7 – 137.3 area for at least 3 waves bounce.
Subdivision of Minor wave Y is proposed to be unfolding as a triple three Elliott Wave structure. Down from 6/1 peak (143.96), Minute wave ((w)) ended at 140.68, Minute wave ((x)) ended at 142.77, Minute wave ((y)) ended at 139.52 and Minute second wave ((x)) ended at 141.11. Near term, while Minutte wave (x) bounce stays below 141.11, and more importantly below 143.95, expect pair to extend lower. We don’t like buying the proposed bounce.
Ripple is the third-largest cryptocurrency by market capitalization, after Bitcoin and Ethereum. It’s distributed financial technology allows banks to efficiently settle transactions in real time. An alternative to today’s global payment infrastructure, Ripple eliminates time delays and ensures certainty of settlement, resulting in lower transaction costs for banks and their customers and unlocking new revenue opportunities.
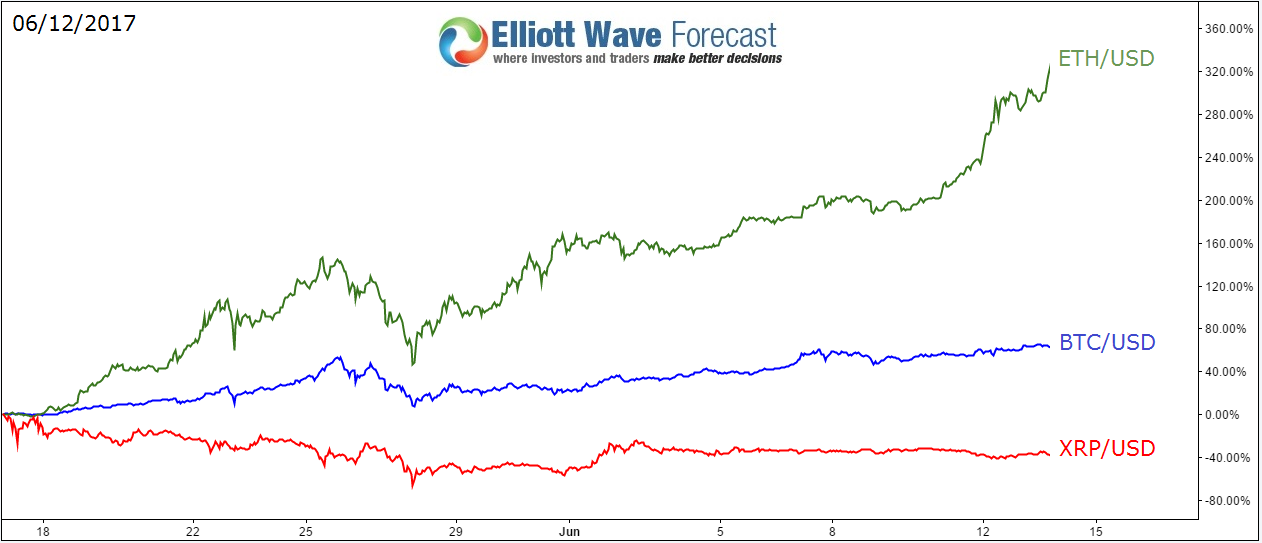
Since the start of 2017, crypto-currencies dominated the global market with huge gains and every trader / investor is buying these assets or looking to exchange it against each other . We pointed out last year to the potential rise of Bitcoin and recently explained how Ethereum is leading the move to the upside, but Ripple has been lagging the recent move so let’s see if it will be able to catch up .
XRP is the native currency of ripple and only exists within the network, so we’ll be using XRP/USD and compare it to both BTCUSD & ETHUSD.
XRPUSD had a significant peak on 05/17 and then dropped for 70% before placing a low on 05/27 same as the rest of crypto-currencies. Since then Ripple only saw a shallow bounce before staying sideways to lower, while ETHUSD saw an impressive +200% increase in value compared to +45% for Bitcoin.
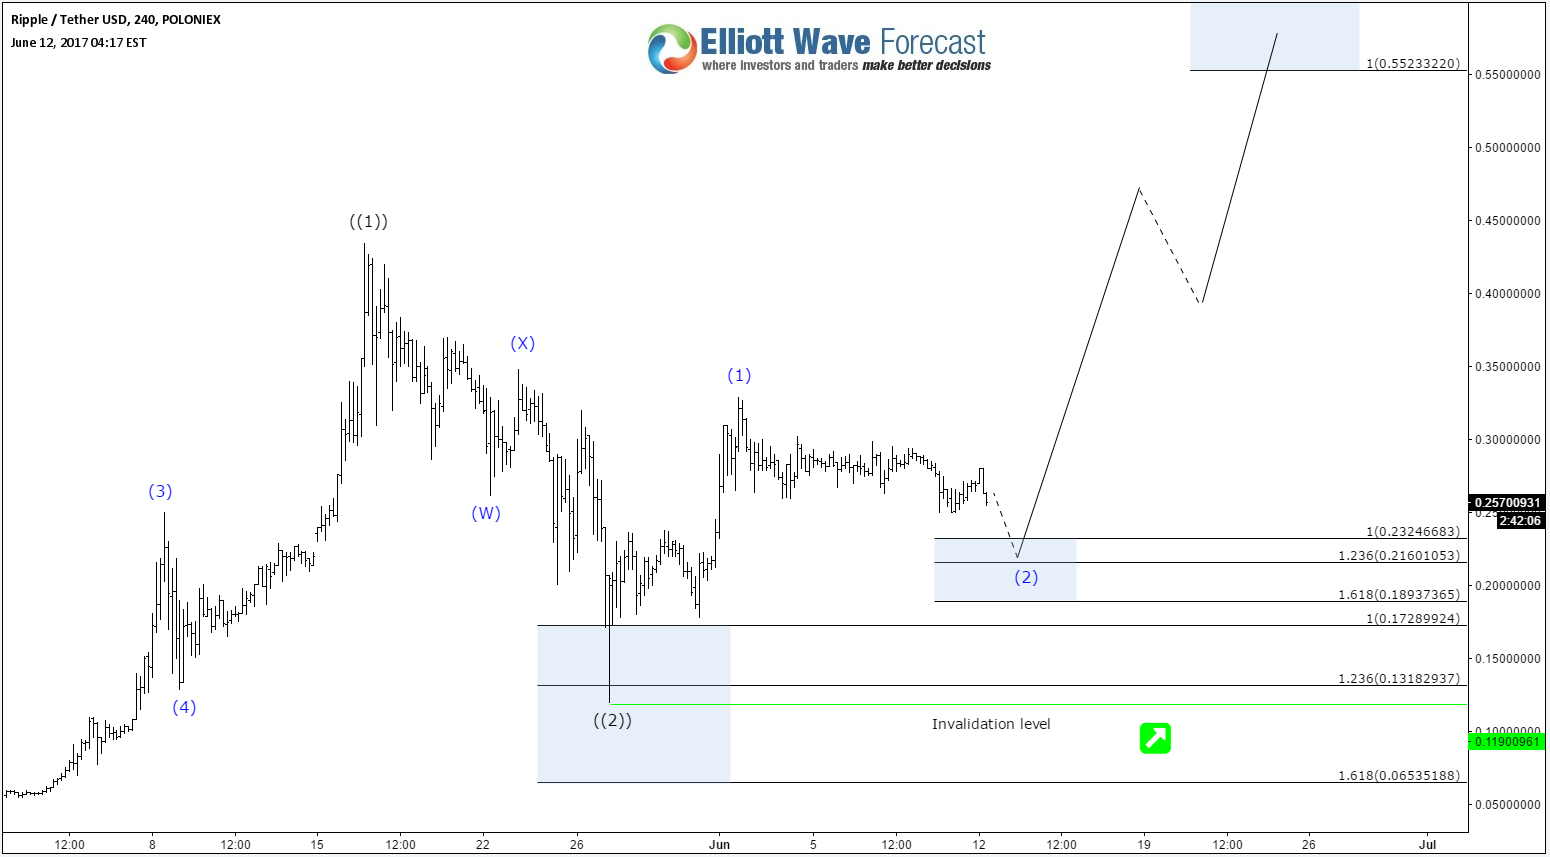
Ripple Elliott Wave Technical Chart
Despite the 40% drop since June the 1st , XRPUSD is reaching a short term extreme area at equal legs ( $0.2324 – $0.1893 which will provide a floor as buyers are expected to show up for a 3 waves bounce at least from there. The Instrument already ended a double three correction at 05/27 low ( $0.1190 ), so while the instrument stays above that level then it should be able to rally for new all time highs with a minimum target at $0.55 area.
Recap
The Ripple protocol has been increasingly adopted by banks and payment networks as settlement infrastructure technology , it’s system have a number of advantages over other cryptocurrencies, that’s why it’s being used by companies such as UniCredit, UBS & Santander. So the digital coin looks to have a bright future as it will be implemented in the financial system and despite its current low price it can catch up the move to the upside really quickly.
General Electric $GE Bounce is from Technicals or Jeff Immelt’s Resignation?
Firstly, I suspect the bounce is technical or at a minimum immaculate timing of the news to go with the technical view. This large multinational organization & conglomerate’s CEO of the past few years Jeff Immeltjust announced he would resign from General Electric and there is an apparent bounce in price on the day of the announcement. This company that really needs no introduction is one of the largest companies in the world and has been around 125 plus years now and is one of the $DJIA Dow Industrial Average’s thirty components as well as one of the $SPX Standard and Poor’s 500 components and is into many different markets where they sell their broad based goods and services. Without further comment on the fundamental and financials of the organization I will stick with the idea the company will find the way to remain profitable and achieve further growth although that becomes harder as time goes on in a larger company’s life cycle.
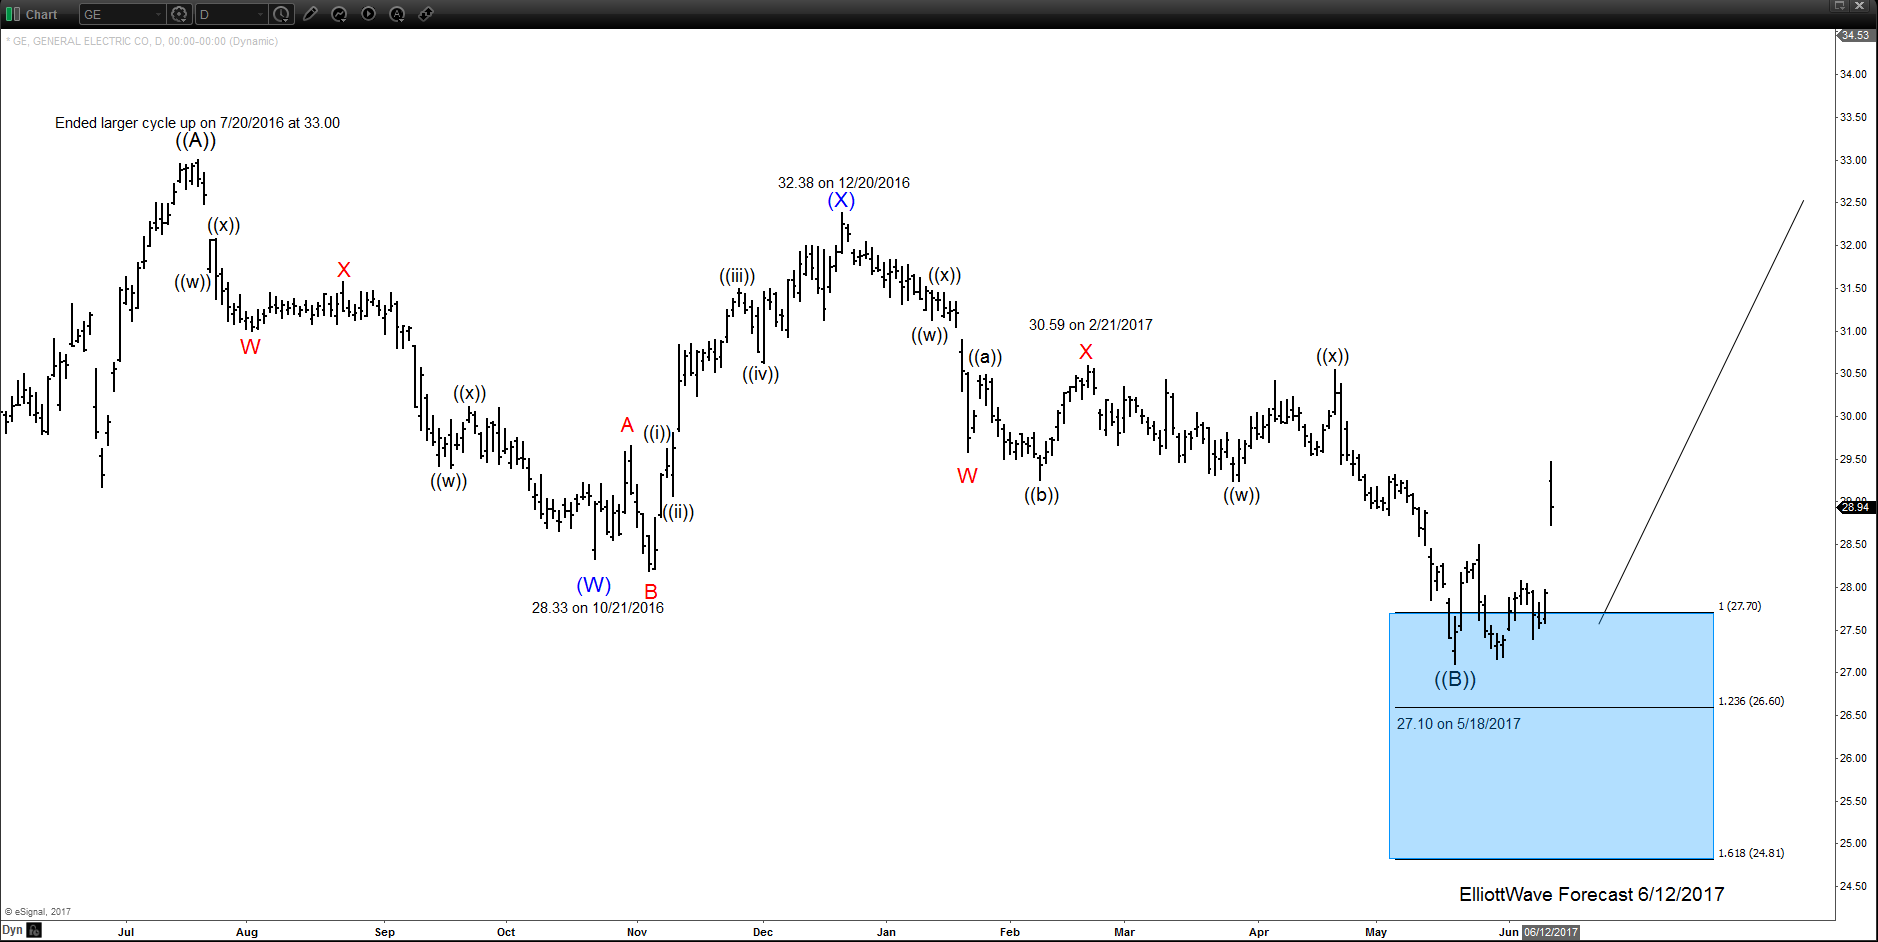
Secondly, the daily chart’s technical picture of the stock from an Elliott Wave perspective is shown below under the end of this article however not shown here in the aforementioned graphic the stock has been in an uptrend since inception with an all time high at 60.50 in the week of 8/28/2000 then for several years suffered the 3 swings lower pullback into the week of 3/2/2009 to a price low at 5.73. From there the stock has lagged it’s underlying indices $SPX and $INDU and has not matched the cycle highs when it bounced and has been the worst performing stock of the $INDU as of late. This is usually an obvious technical red flag when a stock does not run the same cycle with the underlying index it is a component of.
Thirdly, and to conclude. From 3/2/2009 the stock price shows 5 swings up into the 33.00 price registered on 7/20/16 that I’m suggesting & as shown below is a larger degree diagonal ((A)) or even a ((1)) possibly. The dip was a larger 3 swings and appears to have been correcting the cycle up from 2009. As mentioned earlier “I suspect the bounce is technical or at a minimum immaculate timing of the news to go with the technical view”. As you can notice the bounce began about three weeks before the resignation of Jeff Immelt. Price did swing lower into the extension area we will normally expect a bounce from. The sequence and move lower from the 7/20/2016 highs appears to have ended that cycle lower per our usual trend following system here thus when dips are seen, we will look for them to remain above the 27.10 lows for a sustained move higher.
Today’s price action confirms that a possible top has been formed at the June 2/2017 high and EURCAD can be on the way lower to close a market gap that formed on April 23/2017. The turn lower will now give bears a chance to push the pair lower. Below we will show a possible scenario/bearish pattern where bears can enter the market and catch the move lower.
EURCAD 4 hour Possible Bearish Pattern: Traders need to wait for EURCAD to enter between the AB 1.618% – AB 2.24% Fib. levels where blue point C can possibly terminate and react with a bounce higher. If and when blue point C terminates in the suggested area traders will then wait for price to retrace/bounce higher back to the BC 0.50% Fib. retracement level where blue point D can terminate and trigger SELLS. If blue point C terminates in the suggested area and bounces higher to trigger SELLS stops should then be placed at the blue point B high.
If looking to sell EURCAD we prefer waiting for a retracement/bounce to trigger the blue point D sell at the BC 0.50%. Stops should be placed at 1.5255 (point blue B high) and should be sold at the BC 0.50% Fib. level minimum for a better risk/reward trade with targets below the April 23/2017 market gap.
Of course, like any strategy/technique, there will be times when the strategy/technique fails so proper money/risk management should always be used on every trade.
*** Always use proper risk/money management according to your account size ***
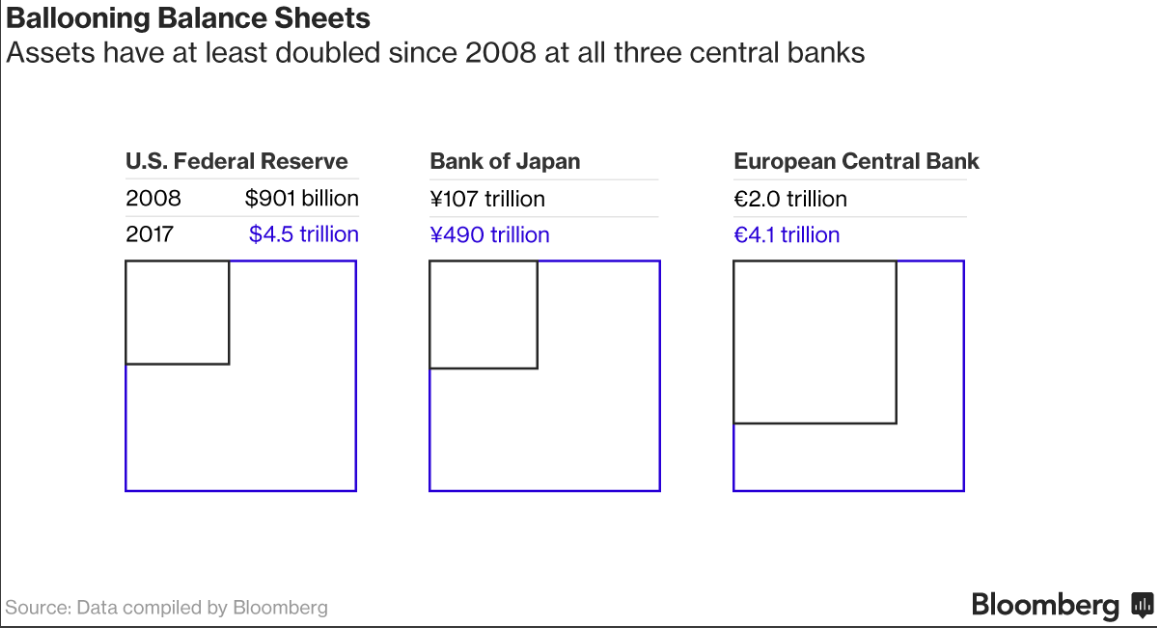
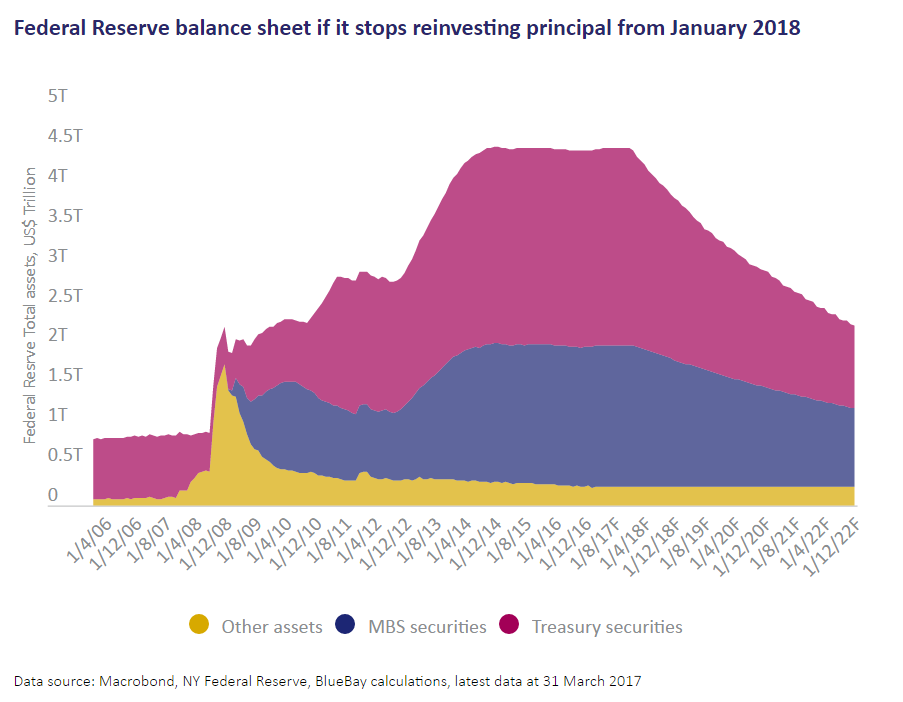
The Fed will soon embark in an uncharted water of Quantitative Tightening (QT). In the aftermath of 2008 global credit crisis, the world central banks went into the biggest experiment in monetary policy called Quantitative Easing (QE). Central banks printed money and bought the government bonds as the primary way for monetary expansion. The combined balance sheets of the three world central banks below exploded in size to about $13 trillion:
In the U.S., the Fed went into large-scale purchases from 2008 – 2013. They tapered the purchases gradually to zero by 2014. As a consequence, the Fed now holds US $1.8 trillion of mortgage-backed securities (MBS) and US $2.5 trillion of US Treasury Bonds. The Fed has been reluctant to reduce the balance sheet, fearing that mortgage rates and other long term borrowing cost can spike and hurt fragile US economy.
However, at its meeting last March 14-15, the Fed’s Monetary Policy Committee (FOMC) agreed it should start normalizing its $4.5 trillion balance sheet later this year. Another name for this “balance sheet normalization” is “Quantitative Tightening”. The Fed’s current practice is to buy new bonds when the old bonds mature. When the Fed starts the normalization, it will taper the reinvestment of principal. In other words, it will let the old bonds mature and not reinvest to buy new ones. This way the balance sheet shrinks as the Fed receives cash from maturing bonds and not reinvest it. The Fed can also decide to reduce the size of the balance sheet more rapidly by selling its securities holding. However, the passive and predictable option of not reinvesting is more likely.
The chart below projects Fed balance sheet if the Fed stops reinvesting principal from January 2018. By doing so, Fed’s balance sheet should be halved by the end of 2022.
The Fed wants to get back to normal monetary policy by raising short term interest rate and shrinking the balance sheet. Interest rate is expected to go back to 2.5% by late 2018 (currently at 1%) while balance sheet is expected to shrink to $2 trillion by 2022. At Fed’s meeting on Wednesday this week, the Fed could announce the blueprint on how to do it.
Effect of Quantitative Tightening
The big question for investors is whether Quantitative Tightening will tighten monetary condition. The Fed has said that QT should not pose a problem to the economy and can be done gradually without disrupting the market. Philadelphia Fed President Patrick Harker even called the policy of shrinking the balance sheet as “watching paint dry.”
However, if QE resulted in higher inflation expectation, higher long bond yields, and encourage the holdings of risky assets, then in QT regime, we should expect the opposite. As central bank asset purchases diminish over the coming years, there is potential of material price declines in some assets. Both the stock and bond markets have come to depend on the Fed’s programs. S&P 500 has surged more than 250% from the 2008 low while interest rates remain low by historical standard.
In 2013, when Ben Bernanke accidentally hinted on QE tapering, stocks fell, interest rates rose and emerging stock and bond markets crashed, an event known as “taper tantrum”, as market worries about the implication of a less accommodative Fed. Thus, the reversal of the program, if not done the right way, can have major consequences.
10 Year Treasury Note (ZN) Monthly Outlook
The 10 Year T-Note Monthly chart above shows a possible extension to the downside. It still needs to break below 9.6.2013 low (122.07) to confirm the next leg lower is possible. Near term, 10 Year T-Note may correct cycle from 7.6.2016 high first before turning lower. When the Fed stops reinvesting the principal into new bonds, the principle of supply and demand suggests there will be more supply of Treasury debt in the market that needs to find new buyers, thus it’s possible that the bond price falls and yields rise when the Fed starts normalizing the balance sheet.
The Fed’s Quantitative Tightening might have significant implication to all asset classes, including stock, bonds, and US Dollar.
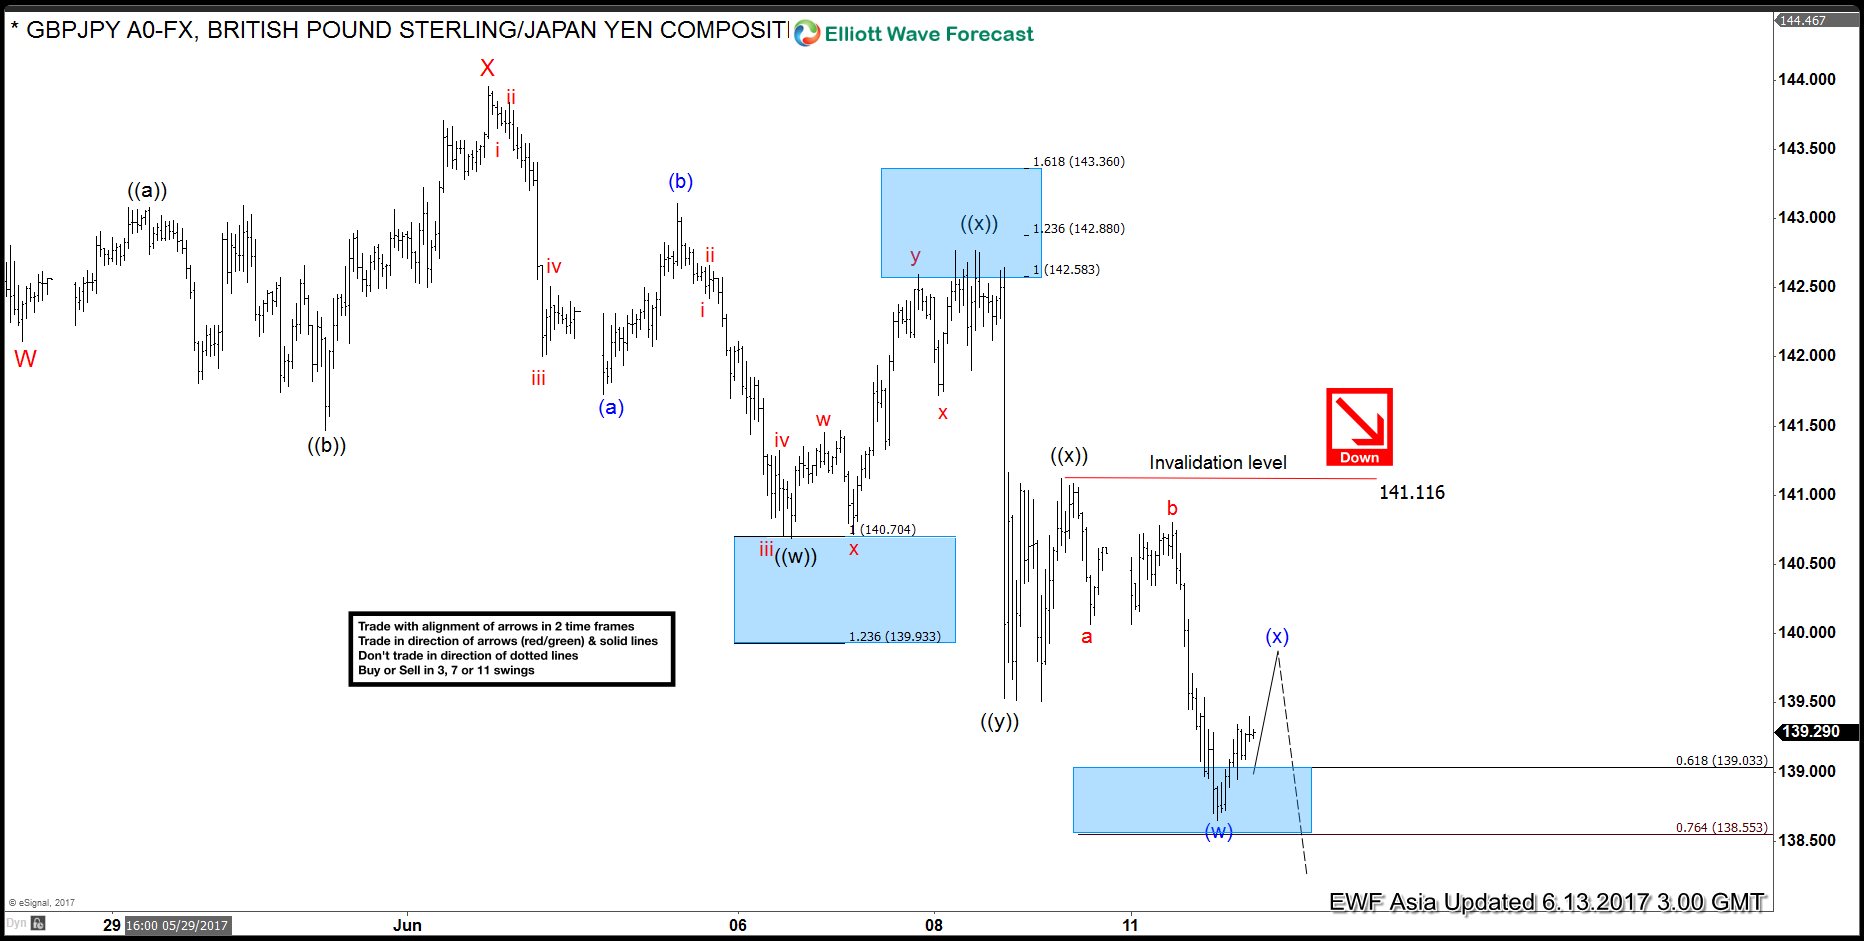
Short term GBPJPY Elliott Wave view suggests the decline from 5/10 high shows a 5 swing sequence, thus favoring more downside. Decline from 5/10 high is unfolding as a double three Elliott Wave structure. Down from 5/10 peak (148.11), Minor wave W ended at 141.47 and Minor wave X ended at 143.96. Minor wave Y is currently in progress and has scope to retest 4/16 low (135.58). Support can be seen at 135.7 – 137.3 area for at least 3 waves bounce.
Subdivision of Minor wave Y is proposed to be unfolding as a triple three Elliott Wave structure. Down from 6/1 peak (143.96), Minute wave ((w)) ended at 140.68, Minute wave ((x)) ended at 142.77, Minute wave ((y)) ended at 139.52 and Minute second wave ((x)) is in progress as a flat and expected to complete at 140.2 – 14.1.2 area. While near term bounce stays below 142.75, and more importantly below 143.95, expect pair to extend lower. We don’t like buying the pair.
Short term GBPJPY Elliott Wave view suggests the decline from 5/10 high shows a 5 swing sequence, thus favoring more downside. Decline from 5/10 high is unfolding as a double three Elliott Wave structure. Down from 5/10 peak (148.11), Minor wave W ended at 141.47 and Minor wave X ended at 143.96. Minor wave Y is currently in progress and has scope to retest 4/16 low (135.58). Support can be seen at 135.7 – 137.3 area for at least 3 waves bounce.
Subdivision of Minor wave Y is proposed to be unfolding as a triple three Elliott Wave structure. Down from 6/1 peak (143.96), Minute wave ((w)) ended at 140.68, Minute wave ((x)) ended at 142.77, Minute wave ((y)) ended at 139.52 and Minute second wave ((x)) is proposed complete at 140.9. While near term bounce stays below 142.75, and more importantly below 143.95, expect pair to extend lower. We don’t like buying the pair.
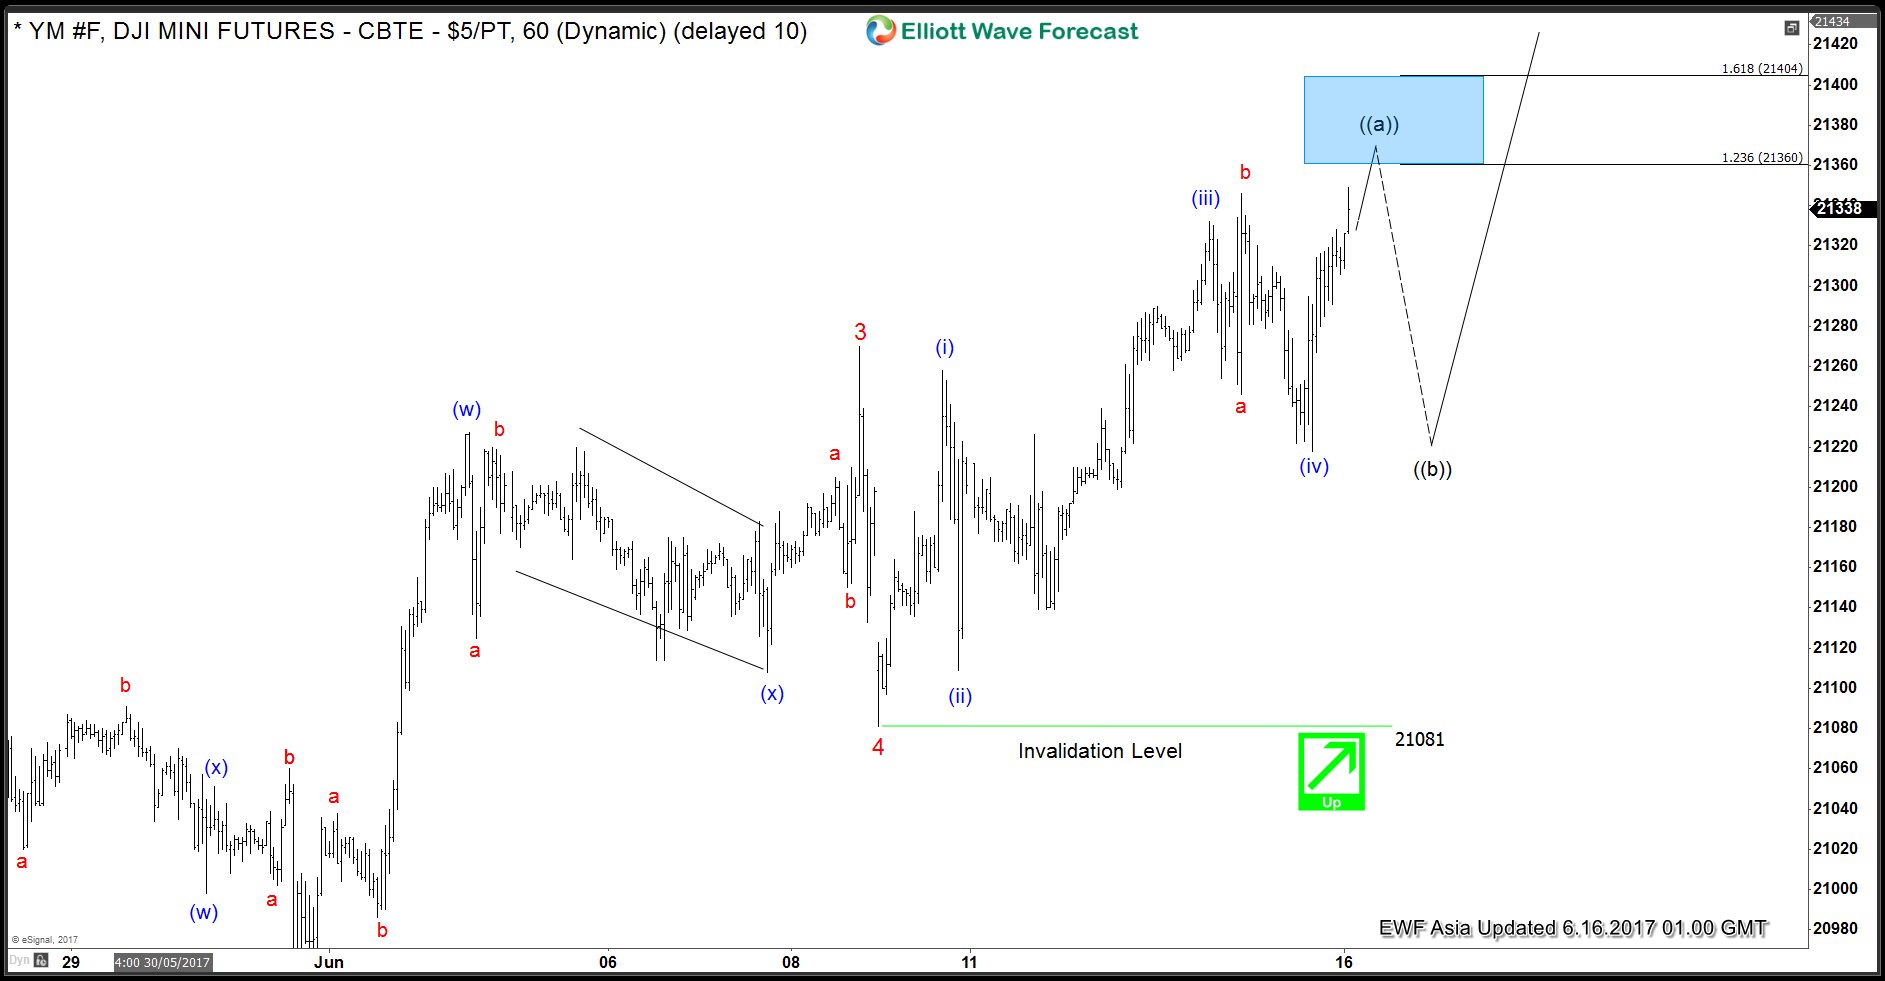
Short term YM (Dow Futures) Elliott Wave view suggests the rally from 4/19 low is unfolding as a diagonal Elliott Wave structure where Minor wave 1 ended at 21010 (4/26), Minor wave 2 ended at 20474 (5/18), Minor wave 3 ended at 21270 (6/8), and Minor wave 4 ended at 21081 (6/8). Minor wave 5 is in progress and subdivided into a zigzag Elliott Wave structure. Up from 6/8 low, Minute wave ((a)) is expected to complete at 21360 – 21404. Index should then pullback in Minute wave ((b)) to correct cycle from 6/8 low before the rally resumes. We don’t like selling the proposed pullback. Buyers should appear once Minute wave ((b)) pullback is over in 3, 7, or 11 swing.
YM (Dow Futures) 1 Hour Elliott Wave Chart 06/16/2017
The world is hooked on ‘Palladium’ because of its uses as an industrial metal and catalyst, the consumers are mainly automobile producers as it’s widely used in gasoline-based engine cars to curb harmful emissions from vehicles. Palladium surged +34% this year on expectations that supply will lag demand for a sixth straight year, beating the rest of commodities, combined with last year gains it results in an impressive 95% rally.
The spot markets are trading above the futures market as it appears that there is a serious shortage of readily available physical bars for spot settlement, which helped the metal to make new 16-year high level of $910 on Friday, June 9. The futures for July expiration touched the peak of $891 the same day.
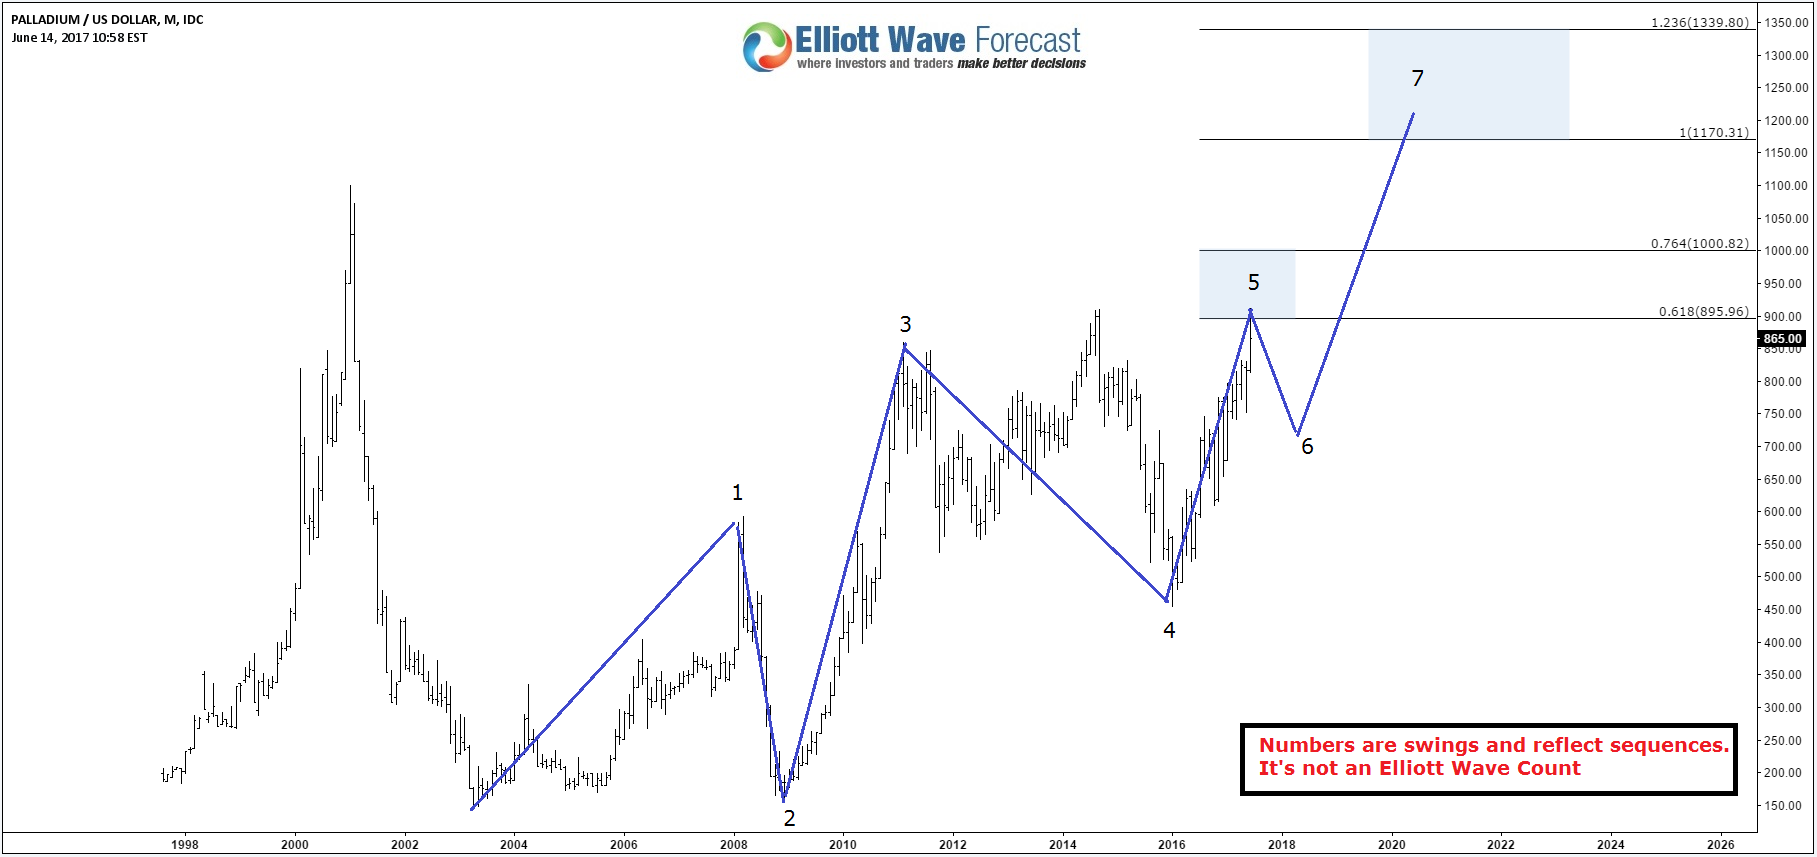
The recent break higher opened a new extension to the upside as palladium is now showing incomplete bullish 5 swing sequence from 2003 low, which is different from the usual Elliott Wave count as this sequence is part of the double three structure which suggest that a connector is in place between 2011 & 2016 as a flat correction and the 6th swing pullback should hold 2016 low for palladium to be able to resume it’s rally toward the next target around $1170 – $1340. The surprise move would happen if it’s doing a diagonal and currently is in the last 5th wave or the recent new high rally from 2016 lows is part of a flat from 2011 peak, so both these scenarios would result in a significant decline but until there is a sign of 2016 pivot breaking then the metal should remain supported and leading the commodities to the upside.
Palladium Monthly Chart To compare Palladium to commodities, we added The WisdomTree Continuous Commodity Index Fund (GCC) and The Thomson Reuters/Jefferies CRB Index (TRJEFFCRB) as both are tracking multiple commodities and reflecting the overall trend which has been to the downside since 2011 peak. GCC index has already reached extreme area from 2008 & 2011 peaks suggesting that the bearish cycle is in the last stage even there could be still another leg lower in CRB & GCC which may or may not break the 2016 low. In fact that won’t make any big difference for Palladium as it already created enough separation from 2016 low, so it will be either doing a small correction against May 2017 low or a deeper pullback to correct 2016 cycle before rallying again.
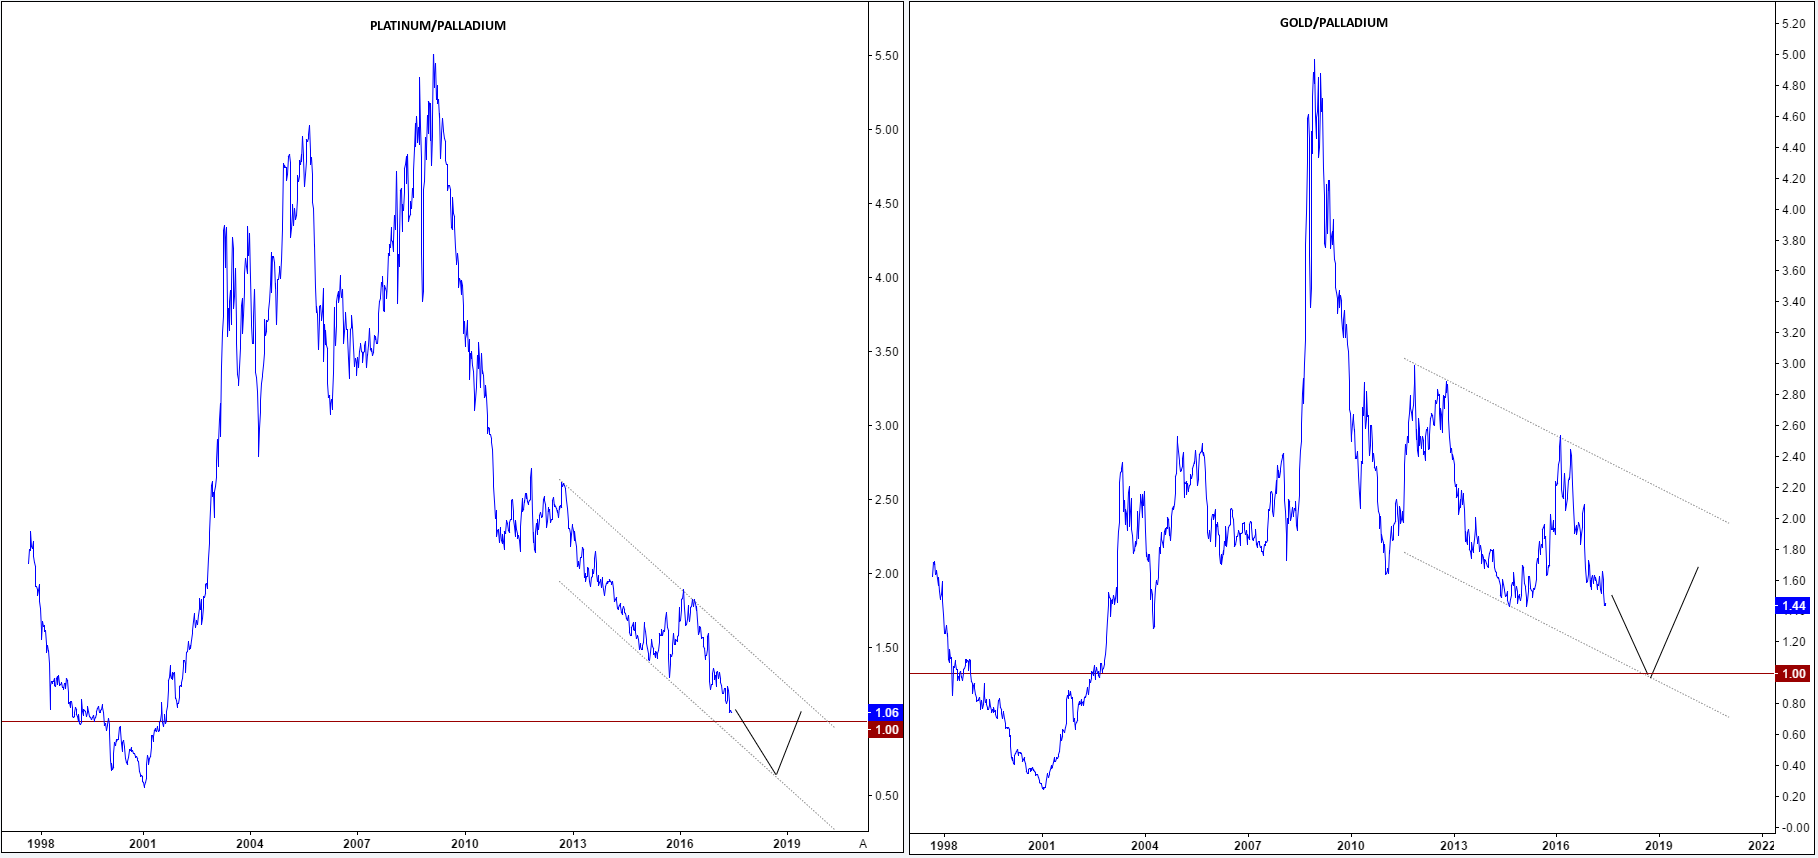
GCC vs CRB vs Palladium The next graph represents the performance of the platinum-palladium & gold-palladium ratio, a measurement of the number of palladium ounces it takes to buy a single ounce of platinum & gold. Palladium is now almost as expensive as its brother metal platinum for the first time since 2001 as the ratio is near parity and ready to break lower in the near future. The gold-palladium ratio is also catching the move lower and could reach parity if the strong rally in Palladium continues.
Platinum & Gold / Palladium Ratio Recap
The fundamentals of the palladium market seems to be among the strongest in all the commodities and the recent technical break higher is bringing more bulls to join the rally, so while the metal holds above last year low then it should rise again to make new all time highs above $1100, surpass Platinum and try to catch Gold. The expected move to the upside will support the whole commodity markets so during the short term pullback of palladium, other instrument will either establish new lows or retest the previous one before the entire sector starts rallying again.
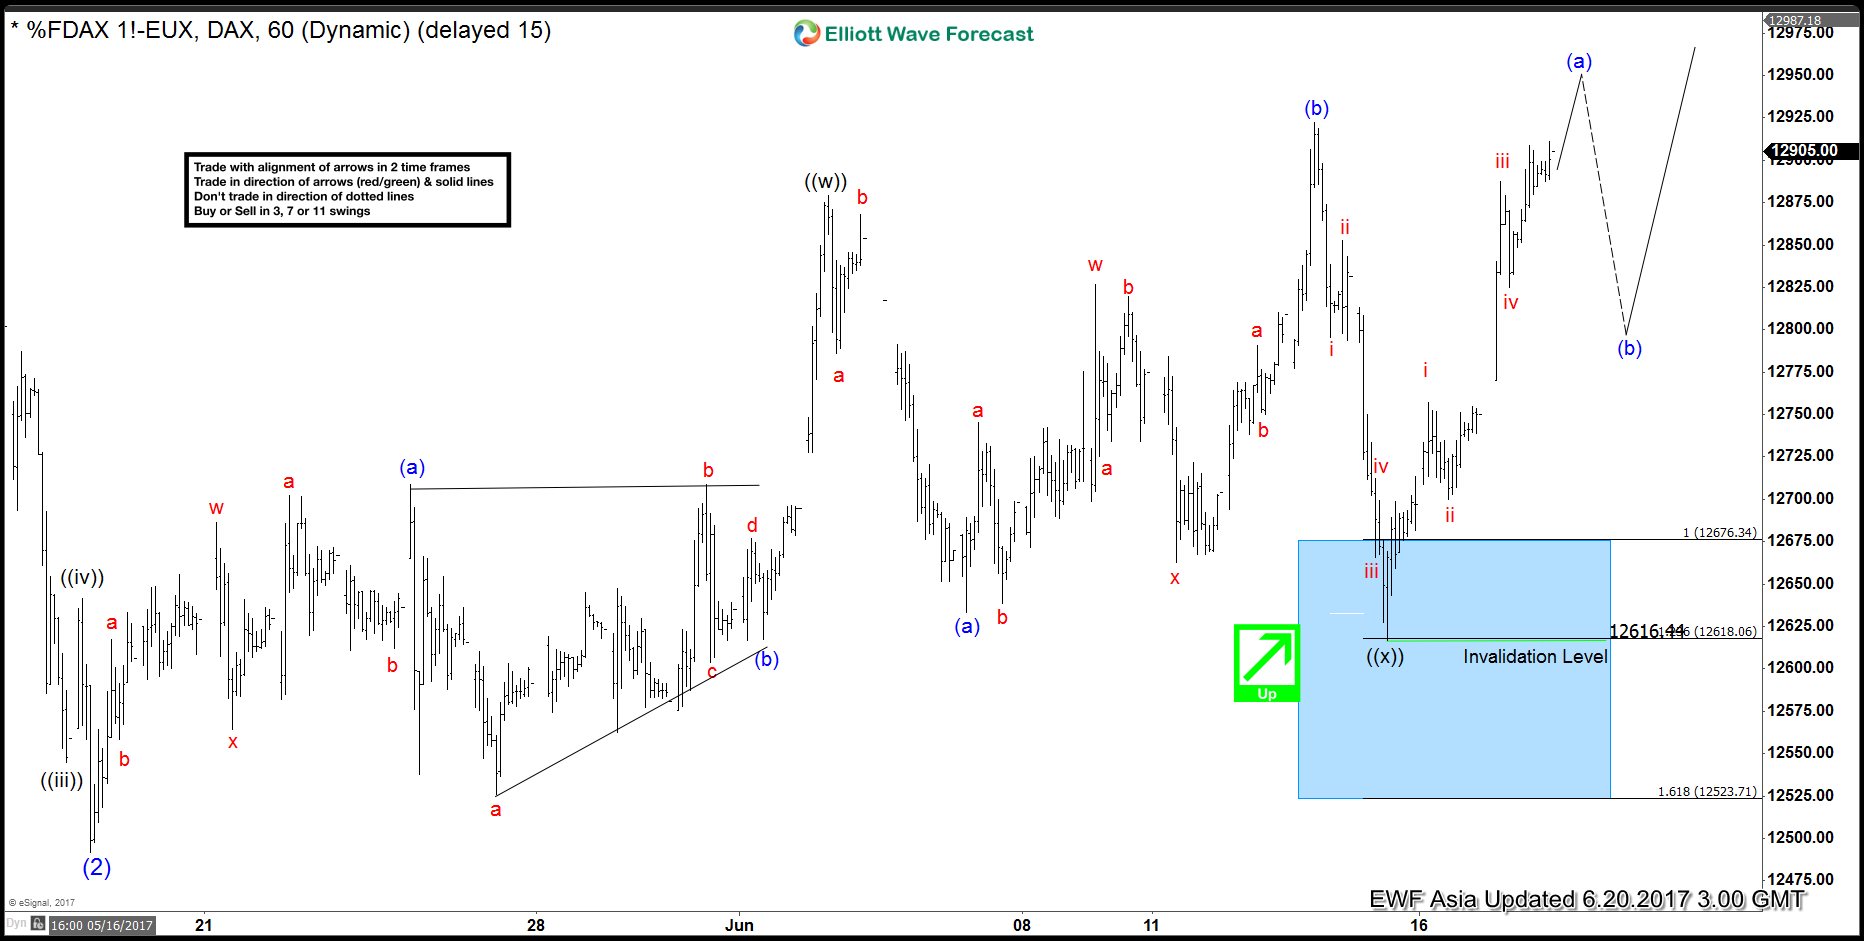
Short term DAX Elliott Wave view suggests the decline to 12491.5 on 5/18 ended Intermediate wave (2). Up from there, the rally is unfolding as a double three Elliott Wave structure. Minute wave ((w)) ended at 12879.5 and Minute wave ((x)) pullback ended at 12616.44. Internal of Minute wave ((x)) is subdivided as an expanded flat Elliott Wave structure where Minutte wave (a) ended at 12633.5 and Minutte wave (b) ended at 12922.5.
A break above Minutte wave ((b)) on 6/14 is necessary to add validity that the next leg higher has started. Up from 12616.44, the rally is unfolding as a zigzag Elliott Wave structure where Minute wave (a) is in progress as 5 waves. Expect a pullback in Minute wave (b) soon to correct cycle from 6/15 low (12616.44). While dips stay above 12616.44, expect Index to extend higher. We do not like selling the proposed pullback and buyers should appear once Minute wave (b) pullback is complete in 3, 7, or 11 swing.
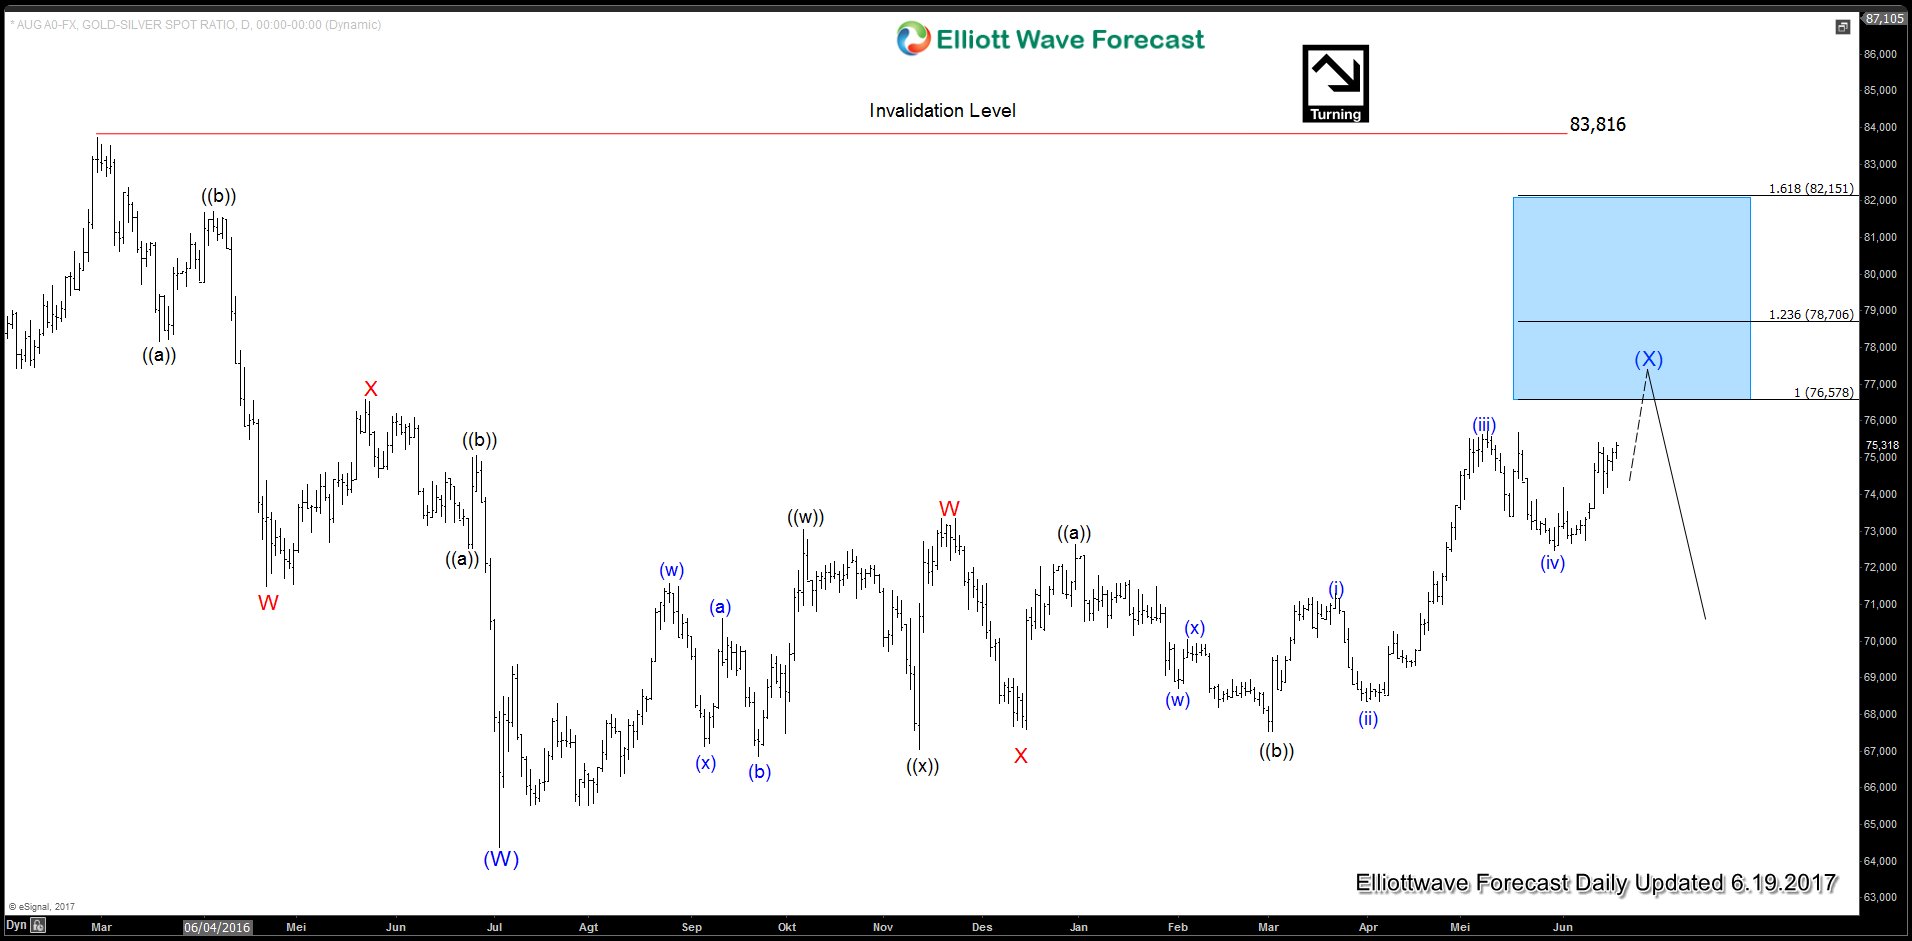
Gold-to-Silver ratio is correcting cycle from 2/29/2016 peak (83.68) in 7 swing. While the bounces fail below 83.68 high, the ratio should resume lower or at least pullback in 3 waves. Down from 2/29/2016 peak, Intermediate wave (W) ended at 64.38. Intermediate wave (X) is in progress to correct cycle from 2/29/2016 towards 76.58 – 78.7 area before the Ratio turns lower. Short term, while the Ratio stays above 72.46, it should continue higher towards the target above before 3 waves pullback at least.
With the Ratio hovering near the high end of the range, the next leg in the instrument is likely lower after the bounce ends. The Ratio is inversely correlated with the underlying physical metals. This means when the Ratio hits the target and turns lower, Gold and Silver should be supported. Thus, as the Ratio reaches the target of 76.55 – 78.68 and turns lower, both metals can start rallying also.