Elliottwave-Forecast

Master Trader
Feb 17, 2017
2,460
9
84
www.elliottwave-forecast.com
SPX Elliott Wave View: Pull back started

Short Term Elliott Wave view in SPX suggests the rally from 3/27 low (2322.2) ended at 2403 as a leading diagonal Elliott Wave structure where Minute wave ((i)) ended at 2378.3, Minute wave ((ii)) ended at 2328.95, Minute wave ((iii)) ended at 2398.16, Minute wave ((iv)) ended at 2379.75, and Minute wave ((v)) of A ended at 2403. Near term, while bounces remain below there expect the Index to pull back in larger degree 3, 7, or 11 swings to correct cycle from 3/27 low before the rally resumes again. We don’t like selling the Index and expect buyers to appear after 7 or 11 swings pull back for extension higher. This view remains valid as far as pivot at 3/27 (2322.2) low remains intact.

SPX 1 Hour Elliott Wave Chart 05/12/2017


Elliottwave-Forecast

Master Trader
Feb 17, 2017
2,460
9
84
www.elliottwave-forecast.com
Macron’s Triumph Removes Eurozone Political Risk

Emmanuel Macron won the presidential election last Sunday, defeating Marine Le Pen, a far-right nationalist who wanted to take France out of the European Union. Markets had feared that Le Pen’s win could threaten the EU project, but Macron’s win has eliminated uncertainty regarding France’s membership of the Euro and removed the risk of near-term severe political shock to France and wider Europe. The Euro went above $1.10 briefly, but since then has pulled back. The upwards move was not dramatic than the first round of French elections as many traders have anticipated Macron’s victory and thus victory was already well priced in.

The new president has promised economic reforms to restore France’s competitiveness, but Macron currently only has a newly formed minor party and it’s unclear how much support he will get given at least half of its parliamentary candidates will have no prior political affiliations. Thus, the market has now turned its attention to the next legislative election in June. Macron needs to get majority in the National Assembly, otherwise the Prime Minister who exercises the main executive authority, could be a part of the opposition and may ignore his program. It’s crucial for Macron to succeed in parliamentary elections next month in order to enact his reforms.

Macron’s task won’t be easy as he is going to assume a presidency of a nation that is still very divided. One third of French people who voted preferring Le Pen and populism, and over a quarter of French people abstained in the voting. This is one of the highest abstention rates in the history of France and for the first time in the history of France, the election didn't have candidate from the main parties of the left and right. If Macron falls short of a majority in the June’s legislative election, he would need to form a governing coalition with other parties. And if another party wins a majority, then he needs to deal with the rival party during periods called cohabitation.


With France’s traditional party system losing confidence by the voters, the risks of cohabitation and political dysfunction have increased. If an opposition party won the majority in National Assembly, Macron will likely be unable to carry out his ambitious political reform. During cohabitation period, normally the president will have a diminished role, and the Premier (Prime Minister) is the one who exercise main executive policy making authority. If, on the other hand, Macron’s party secures parliamentary majority, Macron’s presidency will be smooth and he will be able to implement his agendas.

Despite the uncertainty in the coming June ‘s legislative election, the triumph of Macron is still important as it has removed the worst case scenario for the short term, and this may provide some sort of floor to Euro dollar weaknesses.

EURJPY Long Term Elliott Wave View


Daily chart of EURJPY is showing a 5 swing sequence from 7.8.2016 low, suggesting that as far as pair stays above swing #4 (115.19), it has scope to extend higher. How does this impact the more popular EURUSD? We can look at the correlation between the two pairs below

Overlay of EURJPY and EURUSD


An overlay of EURJPY and EURUSD chart above shows that the move in the two pairs could have a different degree of strength in certain period. For instance, the move during the period of 2015 – 2017 in EURJPY did not create a new low below 2012 low while the move in EURUSD in the same period produced a new low. Despite the different degree of strength, the two pairs still share remarkable similar oscillation and if one pair is trending higher, the other one is likely also moving in the same direction and vice versa. We have seen in the first chart that EURJPY has a bullish sequence from 6.24.2017 low and thus the pair can see an extension higher. Based on the correlation chart above, we may conclude that EURUSD should not see a lot of weaknesses if EURJPY is expected to continue to the upside in 7 swing.
 

Elliottwave-Forecast

Master Trader
Feb 17, 2017
2,460
9
84
www.elliottwave-forecast.com
FTSE Elliott Wave View: Mature Cycle

Short Term Elliott Wave view in FTSE suggests the rally from 4/20 low (7096.6) is unfolding as a zigzag Elliott Wave structure where Minute wave ((a)) ended at 7302.57 and Minute wave ((b)) ended at 7197.28. Subdivision of Minute wave ((a)) is unfolding as an impulse where Minuttte wave (i) ended at 7134.53, Minutte wave (ii) ended at 7104.22, Minutte wave (iii) ended at 7290.82, Minutte wave (iv) ended at 7262.32, and Minutte wave (v) of ((a)) ended at 7302.57. Index has since broken above 7302.57 suggesting Minutte wave ((c)) has started.

Minute wave ((c)) is currently in progress as an ending diagonal where Minutte wave (i) ended at 7280.7, Minutte wave (ii) ended at 7222.81, Minutte wave (iii) ended at 7398.58, and Minutte wave (iv) ended at 7369.23. Index has reached 1.236 extension of the Minute ((a)) – ((b)) and thus minimum requirement has been met for Minor wave 1 to complete and cycle from 4/20 low to end, although a marginal high still can’t be ruled out at this stage. Expect Index to correct cycle from 4/20 low soon within Minor wave 2 in 3, 7, or 11 swing before the rally resumes. We don’t like selling the proposed pullback and expect buyers to appear again when Minor wave 2 pullback is over in 3, 7, or 11 swing.

FTSE 1 Hour Elliott Wave Chart 05/16/2017


Elliottwave-Forecast

Master Trader
Feb 17, 2017
2,460
9
84
www.elliottwave-forecast.com
NZD JPY Elliott wave sequence forecasts the rally

In this technical blog we’re going to take a quick look at the past Elliott Wave charts of NZD JPY . We’re going to take a look at the structures, count the swings and explain the trading setup.

The chart below is NZD JPY 4 hour update from 05.04.2017. As our members know, we were pointing out that NZDJPY is having incomplete bullish swings sequnces from the 75.62 low. Structure has been calling for more strength in 7th swing toward 78.40-78.94 ( taking profit area). Once the pair reaches proposed area in 7 swings, we expect to see 3 wave pull back to correct the cycle from the lows.


Now let’s take a look at the short term structures…

NZD JPY 1 Hour Chart 05.04.2017
The pair is bullish against the 76.112 low. Wave (x) pull back is expected to make another short term low ideally to reach 77.22-76.90 ( buying area). As we got incomplete bullish sequences in 4 hour chart, we advised our members to avoid selling the pair and keep buying dips in 3,7,11 swings. Invalidation level for the trade comes at 76.90 and we’re targeting 78.40-78.94 area.


NZD JPY 1 Hour Chart 05.09.2017
Eventually the pair has reached proposed target, giving us nice profits. As of right now, the pair has scope to extend little bit higher still toward 79.03-79.32 area before find sellers for for a 3 wave pull back at least.


Elliottwave-Forecast

Master Trader
Feb 17, 2017
2,460
9
84
www.elliottwave-forecast.com
FTSE Index Elliott Wave View: Ending A Cycle

Short Term Elliott Wave view in FTSE Index suggests the rally from 4/20 low (7096.6) is unfolding as a zigzag Elliott Wave structure where Minute wave ((a)) ended at 7302.57 and Minute wave ((b)) ended at 7197.28. Subdivision of Minute wave ((a)) is unfolding as an impulse where Minuttte wave (i) ended at 7134.53, Minutte wave (ii) ended at 7104.22, Minutte wave (iii) ended at 7290.82, Minutte wave (iv) ended at 7262.32, and Minutte wave (v) of ((a)) ended at 7302.57. FTSE Index has since broken above 7302.57 suggesting Minute wave ((c)) has started.

Minute wave ((c)) is currently in progress as an ending diagonal where Minutte wave (i) ended at 7280.7, Minutte wave (ii) ended at 7222.81, Minutte wave (iii) ended at 7460.20, and Minutte wave (iv) ended at 7435.64. Index has reached 1.618 extension of the Minute ((a)) – ((b)) and thus cycle from 4/20 low is mature and Minor wave 1 can be called completed at 7533.7. Expect FTSE Index to correct cycle from 4/20 low soon within Minor wave 2 in 3, 7, or 11 swing before the rally resumes. We don’t like selling the proposed pullback and expect buyers to appear again when Minor wave 2 pullback is over in 3, 7, or 11 swing.

If the Index does not do a decent pullback from here to correct cycle from 4/20 low, then the move from 4/20 low could be instead labelled as a regular 5 waves Impulse Elliott Wave structure in which case we are ending Minor wave 3 at recent high (7533.7) and the Index will do shallow pullback in Minor wave 4 and then extend higher again in Minor wave 5 before ending cycle from 4/20 low and see larger pullback. In both cases, we don’t like selling the Index and expect buyers to appear in the dips in 3, 7 or 11 swings.

FTSE Index 1 Hour Elliott Wave Chart 05/17/5017


Elliottwave-Forecast

Master Trader
Feb 17, 2017
2,460
9
84
www.elliottwave-forecast.com
FTSE 100 Elliott Wave View: Turning Lower

Short Term Elliott Wave view in FTSE 100 suggests the rally from 4/20 low (7096.6) is unfolding as a zigzag Elliott Wave structure where Minute wave ((a)) ended at 7302.57 and Minute wave ((b)) ended at 7197.28. Subdivision of Minute wave ((a)) is unfolding as an impulse where Minuttte wave (i) ended at 7134.53, Minutte wave (ii) ended at 7104.22, Minutte wave (iii) ended at 7290.82, Minutte wave (iv) ended at 7262.32, and Minutte wave (v) of ((a)) ended at 7302.57. FTSE 100 has since broken above 7302.57 suggesting Minute wave ((c)) has started.

Minute wave ((c)) is unfolding as an ending diagonal where Minutte wave (i) ended at 7280.7, Minutte wave (ii) ended at 7222.81, Minutte wave (iii) ended at 7460.20, and Minutte wave (iv) ended at 7435.64. Index has reached 1.618 extension of the Minute ((a)) – ((b)) and thus cycle from 4/20 low is mature and we are calling Minor wave 1 completed at 7533.7. Expect FTSE 100 to correct cycle from 4/20 low within Minor wave 2 in 3, 7, or 11 swing before the rally resumes. We don’t like selling the proposed pullback and expect buyers to appear again when Minor wave 2 pullback is over in 3, 7, or 11 swing.

If the Index does not do a decent pullback from here to correct cycle from 4/20 low, then the move from 4/20 low could be labelled as a regular 5 waves Impulse Elliott Wave structure in which case we are ending Minor wave 3 at recent high (7533.7) and the Index will do shallow pullback in Minor wave 4 and then extend higher again in Minor wave 5 before ending cycle from 4/20 low and see larger pullback. In both cases, we don’t like selling the Index and expect buyers to appear in the dips in 3, 7 or 11 swings.

FTSE 100 1 Hour Elliott Wave Chart 05/18/2017


Elliottwave-Forecast

Master Trader
Feb 17, 2017
2,460
9
84
www.elliottwave-forecast.com
Alibaba Stock ( BABA ) Looking for a Pullback

Alibaba Group Holding Limited (NYSE: BABA) is a Chinese e-commerce company that provides sales services via web portals. It also provides electronic payment services, a shopping search engine and data-centric cloud computing services. Alibaba is one of the largest Internet companies as its online sales & profits surpassed all US retailers (including Walmart, Amazon and eBay) combined in 2015 and it now considered as the world’s largest retailer surpassing Walmart.

Alibaba Shares recently managed to make new all time highs after breaking above 2014 peak $120 and investors are still looking for more gains to come. Let’s jump into the Elliott Wave technical analysis to see how bullish is it ?

BABA Double Three Structure
Since 2015 low, BABA started trading in 3 waves move to the upside which currently is forming 5 swings sequence with divergence which we consider as an incomplete bullish sequence as part of a double three structure. So according to the swing structure , the stock is ending the 5th swing around equal legs area $120 – $125 from December 2016 low and it should then pullback in 3 waves against 86.01 low. The 6th swing pullback should ideally hold above the bullish channel to be able to resume the rally toward equal legs area $138 from September 2015.


BABA Leading Diagonal Structure
The second scenario for BABA would be represented when the pivot at $86.01 low gives up later on, which will mean the stock has ended the cycle from from September 2015 low and in that case it can be counted as a leading diagonal because it has 5 corrective waves holding the divergence. Consequently , the correction can extend toward $90 area and take longer time before the stock resume the move to the upside.


Recap:
Alibaba Shares ( BABA ) has a daily bullish structure suggesting more upside in the future. However currently the stock has reached the extreme area $120 – $125 from December 2016 low so no matter which scenario will play out there will be a 3 waves pullback before buyers starts showing up again. Depending on the speed & structure of the correction we’ll know exactly which cycle has ended and where & when will be the ideal area to look for buying opportunities.
 

Elliottwave-Forecast

Master Trader
Feb 17, 2017
2,460
9
84
www.elliottwave-forecast.com
WXY and ABC Elliott Wave Structure

In the video below, we explain the wxy Elliott Wave structure, often called a double three, double correction, or 7 swing Elliott Wave structure. We also compare this wxy structure with abc structure, explaining the similarities and differences.


Double Three Eliott Wave Structure (WXY)


A double three structure, or also called a double correction, or WXY is a 3 waves corrective structure where the third leg (wave Y) is usually 100% – 123.6% of the first leg (wave X) and not more than 161.8%. The subdivision of wave W is in 3 waves, and the subdivision of wave Y is also in 3 waves, thus it is a 3-3-3 structure.

Zig-zag Elliott Wave Structure (ABC)


A zig-zag Elliott Wave structure (ABC) is very similar to WXY. It’s also a 3 waves structure and the third leg (wave C) is usually 100% – 123.6% of the first leg (wave A), and not more than 161.8%. The difference between the two is in the internal subdivision of the first leg and third leg. In ABC, the subdivision of wave A is in 5 waves and the subdivision of wave C is in 5 waves.

Wavers tend to be familiar only with ABC and label every 3 waves move as ABC. In reality, unless the subdivision of the first leg and third leg is in 5 waves, it’s wrong to label every 3 waves move as an ABC. We hope that this video and article helps to clarify the differences and when to label as WXY and when to label as ABC.
 

Elliottwave-Forecast

Master Trader
Feb 17, 2017
2,460
9
84
www.elliottwave-forecast.com
FTSE Elliott Wave View: Extending Higher

Short Term Elliott Wave view in FTSE suggests the rally from 4/20 low (7096.6) is unfolding as a zigzag Elliott Wave structure where Minute wave ((a)) ended at 7302.57 and Minute wave ((b)) ended at 7197.28. Subdivision of Minute wave ((a)) unfolded as an impulse where Minuttte wave (i) ended at 7134.53, Minutte wave (ii) ended at 7104.22, Minutte wave (iii) ended at 7290.82, Minutte wave (iv) ended at 7262.32, and Minutte wave (v) of ((a)) ended at 7302.57. The Index then pullback and ended Minute wave ((b)) at 7197.28

Minute wave ((c)) unfolded as an ending diagonal where Minutte wave (i) ended at 7280.7, Minutte wave (ii) ended at 7222.81, Minutte wave (iii) ended at 7460.20, and Minutte wave (iv) ended at 7435.64. Index has reached 1.618 extension of the Minute ((a)) – ((b)) and thus cycle from 4/20 low is mature and we are calling Minor wave 1 completed at 7533.7. Minor wave 2 decline from there is proposed complete at 7389.26. The Index has since resumed the rally higher and near term, while pullbacks stay above 7389.26, and more importantly above 7096.6, expect FTSE to extend higher. A break above Minor wave 1 at 7533.7 is needed to confirm the next leg higher has started. Until then, a double correction in Minor wave 2 can’t be ruled out. We don’t like selling the proposed pullback.

If FTSE breaks below 7389.26, this suggests the Index is still correcting within Minor wave 2 as a 7 swing structure and this would open extension to the downside to the next 100% – 123.6% in 7 swing. In the event that this happens, the Index remains favored to continue the rally higher again after the 7 swing correction is completed as far as pivot at 7096.6 low remains intact.

FTSE 1 Hour Elliott Wave Chart 05/23/2017


Elliottwave-Forecast

Master Trader
Feb 17, 2017
2,460
9
84
www.elliottwave-forecast.com
ES_F Elliott Wave View: Ending Impulse

Short Term Elliott Wave view in ES_F suggests the rally to 2403.75 ended Minor wave A. Minor wave B unfolded as an Expanded Flat Elliott Wave structure where Minute wave ((a)) ended at 2379, Minute wave ((b)) ended at 2404.5, and Minute wave ((c)) of B ended at 2344.5. After ending the pullback, the Index started a new leg higher and the rally from 2344.5 low looks to be unfolding as a 5 waves Elliott Wave impulse structure where Minutte wave (i) ended at 2375, Minutte wave (ii) ended at 2361, Minutte wave (iii) ended at 2388 and Minutte wave (iv) ended at 2378. Minutte wave (v) is in progress and the Index has scope to extend higher towards 2404.2 – 2410.5 area and this last push higher should also end Minutte wave (a).

Once Minutte wave (a) is complete, the Index is expected to pullback within Minutte wave (b) in 3, 7, or 11 swing to correct cycle from 5/18 low (2344.7) before the rally resumes again. Ideally the last push higher in Minutte wave (v) of (a) breaks above the previous peak at 2404.5 as a break above that level will give confirmation that the Index has started the next leg higher. If Minutte wave (a) can end above 2404.5, there’s a better chance that Minutte wave (b) pullback can hold above 2344.7 for the next leg higher. We don’t like selling the proposed pullback and expect buyers to appear again once Minutte wave (b) pullback is complete at later stage, provided that pivot at 2344.7 low remains intact.

ES_F 1 Hour Elliott Wave Chart 05/24/2017


Elliottwave-Forecast

Master Trader
Feb 17, 2017
2,460
9
84
www.elliottwave-forecast.com
Randgold Resources Short Term Bullish Sequence

Randgold Resources (NASDAQ: GOLD) was founded 22 years ago in 1995, it’s a gold mining business operating in Africa mainly in Mali. The price of Gold & Silver dropped significantly early this month which put a lot of pressure on mining stocks but Rangold was one of the strongest and managed to rally %14 to make new 2017 high. Let’s take a look at the technical chart to identify the potential path.


Since the September 2015 low, GOLD rallied in 5 waves diagonal structure then topped in July 2016 like the precious metals. The stock corrected that rally in a double three structure which reached the equal legs area $72.51 – $64.62 and ended the 7th swing lower. So it held above 2015 low ($54) and bounced from the inflection area to create a higher low sequence supporting the idea of GOLD resuming the rally to the upside.

The Elliott Wave structure can be labeled in different ways depending on how the move will develop and the current most aggressive view would be another 5 waves from December 2016 low with the first wave already in place . Consequently as the stock already made new high last week then it’s now showing an incomplete bullish sequence from the lows that would at least take the stock higher toward equal legs area $110.75 – $117.28. So currently the pullback that should happen from inflection area $98.16-$95.37 needs to hold above March low and buyers needs to step up for the rally to resume higher. The alternative view in case the pivot at March low breaks then GOLD would be doing a flat structure from February peak and still in wave (2) which should ideally hold above $67.54 low to maintain the bullish view.

The short term path can be adjusted according to new price action but while pivot at December 2016 low is intact then the stock should extend higher to reach the equal legs area around $140 from 2015 low. That move can be counted as a simple Zigzag structure and take some time before it happens but it can also be a part of a new impulse sequence and accelerate to the upside.

Randgold Recap

The overall picture for the mining company is suggesting more gains to be seen in the future that could take Rangold stock toward $110 as a first step before breaking to new all time highs targeting $140. The move will be supported by a recovery in the precious metals and using Gold to Silver Ratio could be a good proxy to identify the right timing to start the next leg higher.
 

Elliottwave-Forecast

Master Trader
Feb 17, 2017
2,460
9
84
www.elliottwave-forecast.com
FTSE rallied after completing Elliott wave FLAT

In this technical blog, we are going to take a look at the performance of past Elliott wave FTSE charts from April 2017. Now lets take a look at the 4 hr chart from April 20,2017, which is showing the intermediate cycle in wave (A) in blue unfolded on March 17,2017 peak 7448, below from there intermediate pullback in wave (B) in blue was proposed be in progress as Elliott wave Flat structure. Where Minor wave A in red unfolded in 3 swings (labelled as W,X,Y structure) at 7251 and wave B in red also unfolded in 3 swings (labelled as W,X,Y structure) at 7404 peak. Below from there Minor wave C in red of a flat remained in progress and already showing the enough number of swings within the buying area from the peak. However another marginal push lower was expected within the blue box area (7100-7027) area to complete there as 5 waves structure.

FTSE 4 hour chart


Then we got the nice reaction higher from the mentioned blue box area as expected thus suggesting the intermediate cycle in wave (X) pullback should be completed as Flat structure at 7098 low and allowing buyers to create a risk free position in the trade. Also the bounce from 7098 low looks to be unfolding as continuation pattern i.e. Elliott wave Zigzag pattern, where index was expected to trade higher towards 7403-7452 equal legs area of ((a))-((b)) next as far as pivot from 7098 low remains intact.

1 Hour FTSE Elliott Wave Chart


Since then index rallied as expected & has broken above the March 17,2017 peak 7448 already thus suggesting the next leg higher has already started. Index then did a full retest of 1.618% extension area of ((a))-((b)) 7530 before ending the cycle from 7098 low in Minor wave 1 and started the pullback in Minor wave 2 that should expected to find buyer’s against 7098 low in sequence of 3, 7 or 11 swings for further upside.

1 Hour FTSE Elliott Wave Chart


The index already did a 3 swings pullback in Minor wave 2, so the correction of cycle from 7098 low could be done in the index at yesterday’s low 7389, while above there and more importantly as far as pivot from 7098 low remains intact index has scope to resume the rally again.

FTSE Latest 1 Hour Chart


Keep in mind that the market is dynamic and the view could change in the mean time. Success in trading requires adequate risk and money management, as is the understanding of Elliott Wave theory, cycle analysis and correlation. We have developed a very sensitive trading strategy that defines entry, stop loss and take profit levels with high accuracy and allows you to take risk free position shortly after taking it by protecting your wallet
 

Elliottwave-Forecast

Master Trader
Feb 17, 2017
2,460
9
84
www.elliottwave-forecast.com
USDX forecasting the decline after Flat

Hello fellow traders. In this technical blog we’re going to take a quick look at the past Elliott Wave charts of Dollar Index . We’re going to take a look at the price structures of USDX , count the swings and explain the forecast.

USDX 4 hour update 05.09.2017
As our members know, we were pointing out that USDX is having incomplete bearish swings sequnces within the cycle from the 03/02 peak. From the chart below, we can see that USDX has a clear 5 swing from the peak, when we’re about to complete 6th swing as Irregular Flat. Consequently, we’re calling further weakness once proposed Flat is complete. Dollar index is targeting 97.92-96.91 area ideally.


Now let’s take a look at the short term structures…

USDX 1 Hour Asia Chart 05.11.2017
Dollar Index is about to complete wave ((x)) recovery as expanded flat structure. We got clear 5 waves from the lows that is part of wave (c) of flat. Although, the extreme area is reached at 99.64 -99.92, and we have minimum requirements for correction to complete soon, we see possibility of marginal extension higher within the blue box still.


USDX 1 Hour NY Midday Chart 05.11.2017
We got expected marginal extension and reaction from the blue box. Now we’re calling wave ((x)) recovery completed at 99.88 peak as expanded flat. While the price stays below 99.88 peak further weakness should ideally follow.


USDX 1 Hour London Chart 05.16.2017
99.88 peak held nicely and USDX is now breaking lower, suggesting more downside in 7th swing towards proposed 97.92-96.91 area.


Elliottwave-Forecast

Master Trader
Feb 17, 2017
2,460
9
84
www.elliottwave-forecast.com
ES_F Index Elliott Wave: Resuming Higher

Short Term Elliott Wave view in ES_F Index suggests the rally to 2403.75 ended Minor wave A. Minor wave B unfolded as an Expanded Flat Elliott Wave structure where Minute wave ((a)) ended at 2379, Minute wave ((b)) ended at 2404.5, and Minute wave ((c)) of B ended at 2344.5. After ending the pullback, the Index started a new leg higher and the rally from 2344.5 low looks to be unfolding as a 5 waves Elliott Wave impulse structure where Minutte wave (i) ended at 2375, Minutte wave (ii) ended at 2361, and Minutte wave (iii) is proposed complete at 2411.25. Expect Minutte wave (iv) pullback to commence soon to correct cycle from 5/19 low before turning higher one more time to end Minutte wave (v). This last push higher will also complete larger degree Minute wave ((i)).

Once Minute wave ((i)) is complete, the Index should pullback within Minute wave ((ii)) in 3, 7, or 11 swing to correct cycle from 5/18 low (2344.7) before the rally resumes again. As the Index has broken above the previous peak at 2404.5, it gives more conviction that the Index has started the next leg higher and thus pullback can likely hold above 2344.7 for more upside. We don’t like selling the proposed pullback and expect buyers to appear again once Minute wave ((ii)) pullback is complete at later stage, provided that pivot at 2344.7 low remains intact.

ES_F Index 1 Hour Elliott Wave Chart


Elliottwave-Forecast

Master Trader
Feb 17, 2017
2,460
9
84
www.elliottwave-forecast.com
ES_F E-Mini S&P500 Elliott Wave: Ending wave (iii)

Short Term Elliott Wave view in ES_F E-Mini S&P500 suggests the rally to 2403.75 ended Minor wave A. Minor wave B unfolded as an Expanded Flat Elliott Wave structure where Minute wave ((a)) ended at 2379, Minute wave ((b)) ended at 2404.5, and Minute wave ((c)) of B ended at 2344.5. After ending the pullback, the Index started a new leg higher and the rally from 2344.5 low looks to be unfolding as a 5 waves Elliott Wave impulse structure where Minutte wave (i) ended at 2375, Minutte wave (ii) ended at 2361, and Minutte wave (iii) remains in progress and can reach 2423.13 or 161.8% fibonacci extension of Minutte wave (i). Expect Minutte wave (iv) pullback to start once Minutte wave (iii) is over before turning higher one more leg in Minutte wave (v). This last push higher will also complete larger degree Minute wave ((i)) and as impulse, it should be accompanied with momentum divergence.

Once Minute wave ((i)) is complete, the Index should pullback within Minute wave ((ii)) in 3, 7, or 11 swing to correct cycle from 5/18 low (2344.7) before the rally resumes again. As ES_F E-Mini S&P500 has broken above the previous peak at 2404.5, it gives more conviction that the Index has started the next leg higher and thus pullback can likely hold above 2344.7 for more upside. We don’t like selling the proposed pullback and expect buyers to appear again once Minute wave ((ii)) pullback is complete at later stage, provided that pivot at 2344.7 low remains intact.

ES_F E-Mini S&P500 1 Hour Elliott Wave Chart 05/26/017


Elliottwave-Forecast

Master Trader
Feb 17, 2017
2,460
9
84
www.elliottwave-forecast.com
GBPJPY Elliott Wave: Downside Has Resumed

Short Term GBPJPY Elliott Wave view suggests the decline from 5/10 peak is unfolding as a double three Elliott Wave structure where Minor wave W ended at 143.33 and Minor wave X ended at 145.45. The subdivision of Minor wave W unfolded as a zigzag Elliott Wave structure where Minute wave ((a)) ended at 145.61, Minute wave ((b)) ended at 147.12, and Minute wave ((c)) of W ended at 143.33. After ending Minor wave X at 145.45, pair has since resumed lower and broken below 143.33. This creates a bearish 5 swing incomplete sequence from 5/10 peak and favors more downside in the near term.

GBPJPY Elliott Wave structure of the decline from 145.45 looks to be in a zigzag where Minute wave ((a)) ended at 142.11 and Minute wave ((b)) is proposed complete at 143.09 as a Flat Elliott Wave structure. Pair has broken below 141.81 irregular Minutte wave (b) which suggests that Minute wave ((c)) lower has already started. Near term, while bounces stay below 143.09 in the first degree, but more importantly below 5/25 high (145.45), expect pair to continue lower towards 139.51 – 140.65 area before cycle from 5/10 peak ends. Buyers should then appear from the aforementioned area for an extension higher or at least a 3 waves bounce. We do not like selling the proposed move to the downside.

GBPJPY Elliott Wave 1 Hour Chart 05/31/2017


Elliottwave-Forecast

Master Trader
Feb 17, 2017
2,460
9
84
www.elliottwave-forecast.com
Are the World Indexes close to a Huge peak?

Since the correction between the year 2000 and 2009, many traders around the world have developed an idea of bearish World Indexes with more downside to come. With Fed driving Market, everyone is under the idea that Global Indexes are inflated and will crash again resulting in another decline like the one seen in 2008. Traders, first of all, need to understand that the Market does not move in a straight line, it has never moved in a straight line and never will, consequently correction in different degrees always will take place. It is understandable that the biggest correction we have seen so far was the one that happened between 2000-2009 and someday a correction even bigger that that will happen. It is important to understand that corrections are needed, otherwise there would be no losers and no profit takers. We believe that the Indexes trend will always be Bullish in the Century and Yearly time frames and will do corrections in weekly, monthly and even yearly degree at one stage. We follow all Indexes around the World and apply a system in which we ride the trend is over and market said correction has started and then, we locate the degree and we adjust the counts according to the degrees. We use Elliott wave Theory to count the waves and gather directions, also to explain our ideas to members and followers, but we use several other tools like correlations, sequences, cycles, time and distribution to increase accuracy of our forecasts.

In 2015, we knew it was time for a correction in Daily Time frame and we warned members and followers about it. Read this blog $NIFTY reaching a Warning area for Indexes Bulls and see how the $NIFTY from India was the one that called the extreme in time and price and we knew that was the time for the World Indexes to make a daily correction and pull back in 3 swings at least or extend into 7 or 11 swings. However, at that moment, we also knew that the dip was another chance to buy into the all-time 100% in most World Indexes. Now the World Indexes are not yet at risk of another major peak and any dips should still be considered another chance to buy in 3, 7 or 11 swings.

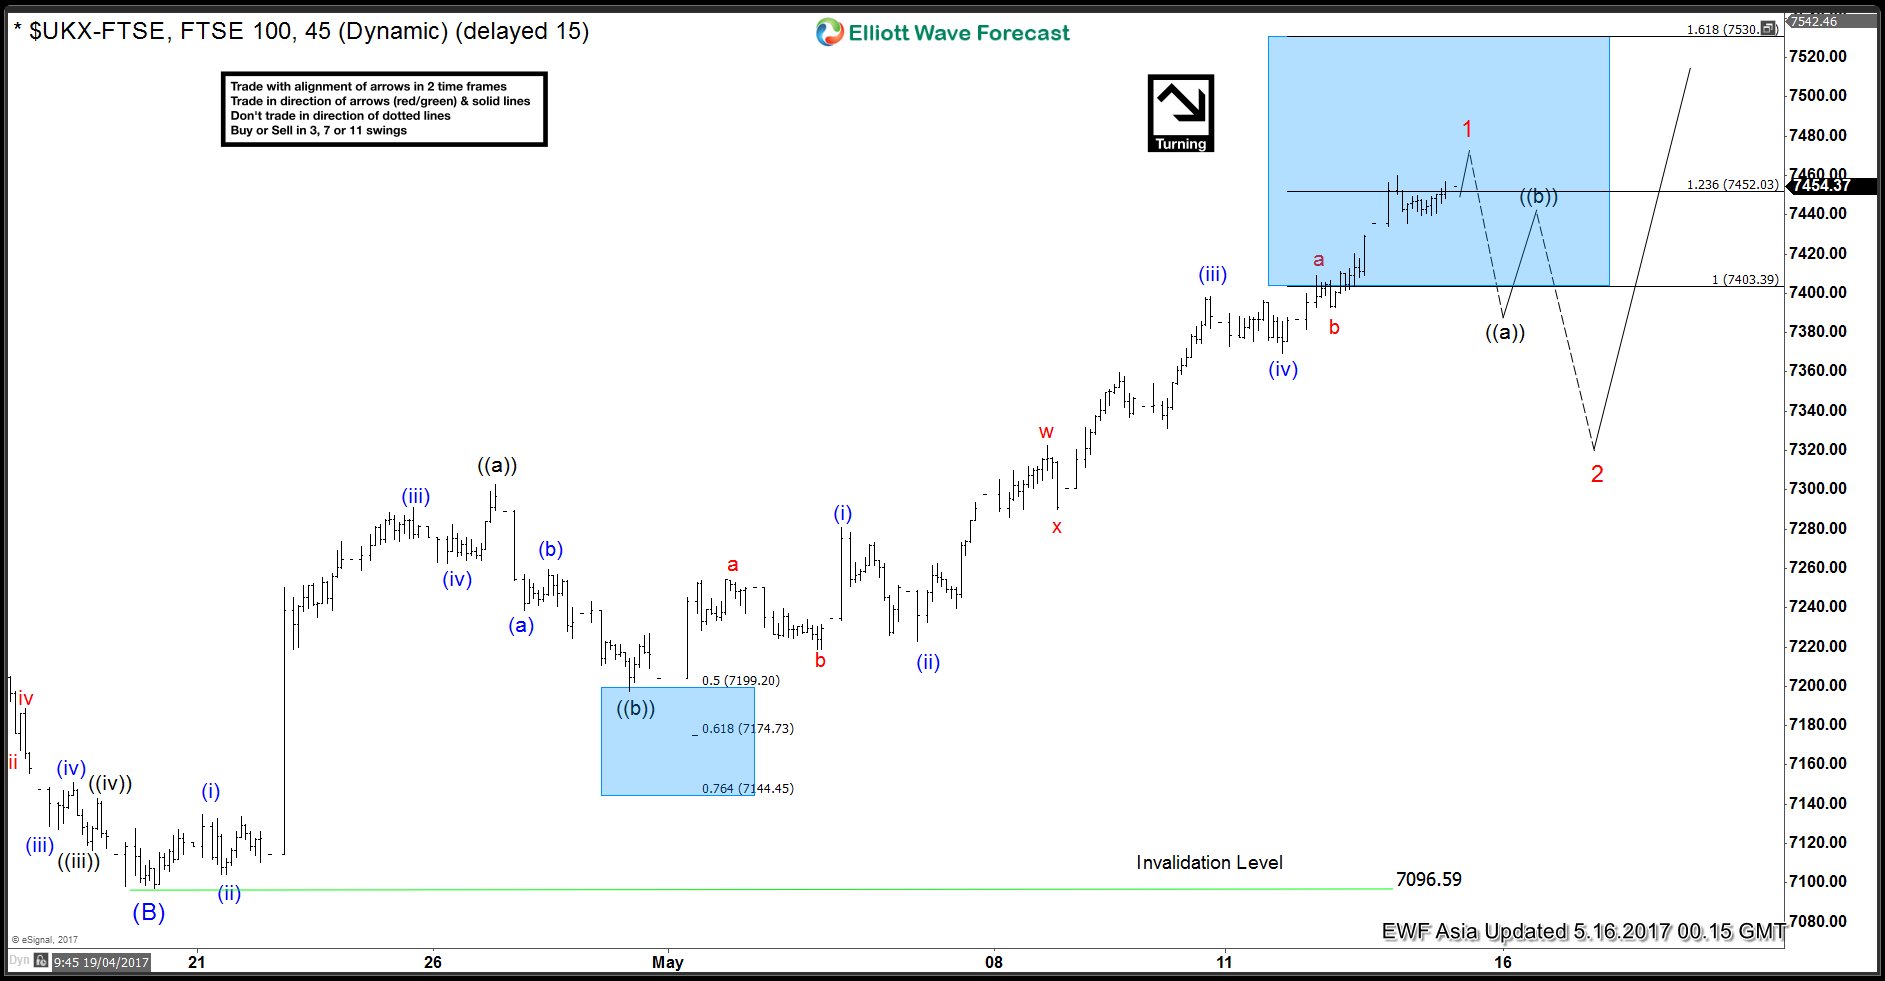
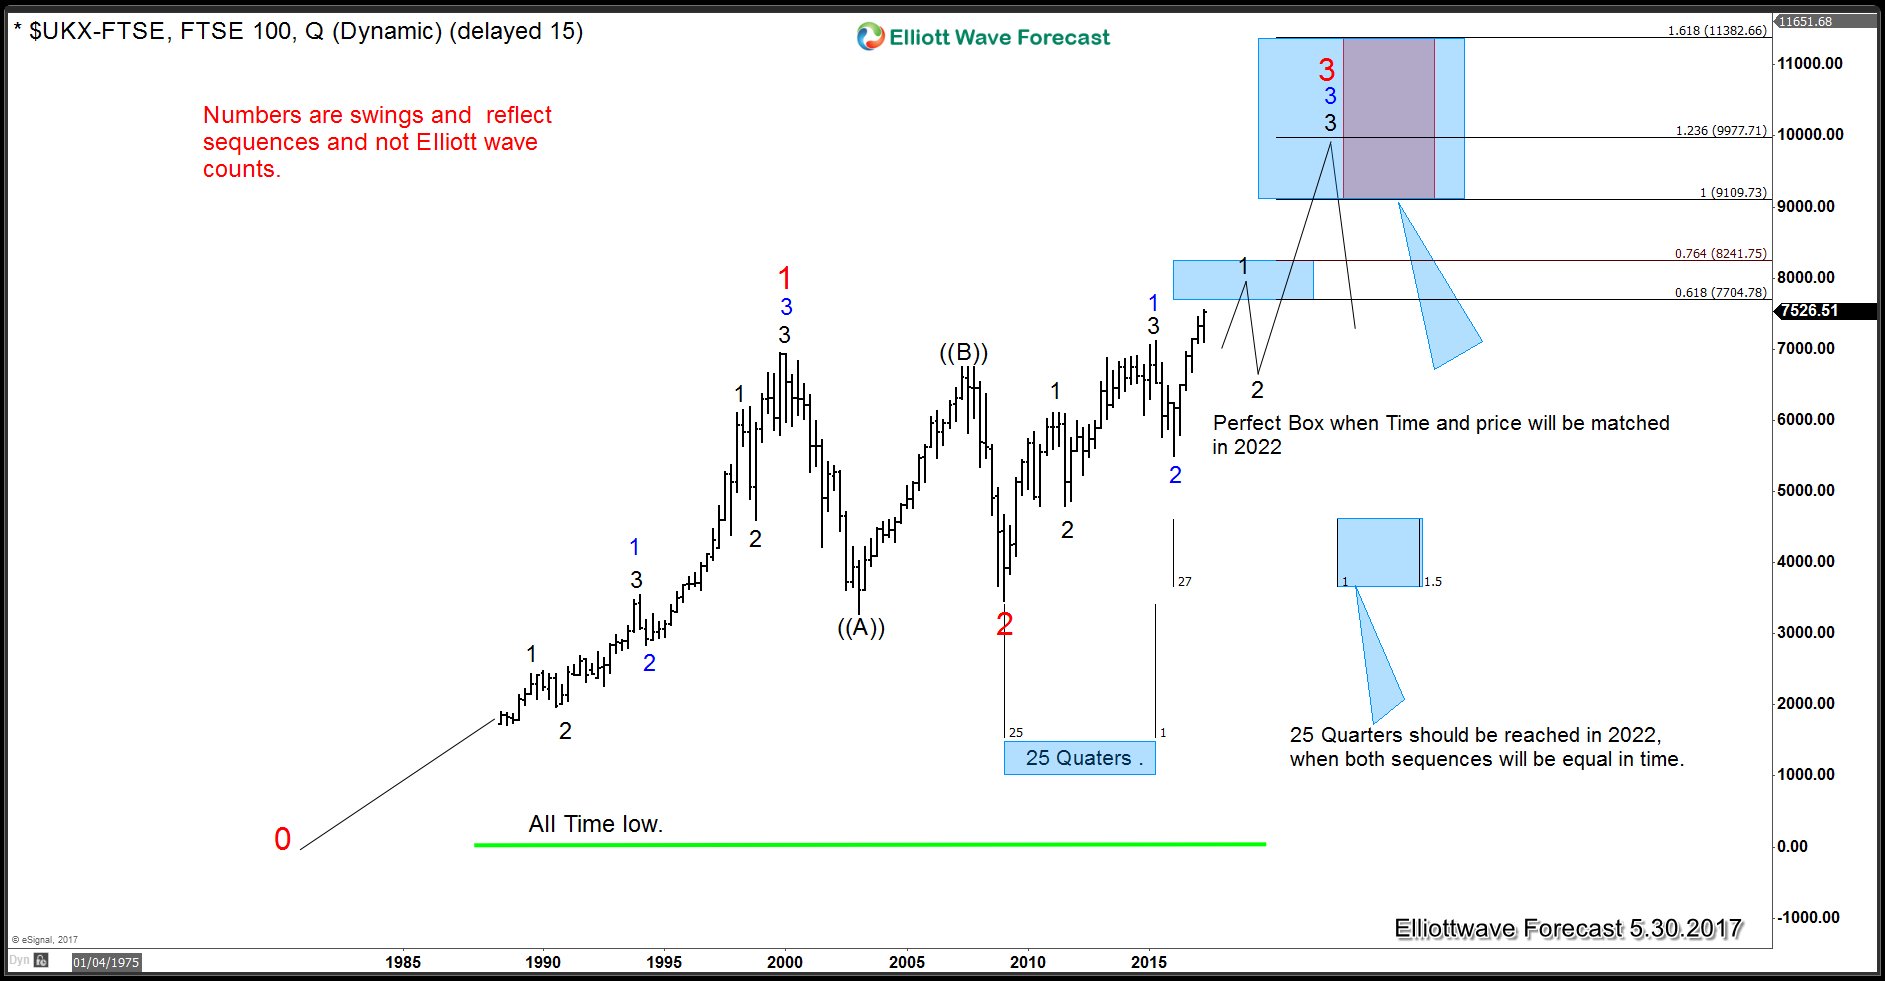
FTSE Swing sequence from the All Time Low


Since the all-time low and following the sequences in 3 different degrees Black/ BLUE /RED, it is clear that Price has not yet reached the 100% Fibonacci extension area between 9109-10000 area and neither time has matched the 1=3 in RED degree, nor 1 Blue = 3 Blue within RED 3. the idea is that soon, market will pull back in 2 BLACK within 3 Blue but still both price and time are calling for stronger Indexes into the years 2022-25 and that’s when there would be a chance of a nice correction either to correct the cycle from 2009 low i.e. 3 RED or the whole cycle since 0 RED. By then, we will get a perfect hit of 3-3-3 and the Index should be ready for at least a Weekly correction. As we mentioned earlier, a big Illusion has been created that a huge Crash needs to happen in the World Indexes but the Reality is that someday a big correction will happen, but picking tops against a clear Bullish trend it is not the right trade. In 2022 the time will be equal from 2009-2015 and 2016 to 2022 which will be equal cycles of 6 years and also if price has reached the 1=3 RED and then 1=3 in BLUE, there will be chance of weekly correction to take place in the World Indexes, until then our strategy remains to buy the dips in 3, 7 or 11 swings and not pick the tops.
 

Elliottwave-Forecast

Master Trader
Feb 17, 2017
2,460
9
84
www.elliottwave-forecast.com
AUDNZD Possible Bounce Higher?

AUDNZD since March 13/2017 has been moving lower. There are possible bullish patterns that can push the pair higher but traders need to see AUDNZD price action slow down and show possible signs that it wants to reverse and bounce higher.

AUDNZD 4 hour Elliott Wave Analysis May 29/2017 : The pair can find support at the inflection zone (Blue box) where wave ((X)) can terminate and possibly bounce higher.


AUDNZD Daily Bullish Pattern #1 : Bullish pattern triggers BUYS at the XA 0.886% Fib. level coinciding with the above inflection zone (blue box). Only a break below point X of the blue pattern will invalidate the bullish pattern.


AUDNZD Daily Bullish Pattern #2 : There is also a possibility of AUDNZD not pushing lower and reversing higher from current levels. A bullish AB=CD pattern has already been triggered at the 1.0% Fib. extension level. As long as price stays above 1.0323 AUDNZD can bounce higher.


If looking to buy AUDNZD we prefer the blue bullish pattern #1 setup. Stops should be placed at 1.0323 (point blue X low) and should be bought at the XA 0.886% Fib. level (1.0402) minimum for a better risk/reward trade with targets above the point A high of the blue pattern #1.

Of course, like any strategy/technique, there will be times when the strategy/technique fails so proper money/risk management should always be used on every trade.
 

Elliottwave-Forecast

Master Trader
Feb 17, 2017
2,460
9
84
www.elliottwave-forecast.com
EURJPY Elliott Wave: Bullish against May 30th low

Short Term EURJPY Elliott Wave view suggests the rally from 4/16 low is unfolding as a double three Elliott Wave structure. Up from 4/16 (114.8) low, Intermediate wave (W) ended at 125.81 and Intermediate wave (X) ended at 122.53. A break above 125.81 however is still needed to add conviction that the next leg higher has started.

From 122.53 low, the rally is also unfolding as a double three Elliott Wave structure. Minute wave ((w)) ended at 125.8 and Minute wave ((x)) ended at 123.11. Near term, while pullbacks stay above 123.11, expect pair to extend higher. If pair breaks below 123.11, then pair is likely doing a double correction from 5/16 peak. This suggests pair can open extension lower to 121.6 – 122.25 area in case of a double correction. From this area, buyers should appear again for an extension higher or at least a 3 waves bounce. We do not like selling the proposed move to the downside and expect dips to find buyers in 3, 7, or 11 swing.

EURJPY 1 Hour Elliott Wave Chart 06/01/2017


Elliottwave-Forecast

Master Trader
Feb 17, 2017
2,460
9
84
www.elliottwave-forecast.com
OPEC Meeting and Impact on Crude Oil

OPEC ended its highly anticipated meeting on Vienna last Thursday to discuss about extending the production cut in Crude Oil. They have decided to extend the current agreement to cut production output by 1.8 million barrels per day by 9 more months to stabilize oil price. Oil prices plunged by more than 5 percent after the decision.


Source: CNBC

Prior to the meeting, almost all of the oil ministers from OPEC and Non OPEC participants have suggested a 9-month production cut extension. This means that the production cut will run until March 2018. Saudi Arabia and Russia have both verbally consented to the extension even before the meeting began. Since they represent the biggest OPEC and Non-OPEC member, this outcome has largely been priced in by the market.

However, market was anticipating further surprise from the meeting such as a deeper and more aggressive production cut. Investors had hoped for further output cut to drain the global glut which depressed oil’s price for almost three years. As the decision outcome only meets the market expectation, disappointed investors ran for an exit following the meeting.

Despite the short term knee-jerk reaction, typical of “buy rumors, sell the facts”, the outlook on Oil prices remain constructive in longer term. The production cuts should help accelerate inventories draw down for the remainder of the year and could set a new floor for Crude Oil price. OPEC also discussed extending the production cuts through June 2018 if the price of Oil keeps falling. Their decision will be reviewed near the end of the nine-month extension.

The Joint Ministerial Monitoring Committee (JMMC) which was established last December to watch the compliance of the production cut, said that OPEC and NOPEC compliance exceeded expectation at 102%. Saudi Arabia has cut production by 553,000 barrels per day, which is 14% higher than their commitment. Due to the budget deficit, Saudi Arabia as the largest member appears committed to stabilizing Oil price. This is contrary to their previous strategy of flooding the market with Oil to drive out U.S. shale companies. With OPEC members determined to support Oil’s price, a higher price floor above Feb 2016 low ($26.05) has likely been established. There are two possible buying areas for Crude Oil’s dip buyers.

Crude Oil Bullish Scenario #1


In the first scenario above, Crude Oil is doing a symmetrical triangle consolidation since June 2016. It is bullish against 5.5.2017 low ($43.76) in the first degree. If pivot at $43.76 holds, then buyers may appear after 3 swing pullback at 45.56 – 46.46 area for an extension higher or a 3 waves bounce.

Crude Oil Bullish Scenario #2


In the second scenario above, Crude Oil is correcting the entire cycle from 2.1.2016. This correction should unfold in 7 swing and become the next option if pivot at 5.5.2017 low ($43.76) fails. The next buying area in the 7th swing extreme area is at 38.02 – 40.71. Buyers should appear in this area for either a new high or at least a 3 waves bounce.

As the market is dynamic, traders need to keep up with the most up-to-date analysis of their favorite instrument. Successful traders need to have a good trading system and also strict risk management with rules that define entry, stop loss, and take profit levels with high accuracy to allow traders to get into a risk free position in your trade as quickly as possible